
2
0
1
8
A
M
T
A
M
e
m
b
e
r
S
u
r
v
e
y
A Descriptive, Statistical Prole
of the
2018 AMTA Membership
and
Music Therapy Community
& Workforce Analysis

Membership Matters — Join AMTA Today 3
A Descriptive,
stAtisticAl profile
of the
2018 AMtA MeMbership
AnD
Music therApy coMMunity
Contents
Highlights .......................................................... 4
Overview...........................................................5
Membership Categories ...................................6
Global Members ...............................................7
Survey Response .............................................8
Gender, Ethnicity and Age ................................9
Weekly Hours Worked .................................... 10
Membership and Average Salary by State ..... 11
Salary by Region ............................................12
Salary by Job Title ..........................................13
Salary by Population Served .........................14
Populations and Work Settings Served ..........15
Salary by Work Setting Served .......................16
Salary by Age Groups Served ........................17
Age Groups Served ........................................17
Salary by Years in the Profession ...................18
Administrative vs. Non-Administrative Jobs ...18
Education and Advanced Degrees .................19
Salary by Level of Education ..........................20
Session Rates ................................................21
Music Therapy Businesses .............................22
Employer-Financed Professional Activities.....23
Purchasing Budgets for Music Therapy ..........23
Job Report ......................................................24
Clients Served ................................................26
Facilities Served .............................................27
Funding for Music Therapy Services ..............28
© 2018, American Music Therapy Association, Inc.
All rights reserved. This document and all information
herein are provided for personal use only. No part of this
document may be reproduced or utilized in any form or by
any means, electronic or mechanical, without permission in
writing from the American Music Therapy Association, Inc.

4 Prole of the 2018 AMTA Membership
Prole of the 2018 AMTA Membership
The overall average
salary reported by
music therapists was
$48,835.
The overall average
salary reported by
music therapists was
$48,835.
An estimated
2.4+ million
people
received
music
therapy
services in
2017.
An estimated
2.4+ million
people
received
music
therapy
services in
2017.
96 new full time music therapy
jobs were reported in 2017
with only 15 jobs reported
eliminated.
96 new full time music therapy
jobs were reported in 2017
with only 15 jobs reported
eliminated.
24% of survey
respondents reported
being the owner
of a music therapy
business.
24% of survey
respondents reported
being the owner
of a music therapy
business.
The most commonly
reported job title was
“Music Therapist,”
by 62% of survey
respondents.
The most commonly
reported job title was
“Music Therapist,”
by 62% of survey
respondents.
31% of survey
respondents reported
receiving some form
of reimbursement for
music therapy services.
Reimbursement for
music therapy services is
steadily growing.
31% of survey
respondents reported
receiving some form
of reimbursement for
music therapy services.
Reimbursement for
music therapy services is
steadily growing.
Reported salaries
for those holding a
Bachelor’s degree as
their highest level of
education range from
$20,000 - $150,000.
Reported salaries
for those holding a
Bachelor’s degree as
their highest level of
education range from
$20,000 - $150,000.
The average annual
salary for those with
10 or fewer years’
experience was a
reported $49,563.
The average annual
salary for those with
10 or fewer years’
experience was a
reported $49,563.
The average rate
for group music
therapy sessions
across the country
is a reported $78
per hour.
The average rate
for group music
therapy sessions
across the country
is a reported $78
per hour.
At a Glance:
2018 Survey Highlights
........................
Music
therapists
provided
services in
an estimated
85,000+
facilities in
2017.
Music
therapists
provided
services in
an estimated
85,000+
facilities in
2017.
The average rate
for individual
music therapy
sessions across
the country is a
reported $69 per
hour.
The average rate
for individual
music therapy
sessions across
the country is a
reported $69 per
hour.
Survey response
increased by 25%
in 2018.
Survey response
increased by 25%
in 2018.
Thanks to all those who submitted survey
responses to make this prole possible!

Membership Matters — Join AMTA Today 5
Prole of the 2018 AMTA Membership
Overview
W
elcome to the 2018 AMTA Member Survey and Workforce Analysis. This document, “A Descriptive
Statistical Prole of the AMTA Membership and the Music Therapy Community,” contains a
detailed, descriptive statistical narrative about demographics, employment, salaries, and facts, which
help to describe many aspects of the music therapy profession. Information regarding employment
has been collected since 1990. Each year, with input from members and other music therapists, a
set of questions is determined for the annual membership survey. Invitations to participate in this
survey are distributed through direct email invitations, newsletter articles, and multiple internet notices.
All music therapists, both members and non-members alike, are invited and encouraged to
complete the survey.
This document is designed to be used by music therapists, administrators, and members of the public
who are attempting to promote the mission of AMTA, to advance public awareness of the benets of
music therapy and increase access to quality music therapy services in a rapidly changing world, and
to inform music therapists and decision makers working toward increasing access to music therapy
services, setting fees, and in determining salaries, increases, and benets. Statistical information
based on survey responses provided herein is divided into categories to best serve the varying
needs of the music therapy profession across the United States and throughout the broad span of
settings in which music therapists work. Data are organized by demographic information and salary
comparisons are shown by multiple categories. This basic statistical information is provided to show
a comprehensive picture of compensation offered for music therapy services across the country as
well as the composition of the music therapy profession.
What follows are simple frequency counts, ranges, and averages. Modes and medians have been
calculated and included to provide a more comprehensive picture of salaries for full time music therapy
services. Whereas the average is an important indicator of reported salaries for music therapists, the
mode is also indicative of expected salaries because it is the most frequently occurring value reported.
The median listed is the number in the middle of the range of a set of numbers, i.e., half the numbers
reported have values that are greater than the median, and half have values that are less. The median
can help serve as a measure of location to indicate when there is a skewed distribution. Each of the
datums reported work together to form a larger picture of the music therapy profession.
As with any business endeavor, multiple factors must be considered when establishing fees and
negotiating salaries for professional music therapy services. These factors include but are not limited
to: level of education; experience; geographic location; business costs (e.g., certication, licensure,
professional memberships, liability insurance, ofce space, equipment, travel, ofce supplies,
etc.); benets (e.g., health, life, and disability insurance; worker’s compensation; vacation and sick
time); and working time involved in assessments, interventions, documentation, billing, meetings,
and treatment team communication. It is recommended that clinicians consider a combination
of several of these factors, rather than any one single category when setting fees to determine a
reasonable and customary rate that is agreeable to prospective clients, employers and service
providers. AMTA does not establish fees for services. It is recommended that music therapists
consult with a business advisor and/or accountant to assist in establishing appropriate professional
fees for delivery of music therapy services.
We hope that you will be able to use this information to help you more accurately describe the profession
of music therapy and expand access to music therapy services. Establishing secure jobs is but one
step along the path of providing quality services to the clients we serve.

6 Prole of the 2018 AMTA Membership
Prole of the 2018 AMTA Membership
AMTA Membership Categories
T
he American Music Therapy Association (AMTA) is the professional association and
intellectual home for music therapists in the United States and around the world. Members
of AMTA not only support the mission, to advance public awareness of the benets of music
therapy and to increase access to quality music therapy services in a rapidly changing world,
but are also committed to their profession through supporting and volunteering with AMTA
programs and initiatives that make music therapy strong. The following chart and graph show
the number of members in each membership category as well as the number of members as
a percentage of the entire membership as of November 1, 2018. Note that the membership
year runs January through December and member numbers accrue until the end of the
calendar year.
Type of Membership Number % of Membership
Professional,
MT-BC ....................................................... 1,877 .....................46.7%
Professional, ACMT/CMT/RMT ..............................................62 ........................1.5%
Professional, Other ...........................................................401 ......................10.0%
Associate .........................................................................21 ........................0.5%
Student ......................................................................... 1,119 .....................27.8%
Graduate Student ...........................................................406 ......................10.1%
Retired .............................................................................64 ........................1.6%
Inactive .............................................................................1 ....................... <0.1%
Life .................................................................................... 1 ....................... <0.1%
Honorary Life ...................................................................41 ........................1.0%
Afliate ............................................................................. 21 ........................0.5%
Patron ...............................................................................4 .........................0.1%
Total Members ............................................................ 4,018
*as of November 1, 2018. Information gathered from member records.
MT-BC
RMT/CMT/ACMT
Other
Professional
Members
AMTA Membership Types
Associate Student Graduate Student
Retired Inactive Life
Honorary Life Affiliate Patron
Professional, MT-BC Professional, RMT/CMT/ACMT Professional, Other

Membership Matters — Join AMTA Today 7
Prole of the 2018 AMTA Membership
Mexico ...................................................... 1
New Zealand ............................................ 2
Norway ..................................................... 2
Philippines ................................................ 2
Puerto Rico ............................................... 4
Singapore ................................................. 5
South Korea.............................................. 4
Spain ........................................................ 2
Sri Lanka .................................................. 1
Sweden..................................................... 1
Taiwan ...................................................... 4
Thailand .................................................... 3
Trinidad ..................................................... 1
Continental United States .................. 3,906
Total AMTA Members* 4,018
Global Reach - AMTA Members Around the World
A
MTA also maintains a wide-reaching, global focus around the world today and works
closely with music therapy organizations in many countries as well as with the World
Federation of Music Therapy. It is exciting to see the number of countries represented by
the AMTA membership and attendance at the AMTA Annual Conference each year. AMTA
members live in over two dozen countries outside the United States and all around the globe.
Members outside the United States comprise 3% of the total AMTA membership.
Country # Members
Argentina .................................................. 1
Australia.................................................... 4
Canada ................................................... 16
China ........................................................ 4
Costa Rica ................................................ 1
Estonia...................................................... 2
France ...................................................... 1
Germany ................................................... 1
Greece ...................................................... 1
Hong Kong................................................ 4
India .......................................................... 1
Israel ......................................................... 4
Italy ........................................................... 1
Japan ...................................................... 38
Kuwait ....................................................... 1
*as of November 1, 2018. Information gathered from member records.
United States
97%
All others 3%

8 Prole of the 2018 AMTA Membership
Prole of the 2018 AMTA Membership
Survey Response
T
he AMTA Member/Music Therapist Survey was conducted online during the summer/fall of 2018.
The pool of potential respondents is estimated to number over 10,000. This volunteer, online survey
made use of a convenience sample. Invitees included AMTA members, members of the National Music
Therapy Registry, former members of the American Music Therapy Association, non-member music
therapists, and others. Participants were solicited using multiple requests via: direct email; AMTA’s
website; AMTA’s member newsletter; public invitations through Facebook, Twitter, Instagram, and
Music Therapy ENews; public invitations were also shared on social media feeds by the Certication
Board for Music Therapists, regional and state association groups, as well as individual members’
social media feeds.
1,852 anonymous responses were received. Since the actual number (denominator) of those
who viewed the survey invitation is unknown, the response rate is an estimation only. The estimated
response rate ranges from 19%, for the pool of potential invitees in AMTA’s database, to 23%, for the
known number of qualied music therapists in the U.S. (see page 26).
2018 response shows an increase of 25% over 2017 (↑371), which may contribute to changes in
comparable data for average salary reports. The survey invitation was publicized in similar ways. Of
those who responded to the survey, 88.4% identied themselves as holding a music therapy designation
or credential. 11.6% of survey respondents identied themselves as not currently holding a music
therapy designation or credential and may include students, graduate students, interns, retirees, or
those who are qualied to practice but are not currently doing so.
Member Responses
1,409 respondents identied themselves as AMTA members, approximately 76% of the survey
response. These 1,409 surveys returned by AMTA members represents 35% of the total AMTA
membership (as of 11/1/18). The 1,021 Professional member responses (noted below) represent
44% of the total AMTA Professional membership as of November 1, 2018. Approximately 22% (416)
of survey responses were from those who indicated that they had not yet become 2018 members of
AMTA.
Survey respondents were asked to indicate their AMTA member status. Member categories they
reported holding appear below. It should be noted that these responses were self-reported and do not
necessarily match up with current member numbers in AMTA records. For example, on November 1,
2018, there was only 1 paid Inactive member; however, 6 people reported their membership status
as “Inactive.”
Member Type Responses
Professional ............................... 1,021
Associate........................................... 1
Student .......................................... 192
Graduate Student .......................... 145
Retired............................................. 34
Inactive .............................................. 6
Life .................................................... 1
Honorary Life..................................... 8
Afliate .............................................. 0
Patron................................................ 1
Total Member Responses ........ 1,409
Professional
72.5%
Associate
0.1%
Student
13.6%
Graduate Student
10.3%
Retired
2.4%
Life
0.1%
Honorary Life
0.6%
Affiliate
0.0%
Patron
0.1%
Inactive
0.4%

Membership Matters — Join AMTA Today 9
Prole of the 2018 AMTA Membership
American
Indian/Alaska Native
0.3%
Asian/Asian
American
4.3%
Black/African
American
1.8%
Hispanic/Latino/Spa
nish
2.7%
Native
Hawaiian/Pacific
Islander
0.0%
White/Caucasian/Eu
ropean
88.4%
Multi-racial
2.1%
Other race or origin
not specified
0.4%
Under 20
0.3%
20-29
38.4%
30-39
25.3%
40-49
13.7%
50-59
12.1%
60-69
8.3%
70 & over
1.9%
Female
87.14%
Male
11.82%
Transgender
0.11%
Gender
Queer/Gender
Nonconforming
0.66%
Different
Identifier
0.27%
Gender, Ethnicity and Age of Survey Respondents
Gender
Gender Number
Female 1,593
Male 216
Transgender 2
Gender Queer/Gender
Noncomforming 12
Different Identier 5
Total Respondents 1,828
Ethnicity
1
Number
American Indian/Alaska Native 5
Asian/Asian American 78
Black/African American 32
Hispanic/Latino/Spanish 49
Native Hawaiian/Pacic Islander 0
White/Caucasian/European 1,608
Multi-racial 39
Other race or origin not specied 7
Total Respondents 1,818
ethnicity
AGe
Age Number
Under 20 12
20-29 680
30-39 457
40-49 258
50-59 213
60-69 167
70 & over 39
Total Respondents 1,826
1
Race categories based on those outlined by the US Census Bureau for the 2010 Census and projected changes to future Census
projects.

10 Prole of the 2018 AMTA Membership
Prole of the 2018 AMTA Membership
Weekly Hours Worked by Survey Respondents
S
urvey respondents were asked to estimate how many hours a week they work as a music
therapist. Over half of all survey respondents reported working full time, which is dened
as working an average of 34 or more hours each week. It should be noted that respondents
to this question included professionals, students, retirees, etc.
Weekly Hours Worked Number of Responses
1 - 9 hours per week 294
10 - 19 hours per week 133
20 - 29 hours per week 160
30 - 33 hours per week 86
34 or more per week (full time) 803
Total Respondents 1,476
1-9
20%
10-19
9%
20-29
11%
30-33
6%
34 or more
54%

Membership Matters — Join AMTA Today 11
Prole of the 2018 AMTA Membership
Membership and Average Salary by State
WA
51
$45,000
OR
47
$43,000
CA
316
$54,600
NV
9
N/A
ID
11
$66,000
ND
16
N/A
SD
3
N/A
NE
10
N/A
NM
7
N/A
CO
112
$49,000
TX
380
$47,917
AK
4
N/A
HI
4
N/A
UT
38
$41,667
WY
3
N/A
AZ
71
$52,846
MT
1
N/A
MI
113
$43,583
TN
70
166
$46,350
FL
WI
75
$47,895
KY
58
$40,000
GA
93
$44,889
IL
140
$43,300
IN
157
$44,680
AL
27
N/A
MS
13
N/A
LA
27
$62,667
AR
8
N/A
IA
59
$58,875
MN
131
$38,933
MO
105
$50,231
OK
31
$53,000
KS
76
$45,700
Outside
the US
149
$54,774
$47,875
VA
102
$41,500
NC
117
$51,077
SC
38
$42,167
NY
281
$53,333
PA
250
$48,485
OH
210
$49,861
DC
8
N/A
MD
78
$46,091
DE
10
N/A
NJ
98
$51,000
CT
52
$56,667
RI
9
N/A
MA
134
$59,882
ME
8
N/A
NH
18
$39,000
VT
8
N/A
WV
17
$38,000
N/A - Insufcient Data Provided
2
For purposes of this survey, data are based on full time employment, which is dened as working 34 hours or more per week.
Top 5 Membership States:
Texas, 380
California, 316
new York, 281
PennsYlvania, 250
ohio, 210
T
his map of the United States depicts the number of AMTA members in each state as of November 1, 2018
and the average full time salary reported on the AMTA survey for each state
2
. The average full-time salary
for all survey respondents, both inside and outside the United States, is $48,835 (a decrease of $2,977 over
2017 reported data). 13 states’ average salaries have increased since last year’s numbers were
compiled, while 22 states’ average salaries have decreased.

12 Prole of the 2018 AMTA Membership
Prole of the 2018 AMTA Membership
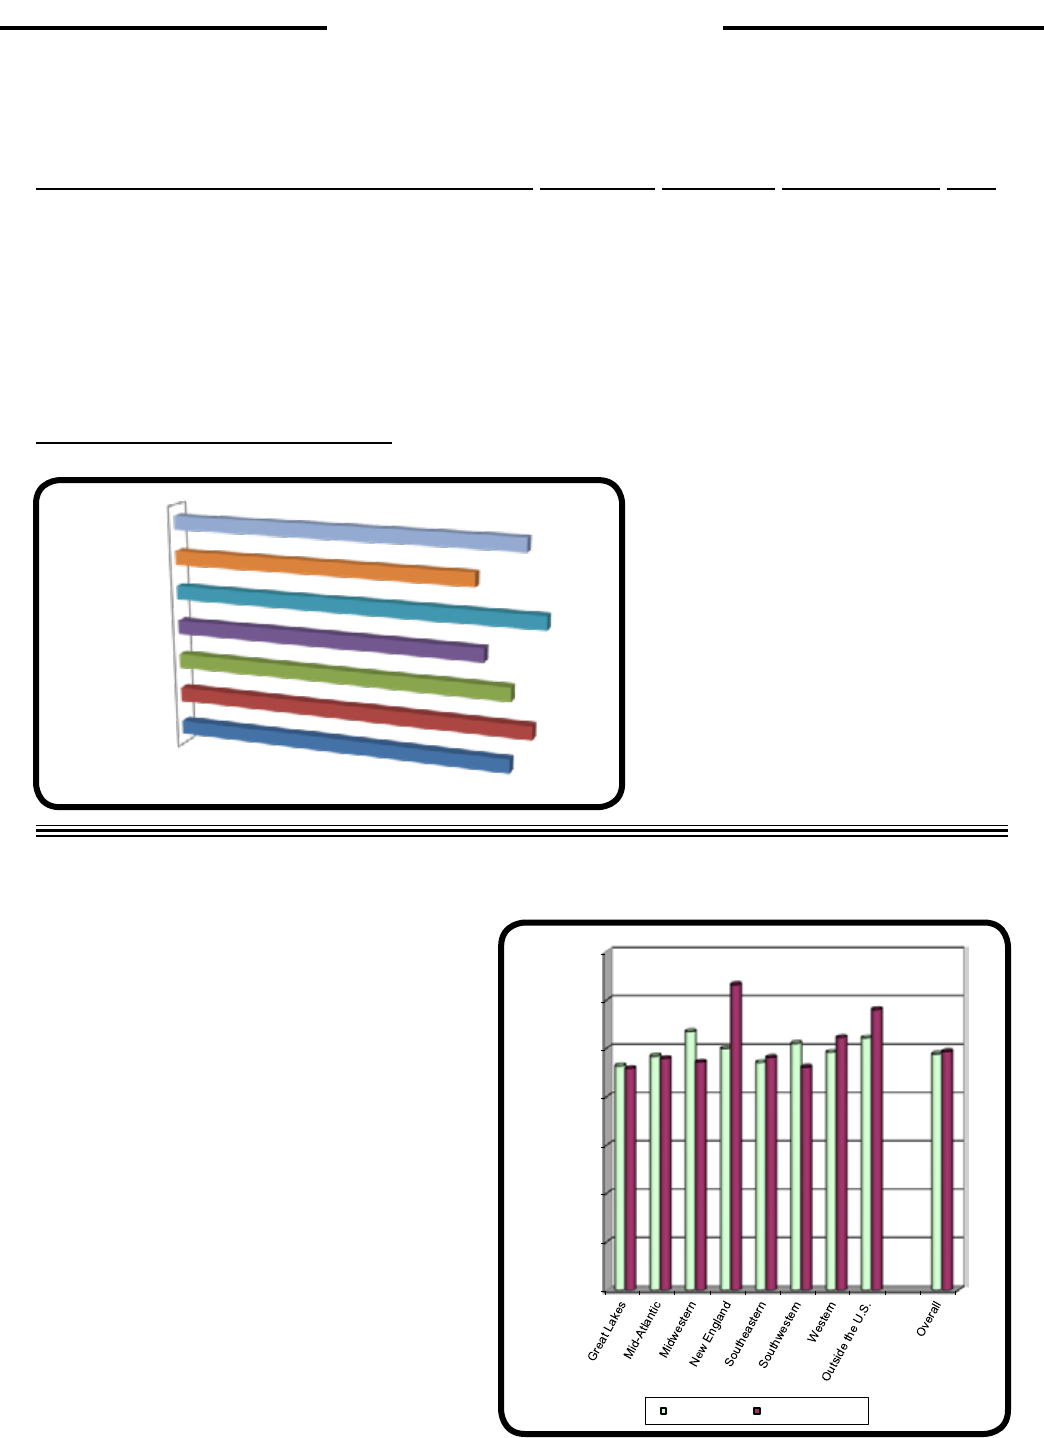
Salary by Region
Number of Average Median Salary
Region Respondents Salary
2
Salary
2
Mode
2
Salary Range
2
Great Lakes 137 $45,577 $42,000 $40,000 $20,000 - $140,000
Mid-Atlantic 101 $48,495 $46,000 $50,000 $20,000 - $150,000
Midwestern 52 $48,885 $47,000 $40,000 $20,000 - $137,000
New England 27 $56,593 $45,000 $45,000 $20,000 - $220,000
Southeastern 71 $47,183 $45,000 $45,000 $20,000 - $100,000
Southwestern 45 $48,067 $47,000 $50,000 $20,000 - $90,000
Western 67 $52,448 $48,000 $40,000 $24,000 - $100,000
Outside the U.S. 22 $54,774 $48,000 $66,000 $26,000 - $115,000
Overall 522 $48,835 $45,000 $50,000 $20,000 - $220,000
2
For purposes of this survey, data are based on full time employment, which is dened as working 34 hours or more per week.
$0
$5,000
$10,000
$15,000
$20,000
$25,000
$30,000
$35,000
$40,000
$45,000
$50,000
$55,000
$60,000
Average Salary by Region
S
urvey responses from the
2018 survey show the overall
average salary reported was
$48,835, a decrease of $
2,977
over salaries reported from the
survey conducted in 2017. The
overall median salary reported in
2018 was $45,000 (a decrease of
$3,000 over 2017 reports); and the
most commonly reported salary
(mode) was $50,000 (an increase of
$10,000 compared to 2017 reports).
A graphic representation of mean
salaries for each region is shown
to the right.
A line graph of overall average
salaries reported by survey
respondents each year since the
inception of AMTA can be seen at
bottom right. One can see only
small decreases over the past 20
years (which may be anomalies
due to survey data and response
rate), but in general, overall reported
music therapists’ salaries have
shown an increase since AMTA’s
inception: from $31,755 in 1998 to
$48,835 in 2018.
$0
$5,000
$10,000
$15,000
$20,000
$25,000
$30,000
$35,000
$40,000
$45,000
$50,000
$55,000
$60,000
Overall Average Salary By Year

Membership Matters — Join AMTA Today 13
Prole of the 2018 AMTA Membership
Salary by Job Title
Average Median Salary Salary
Population Number Salary
2
Salary
2
Mode
2
Range
2
Activity Coordinator/Director 9 $50,000 $40,000 N/A $20,000 - $137,000
Activity Therapist 11 $43,545 $45,000 $20,000 $20,000 - $72,000
Clinical Therapist 4 $47,500 $44,500 N/A $36,000 - $65,000
Creative Arts Therapist 11 $33,364 $34,000 $25,000 $20,000 - $50,000
Director/Admin./Supervisor 24 $49,125 $45,000 $45,000 $20,000 - $120,000
Expressive Arts Therapist 7 $46,286 $45,000 N/A $25,000 - $80,000
Faculty (university/college) 38 $44,526 $42,000 $42,000 $20,000 - $75,000
Music Educator 7 $60,143 $60,000 N/A $32,000 - $100,000
Music Therapist 324 $49,920 $46,000 $40,000 $20,000 - $220,000
Other 31 $46,161 $45,000 $45,000 $20,000 - $80,000
Program Director/Coordinator 10 $46,700 $45,500 N/A $28,000 - $78,000
Recreation Therapist 14 $43,786 $40,500 $40,000 $25,000 - $70,000
Rehabilitation Therapist 15 $42,467 $38,000 $38,000 $20,000 - $120,000
Self Employed/Consultant 3 $62,667 $52,000 N/A $46,000 - $90,000
Total Respondents 552
The category “Other” included: Senior Clinical Supervisor, Clinical Director
N/A - Insufcient data available
2
For purposes of this survey, data are based on full time employment, which is dened as working 34 hours or more per week.
Activity Coordinator/Director
1.72%
Activity
Therapist
2.11%
Creative Arts Therapist
2.11%
Director/Admin./Supervisor
6.51%
Faculty
(university/college)
7.28%
Music Educator
1.34%
Music Therapist
62.07%
Recreation Therapist
2.68%
Rehabilitation
Therapist
2.87%
Self employed/Consultant
0.57%
All Others
10.73%

14 Prole of the 2018 AMTA Membership
Prole of the 2018 AMTA Membership
N/A - Insufcient data available
2
For purposes of this survey, data are based on full time employment, which is dened as working 34 hours or more per week.
3
Respondents were permitted to list as many categories as appropriate. Therefore, the total number of responses may exceed the
number of survey respondents.
Salary by Population Served
Average Median Salary Salary
Population Number
3
Salary
2
Salary
2
Mode
2
Range
2
Abused/Sexually Abused 46 $47,935 $46,000 $45,000 $24,000 - $81,000
AIDS 3 $55,333 $43,000 N/A $28,000 - $95,000
Alzheimer’s/Dementia 122 $50,664 $45,000 $20,000 $20,000 - $220,000
Autism Spectrum Disorders 198 $48,121 $45,000 $50,000 $20,000 - $150,000
Behavioral Disorder 117 $51,051 $45,000 $40,000 $20,000 - $220,000
Bereavement/Grief 52 $49,904 $43,000 $35,000 $22,000 - $140,000
Cancer 65 $52,738 $48,000 $40,000 $20,000 - $140,000
Chronic Pain 38 $48,632 $42,500 $40,000 $20,000 - $118,000
Comatose 5 $58,400 $52,000 N/A $40,000 - $95,000
Intellect./Develop. Disabled (IDD) 175 $47,497 $45,000 $30,000 $20,000 - $150,000
Dual Diagnosed 74 $46,730 $41,500 $40,000 $20,000 - $100,000
Early Childhood 107 $48,935 $46,000 $50,000 $20,000 - $150,000
Eating Disorders 18 $44,944 $41,000 $25,000 $22,000 - $72,000
Elderly Persons 115 $49,843 $45,000 $20,000 $20,000 - $220,000
Emotionally Disturbed 62 $53,129 $45,000 $40,000 $20,000 - $150,000
Forensic 14 $42,929 $40,500 $36,000 $33,000 - $57,000
Head Injured 48 $50,521 $47,500 $40,000 $20,000 - $118,000
Hearing Impaired 39 $54,974 $50,000 $40,000 $20,000 - $150,000
Hospice/Palliative Care 103 $50,204 $43,000 $40,000 $20,000 - $140, 000
Learning Disabled 78 $46,449 $42,000 $30,000 $20,000 - $100,000
Medical/Surgical 48 $49,708 $43,500 $30,000 $22,000 - $137,000
Mental Health 117 $48,496 $45,000 $45,000 $20,000 - $140,000
Multiply Disabled 89 $49,966 $47,000 $50,000 $20,000 - $150,000
Music Education College Students
4 $62,500 $64,000 N/A $42,000 - $80,000
Music Therapy College Students 45 $49,222 $49,000 $35,000 $20,000 - $95,000
Neurologically Impaired 79 $52,937 $50,000 $50,000 $20,000 - $150,000
Non-Disabled 13 $53,923 $52,000 $52,000 $30,000 - $95,000
Other 19 $40,947 $41,000 $45,000 $26,000 - $59,000
Parkinson’s 44 $53,250 $51,500 $20,000 $20,000 - $118,000
Physically Disabled 90 $50,689 $48,000 $50,000 $20,000 - $150,000
Post Traumatic Stress Disorder 61 $47,131 $43,000 $35,000 $20,000 - $118,000
Rett Syndrome 18 $49,667 $51,500 $20,000 $20,000 - $96,000
School Age Population 107 $49,467 $46,000 $40,000 $20,000 - $150,000
Speech Impaired 81 $50,593 $47,000 $40,000 $20,000 - $150,000
Stroke 68 $51,206 $48,500 $40,000 $20,000 - $118,000
Substance Abuse 51 $48,902 $45,000 $45,000 $20,000 - $220,000
Terminally Ill 72 $50,681 $42,500 $40,000 $20,000 - $140,000
Visually Impaired 46 $46,957 $46,500 $20,000 $20,000 - $96,000
Total Respondents
3
522
The category “Other” included:
Antepartum, Children who have undergone trauma, Civil Commitment, College students
w/varied diagnoses, Foster Care, Labor and Delivery, Neonatal Intensive Care Patients, Postpartum, Pregnancy, Retired,
Self-referring Psychotherapy Clients, Trauma, Tuberculosis, Wellness

Membership Matters — Join AMTA Today 15
Prole of the 2018 AMTA Membership
PoPulAtions served by Music therAPists
A
graphic representation of the number of survey respondents who reported working with
specic populations appears here. The largest specied category of survey respondents
falls under the Mental Health
7
umbrella, which accounts for 19% of the populations reportedly
served. The next largest categories are Intellectually Disabled populations
6
, 16%; Medical/
Surgical populations
5
, 13%; Elderly & Alzheimer’s populations, 9%; and Neurological Disorders
4
,
5%. All other populations account for 38% of the total populations served.
4
Neurological Disorders includes Parkinson’s and
Neurologically Impaired.
5
Medical/Surgical includes AIDS, Cancer, Chronic Pain,
Comatose, Hospice/Palliative Care, Medical/Surgical,
and Terminally Ill.
6
Intellectually Disabled includes Autism Spectrum,
Intellectually/Developmentally Disabled (IDD), and Rett
Syndrome.
7
Mental Health includes Behavioral Disorder,
Bereavement/Grief, Eating Disorders, Emotionally
Disturbed, Forensic, Mental Health, Post Traumatic
Stress Disorder, and Substance Abuse.
Work settinGs served by Music therAPists
A
graphic representation of the number of survey respondents who reported working in
specic settings appears below. The largest specied categories of settings reported are
Geriatric Facilities
10
, 16% of survey responses; Medical Settings
8
, 14%; Children’s Facilities/
Schools
11
and Self Employed & Private Practice, 13% each; and Mental Health Settings
9
,
11%. All other settings account for 33% of the total listed. Please see the next page for salary
information organized by work setting.
8
Medical Setting includes General Hospital, Oncology, Home Health Agency, Outpatient Clinic, Partial Hospitalization, and Children’s
Hospital or Unit.
9
Mental Health Setting includes: Child/Adolescent Treatment Center, Community Mental Health Center, Drug/Alcohol Program, Forensic
Facility, and Inpatient Psychiatric Unit.
10
Geriatric Facilities includes: Adult Day Care, Assisted Living, Geriatric Facility - not nursing, Geriatric Psychiatric Unit, and Nursing
Home.
11
Children’s Facilities/Schools includes: Children’s Day Care/Preschool, Early Intervention Program, and School (K-12).
Populations & Work Settings Served
Neurological
Disorders (4)
5%
Medical/Surgical
(5)
13%
Intellectually
Disabled (6)
16%
Elderly &
Alzheimer's
9%
Mental Health (7)
19%
All Others
38%
Self Employed &
Private Practice
13%
Medical Setting (8)
14%
Mental Health Setting (9)
11%
Geriatric Facilities (10)
16%
Children's
Facilities/Schools (11)
13%
All Others
33%

16 Prole of the 2018 AMTA Membership
Prole of the 2018 AMTA Membership
Salary by Work Setting Served
Average Median Salary Salary
Population Number
3
Salary
2
Salary
2
Mode
2
Range
2
Adult Day Services/ Day Care 44 $48,591 $44,000 $50,000 $20,000 - $220,000
Adult Education 1 N/A N/A N/A N/A
Child/Adolescent Treatment Ctr. 21 $42,095 $40,000 $35,000 $24,000 - $75,000
Children’s Day Care/Preschool 32 $47,969 $48,500 $50,000 $20,000 - $80,000
Children’s Hospital or Unit 39 $45,308 $41,000 $40,000 $22,000 - $137,000
Community Based Service 43 $46,233 $45,000 $36,000 $20,000 - $115,000
Community Mental Health Center
10 $43,400 $41,000 $38,000 $24,000 - $69,000
Correctional Facility 6 $44,833 $42,500 $40,000 $37,000 - $57,000
Day Care/Treatment Center 7 $41,000 $41,000 $50,000 $20,000 - $55,000
Drug/Alcohol Program 14 $53,857 $41,000 $41,000 $20,000 - $220,000
Early Intervention Program 26 $44,192 $43,000 $50,000 $20,000 - $70,000
Forensic Facility 7 $40,571 $40,000 N/A $33,000 - $50,000
General Hospital 28 $46,321 $40,500 $30,000 $20,000 - $95,000
Geriatric Facility - not nursing 19 $60,368 $46,000 $24,000 $20,000 - $220,000
Geriatric Psychiatric Unit 11 $50,182 $45,000 N/A $20,000 - $86,000
Group Home 16 $45,500 $38,500 $30,000 $20,000 - $98,000
Home Health Agency 8 $41,875 $39,000 $40,000 $20,000 - $95,000
Hospice/Bereavement Services 68 $53,779 $49,000 $40,000 $20,000 - $140,000
Intermediate Care Facility (DD) 6 $55,667 $55,000 N/A $24,000 - $95,000
Inpatient Psychiatric Unit 48 $47,792 $45,000 $45,000 $25,000 - $82,000
Military Base 1 N/A N/A N/A N/A
Music Retailer 3 $53,333 $50,000 $50,000 $50,000 - $60,000
Nursing Home/Assisted Living 78 $50,679 $44,500 $40,000 $20,000 - $220,000
Oncology 21 $47,667 $47,000 $30,000 $20,000 - $82,000
Other 41 $47,317 $45,000 $30,000 $20,000 - $96,000
Outpatient Clinic 22 $41,909 $40,500 $30,000 $25,000 - $65,000
Partial Hospitalization 13 $53,385 $50,000 $40,000 $25,000 - $95,000
Physical Rehabilitation 13 $53,538 $50,000 $45,000 $30,000 - $90,000
Private Music Therapy Agency 55 $46,655 $43,000 $24,000 $20,000 - $120,000
School (K-12) 72 $48,153 $45,500 $30,000 $20,000 - $150,000
Self Employed/Private Practice 71 $49,690 $48,000 $30,000 $20,000 - $140,000
State Institution 10 $40,700 $40,500 N/A $24,000 - $56,000
Support Groups 6 $50,333 $39,000 $40,000 $20,000 - $140,000
University/College 37 $46,784 $48,000 $35,000 $20,000 - $80,000
Veteran’s Affairs 5 $35,600 $34,000 N/A $23,000 - $56,000
Wellness Program/Center 5 $43,200 $44,000 N/A $35,000 - $50,000
Total Respondents
3
552
N/A - Insufcient data available
2
For purposes of this survey, data are based on full time employment, which is dened as working 34 hours or more per week.
3
Respondents were permitted to list as many categories as appropriate. Therefore, the total number of responses may exceed the
number of survey respondents.
The category “Other” included:
Assisted Living and Memory Care, Children & Adolescent Grief & Bereavement Center, Community Music
School, Eating Disorders Treatment Center, In-Home Services, Inpatient Rehabilitation Hospital, Inpatient/outpatient Psychosomatic Clinic
for Mental Health, Labor and Delivery Center, Music School, Non-prot, Private School, Residential Hospital, Senior Living CCRC, Speech
and Language Camp, University Afliated Music Therapy Clinic

Membership Matters — Join AMTA Today 17
Prole of the 2018 AMTA Membership
Salary by Age Group Served
M
usic therapy is truly a service offered throughout the lifespan and anyone can benet
from music therapy services, regardless of age or experience. A chart showing the age
groups served by survey respondents and salary information reported by those who work with
each age group can be found below.
Average Median Salary Salary
Population Number
3
Salary
2
Salary
2
Mode
2
Range
2
Pre-natal 20 $45,550 $42,000 $42,000 $20,000 - $75,000
Infants/Children 203 $49,138 $47,000 $45,000 $20,000 - $118,000
Pre-teens 203 $49,906 $47,000 $50,000 $20,000 - $118,000
Teens 226 $49,898 $47,000 $45,000 $20,000 - $118,000
Young Adults 256 $48,801 $45,000 $50,000 $20,000 - $120,000
Adults 237 $48,401 $45,000 $50,000 $20,000 - $220,000
Mature Adults 240 $49,433 $45,000 $50,000 $20,000 - $220,000
Seniors 260 $49,092 $45,500 $50,000 $20,000 - $220,000
Total Respondents
3
522
Age Groups Served
A
graphic representation of the number of survey respondents who reported serving specic
age groups appears below. Survey responses are fairly evenly distributed throughout most
of the age groups music therapists serve. With the exception of the Pre-natal age group, each
category is served by between 12% and 16% of survey respondents. Pre-natal populations
are served by 1% of survey respondents. Data gathered conrm that music therapy services
are provided to clients throughout all stages of life.
2
For purposes of this survey, data are based on full time employment, which is dened as working 34 hours or more per week.
3
Respondents were permitted to list as many categories as appropriate. Therefore, the total number of responses may exceed the
number of survey respondents.
Pre-natal
1%
Infants/Children
12%
Pre-teens
12%
Teens
14%
Young Adults
16%
Adults
14%
Mature Adults
15%
Seniors
16%
18 Prole of the 2018 AMTA Membership
Prole of the 2018 AMTA Membership
Salary by Years in the Profession
Number of Average Average Salary Salary
Years in Profession Respondents Salary
2
Salary
2
Mode
2
Range
2
1 - 5 years 215 $48,828 $45,000 $45,000 $20,000 - $120,000
6 - 10 years 71 $51,789 $45,000 $40,000 $20,000 - $150,000
11 - 15 years 62 $48,774 $48,500 $60,000 $20,000 - $120,000
16 - 20 years 42 $45,024 $41,000 $24,000 $20,000 - $96,000
21 - 25 years 39 $53,282 $45,000 $24,000 $20,000 - $220,000
26 - 30 years 27 $43,640 $42,000 $50,000 $20,000 - $86,000
more than 30 years 45 $50,400 $48,000 $50,000 $24,000 - $100,000
Total Survey Respondents 501
O
ver half of all survey
respondents have been
practicing 10 years or less.
Those who have been practicing
music therapy for 1-10 years
reported an average annual
salary of $49,563 with a median
and mode of $45,000.
T
he adjacent graph displays a regional
comparison between average salaries
in jobs that require supervision and/or
administrative duties and jobs in which
administrative duties are not a part of the
expected responsibilities. Music therapists
who work in jobs that are administrative in
nature (either in whole or in part), receive
higher salaries in some, but not all, areas.
From 434 respondents who answered
this survey question, the overall average
administrative salary
2
was $48,933. This
compares to an overall average non-
administrative salary
2
of $49,421.
2
For purposes of this survey, data are based on full time
employment, which is dened as working 34 hours or more per
week.
Administrative vs. Non-Administrative Jobs
1-5 years
6-10 years
11-15 years
16-20 years
21-25 years
26-30 years
more than 30 years
$48,828
$51,789
$48,774
$45,024
$53,282
$43,630
$50,400
$0
$10,000
$20,000
$30,000
$40,000
$50,000
$60,000
$70,000
Administrative
Non- Administrative

Membership Matters — Join AMTA Today 19
Prole of the 2018 AMTA Membership
DA
DHSc
DM
DMA
EdD
MD
PharmD
PhD
PsyD
Other
EdM EdS
JD
MA
MAEd
MAMT
MAR
MAT
MBA
MCAT
MCM
MDiv
MEd
MFA
MHA
MHI
MHR MHSA
MLS
MM
MME
MMEd
MMT
MMTH
MMus
MOT
MPA
MPH
MRcPk
MRE
MS
MSEd
MSM
MSN
MSW
MTROther
No college
degree
Completed
bachelor's degree
Completed
master's degree
Completed
doctorate degree
Education and Advanced Degrees
S
urvey respondents are largely evenly divided between an undergraduate degree (49%) and graduate
degrees (48%). 42% of survey respondents hold a degree at the master’s level, while 6% of
respondents hold a doctoral degree. The majority of those reporting no degree are likely students and
interns. A breakdown of master’s and doctoral degrees held by survey respondents can be seen below.
3
Respondents were permitted to list as many categories as
appropriate. Therefore, the total number of responses may exceed
the number of survey respondents and percentages are approximate.
Highest Level of Education
Education % Responses
No college degree .....................4.2% .................. 76
Bachelor’s degree ....................48.5% ............... 882
Master’s degree ........................41.8% ............... 760
Doctoral degree .........................5.6% ................ 102
Total Respondents 1,820
Breakdown of Master’s Degrees
Master’s Degree % Responses
EdM ..........................................0.64% ................... 6
EdS ...........................................0.21% ................... 2
JD .............................................0.21% ................... 2
MA ...........................................32.84% .............. 310
MAEd ........................................0.85% ................... 8
MAMT .......................................2.54% ................. 24
MAR ..........................................0.11% ................... 1
MAT ..........................................0.64% ................... 6
MBA ..........................................1.38% ................. 13
MCAT ........................................0.42% ................... 4
MCM .........................................0.11% ................... 1
MDiv .........................................0.21% ................... 2
MEd ..........................................3.81% ................. 36
MFA ..........................................0.21% ................... 2
MHA ..........................................0.64% ................... 6
MHI ...........................................0.11% ................... 1
MHR .........................................0.11% ................... 1
MHSA .......................................0.11% ................... 1
MLS ..........................................0.11% ................... 1
MM ............................................9.53% ................. 90
MME .........................................4.03% ................. 38
MMEd .......................................0.95% ................... 9
MMT ........................................15.04% .............. 142
MMTH .......................................0.32% ................... 3
MMus .......................................10.59% .............. 100
MOT ..........................................0.11% ................... 1
MPA ..........................................0.11% ................... 1
MPH ..........................................0.21% ................... 2
MRcPk ......................................0.11% ................... 1
MS ............................................8.69% ................. 82
MSEd ........................................1.59% ................. 15
MSM .........................................0.21% ................... 2
MSN ..........................................0.11% ................... 1
MSW .........................................1.27% ................. 12
Other.........................................1.91% ................. 18
Total Respondents
3
766
Breakdown of Doctoral Degrees
Doctoral Degree % Responses
DA .............................................2.88% ................... 3
DMA ..........................................3.85% ................... 4
EdD...........................................5.77% ................... 6
MD ............................................0.96% ................... 1
PhD..........................................79.81% ................ 83
PsyD .........................................3.85% ................... 4
Other.........................................2.88% ................... 3
Total Respondents
3
104

20 Prole of the 2018 AMTA Membership
Prole of the 2018 AMTA Membership
Salary by Level of Education
S
urvey respondents who worked full time and indicated a salary on the 2018 member survey
were compared by their reported highest level of education. While one might expect
average reported salaries to rise with additional educational degrees, they do not necessarily
do so in this data set. It should be noted that many other variables inuence salary (e.g., years
of experience, setting, and geographic location). It is difcult to determine which is the single
most signicant variable in salary determination and upper- and lower-range salaries exist in
each education level.
Average Median Salary Salary
Highest Level of Education Number Salary
2
Salary
2
Mode
2
Range
2
Bachelor’s Degree 266 $48,940 $45,000 $40,000 $20,000 - $150,000
Master’s Degree 198 $48,798 $45,500 $50,000 $20,000 - $220,000
Doctoral Degree 31 $48,581 $46,000 $50,000 $20,000 - $115,000
Total Respondents 514
A
s with any business endeavor,
multiple factors (many
of which are reported in this
workforce analysis) must be
considered when establishing
fees and negotiating salaries
for professional music therapy
services. These factors
include but are not limited to:
level of education; experience;
geographic location; business
costs (e.g., certication, licensure,
professional memberships,
liability insurance, ofce space,
equipment, travel, ofce supplies,
etc.); benefits (e.g., health,
life, and disability insurance;
worker’s compensation; vacation
and sick time); and working
time involved in assessments,
interventions, documentation,
billing, meetings, and treatment
team communication.
It is recommended that clinicians consider a combination of several of these factors, rather than any
one single category when setting fees to determine a reasonable and customary rate that is agreeable
to prospective clients, employers and service providers. AMTA does not establish fees for services.
It is recommended that music therapists consult with a business advisor and/or accountant to assist
in establishing appropriate professional fees for delivery of music therapy services.
N/A - Insufcient data available
2
For purposes of this survey, data are based on full time employment, which is dened as working 34 hours or more per week.
$48,400
$48,500
$48,600
$48,700
$48,800
$48,900
$49,000
$48,940
$48,798
$48,581

Membership Matters — Join AMTA Today 21
Prole of the 2018 AMTA Membership
Session Rates
The range of average hourly rates reported by
those providing individual sessions can be seen
to the right. Overall, the average rates are fairly
closely grouped among all regions across the
United States.
The range of overall average hourly rates reported
by those providing group session across the United
States can be seen below.
In the case of music therapy assessments,
music therapists may charge an hourly fee for
assessments or a at fee for the entire service.
Music therapy assessments may vary in terms of
time commitment which depends on many factors.
Survey respondents charging a single fee for
assessments were asked to estimate the number
of hours usually invested in an assessment and
divide their total fee by that number for an hourly
average.
individuAl session rAtes
Number Average
Region Respondents Rate/Hr.
Great Lakes 197 $58.22
Mid-Atlantic 178 $83.31
Midwestern 71 $55.66
New England 41 $72.12
Southeastern 107 $63.31
Southwestern 77 $69.00
Western 110 $75.40
Outside the US 21 $80.71
Overall 802 $68.93
GrouP session rAtes
Number Average
Region Respondents Rate/Hr.
Great Lakes 158 $70.04
Mid-Atlantic 153 $78.04
Midwestern 63 $62.57
New England 40 $87.93
Southeastern 101 $81.41
Southwestern 66 $80.17
Western 104 $88.14
Outside the US 20 $80.50
Overall 705 $77.67
AssessMent rAtes
Number Average
Region Respondents Rate/Hr.
Great Lakes 146 $69.73
Mid-Atlantic 130 $102.75
Midwestern 56 $61.45
New England 31 $91.39
Southeastern 88 $75.24
Southwestern 61 $110.44
Western 90 $93.71
Outside the US 18 $75.06
Overall 620 $85.41
W
hile much of the salary data reported in this workforce analysis applies to full time employment, this
page gives an hourly breakdown of fees, which should be helpful for individuals providing music
therapy services in private practice, in part time situations, or as a contractual agreement. Data from
those who report working part time (1-33 hours per week) as well as those who report working full time
(34 hours a week or more) are considered below. As discussed on the previous page, multiple factors
must be considered when establishing fees for professional music therapy services and these factors
should be considered when discussing hourly fees as well. It is recommended that clinicians charging
hourly rates also consider a combination of factors when setting fees to determine a reasonable and
customary rate that is agreeable to both clients and service providers. The full range of cost factors
should be considered so that rates reect the depth and breadth of the music therapy services provided.
The range of overall average rates reported by
those providing assessment services (as reported
both by those working full time and those working
part time) across the United States can be seen
below.

22 Prole of the 2018 AMTA Membership
Prole of the 2018 AMTA Membership
Music Therapy Businesses
A
n emerging area of focus for educational activities at AMTA conferences is in the area
of private practice and music therapy business ownership. Entrepreneurial skills are
becoming a growing area of necessity for new music therapists as their practices expand to
differing types of facilities and span many age groups, populations and settings. Recently,
many new resources and networking opportunities have been made available to support those
in private practice and those who own a music therapy business or employ others. On the
2018 member survey, survey respondents were asked to report whether they were the owner
of a music therapy business and what type of business that might be.
Approximately 24% of 1,683 survey respondents reported being the owner of a music therapy
business. An average number of 1.02 employees was reported by all business owners; most
are sole practitioners. 97% of these business were reported as “for-prot” businesses.
# of
MT Business Owner Response Responses
Music Therapy Business Owner 411
Not a Music Therapy Business Owner 1,272
Total Respondents
1,683
Business Type # of Responses
For prot 350
Non-prot 12
Total Respondents
362
F
or business owners who reported working full-time and contributed an annual
salary to the survey response, the following was reported.
Average Salary
2
$49,742
Median Salary
2
$48,000
Salary Mode
2
$50,000
Range
2
$20,000 - 140,000
Total Respondents 124
N/A - Insufcient data available
2
For purposes of this survey, data are based on full time employment, which is dened as working 34 hours or more per week.
Yes
24%
No
76%
For profit
97%
Non-profit
3%

Membership Matters — Join AMTA Today 23
Prole of the 2018 AMTA Membership
Employer-Financed Professional Activities
M
ore than three-quarters of all survey respondents are receiving some form of nancial
support from their employers for professional activities and continuing education.
Purchasing Budget for Music Therapy Programs
O
ver half of all survey respondents reported receiving a purchasing budget for their programs
of up to $5,000 last year. 86% of music therapists surveyed said they receive monies
from their employers for music therapy program budgets while 14% receive no monies for
purchasing equipment. Many respondents from the $0 category report that they are either
self-employed or in private practice.
% of # of
Activity Responses Responses
AMTA Dues .................................16.3% .......... 217
AMTA Annual Conference ..........17.4% .......... 231
Registration/Certication ............12.2% .......... 162
Given a Fixed Amount Per Year .11.6% .......... 154
Continuing Education .................26.8% .......... 356
State/Regional Conferences.......17.5% .......... 232
Related Conferences/Workshops 16.3% .......... 216
Approval as Needed ...................18.5% .......... 246
Graduate Studies.........................6.9% ............ 92
Leave to Attend Events...............24.9% .......... 331
Other............................................5.9% ............ 79
None ...........................................33.8% .......... 449
Total Respondents
3
1,328
3
Respondents were permitted to list as many categories as appropriate. Therefore, the total number of responses may exceed the
number of survey respondents and percentages are approximate.
# of
Budget Size Responses
$0 174
$1-$1,000 321
$1,001-$5,000 162
$5,001-$10,000 30
more than $10,000 316
Approval by individual expense 430
Other 101
Total Respondents
3
1,234
The category “Other” included: Other Association
Dues, Background Checks, CPR, Health Insurance,
Liability Insurance, Lodging, Private Practice Expenses,
Scholarship Opportunities, Self Care, State Association
Dues, State Licensure, Supervision, Travel, Violence
Prevention Training
Employer
financed
Activities
84%
No professional
activities
financed
16%
$0
14%
$1-$1,000
26%
$1,001-$5,000
13%
$5,001-$10,000
3%
More than
$10,000
1%
Approval by
individual
expense
35%
Other
8%

24 Prole of the 2018 AMTA Membership
Prole of the 2018 AMTA Membership
N
inety-six new full time music therapy positions created in 2017 were reported by survey
respondents. The list below shows populations served as reported by each person holding
one of these new jobs. Over six times more positions were created than were eliminated in
2017.
Positions creAted in 2017
Start a New Music Therapy Program
3
................................................................................ 27
Adult Day Services/Adult Day Care, Child/Adolescent Treatment Center, Children’s Day Care/Preschool, Children’s Hospital or Unit,
Community Based Service Drug/Alcohol Program Early Intervention Program General Hospital Geriatric Facility - not nursing Hospice/
Bereavement Services Inpatient Psychiatric Unit NICU Nursing Home/Assisted Living Partial Hospitalization School (K-12) Support
Groups
Start a Private Practice
3
........................................................................................................ 5
Adult Day Services/Adult Day Care Community Based Service Day Care/Treatment Center Geriatric Facility - not nursing Group Home,
Nursing Home/Assisted Living Outpatient Clinic Private Music Therapy Agency Self Employed/Private Practice Veterans Affairs
Fill a New Music Therapy Position in an Existing Program
3
............................................... 48
Adult Day Services/Adult Day Care Child/Adolescent Treatment Center Children’s Day Care/Preschool Children’s Hospital or Unit
Community Based Service Community Mental Health Center Drug/Alcohol Program Early Intervention Program Forensic Facility,
General Hospital Geriatric Facility - not nursing Geriatric Psychiatric Unit Group Home Home Health Agency Hospice/Bereavement
Services Inpatient Psychiatric Unit Nursing Home/Assisted Living Oncology Outpatient Clinic Palliative Care Partial Hospitalization
Private Music Therapy Agency School (K-12) State Institution Support Groups
Fill a New Music Therapy Position in a Music Therapy Company
3
.................................... 16
Adult Day Services/Adult Day Care Child/Adolescent Treatment Center Children’s Day Care/Preschool, Children’s Hospital or Unit
Community Based Service, Community Mental Health Center, Correctional Facility, Day Care/Treatment Center, Early Intervention
Program, General Hospital, Geriatric Facility - not nursing, Group Home, Hospice/Bereavement Services, Inpatient Psychiatric Unit,
Nursing Home/Assisted Living, Oncology, Outpatient Clinic, Partial Hospitalization, Private Music Therapy Agency, Rehabilitation
Hospital, School (K-12), Self Employed/Private Practice, Support Groups, Veterans Affairs, Wellness Program/Center
Total New Positions Created in 2017 .............................................................................. 96
Job Report
2
- New Full Time Jobs
2
For purposes of this survey, data are based on full time employment, which is dened as working 34 hours or more per week.
3
Respondents were permitted to list as many categories as appropriate. Therefore, the total number of responses may exceed the
number of survey respondents.
0 10 20 30 40 50
Start a New Music Therapy Program
Start a Private Practice
Fill a New Music Therapy Position in an Existing
Program
Fill a New Music Therapy Position in a Music Therapy
Company

Membership Matters — Join AMTA Today 25
Prole of the 2018 AMTA Membership
Positions eliMinAted in 2017
Music Therapy Jobs Cutback ............................................................................................... 5
Facility Closed ...................................................................................................................... 4
Music Therapy Program Closed ........................................................................................... 5
Private Practice Closed ........................................................................................................ 0
Other..................................................................................................................................... 1
Total Positions Eliminated in 2017 .................................................................................. 15
Positions resiGned
Resigned Position for family reasons ........ 2
Resigned Position - changed job ............... 4
Resigned Position - moved........................ 5
Resigned Position - other .......................... 6
Total Positions Resigned ...................... 17
Job Report
2
- Jobs Changed or Lost
2
For purposes of this survey, data are based on full time employment, which is dened as working 34 hours or more per week.
chAnGes to A neW Position
Replace a music therapist ....................... 60
Fill a Music Educator Position ................... 7
Replace a Non-Music Therapist ..............21
Other........................................................ 41
Total Changes to a New Position ....... 129
29
13
2
6
17
7
17
5
-5
-2 -2
0
-2
0
-4
0
Jobs Created vs. Jobs Eliminated
New full time jobs created Full time jobs lost

26 Prole of the 2018 AMTA Membership
Prole of the 2018 AMTA Membership
Clients Served by Music Therapists
S
urvey respondents were asked to estimate the number of clients for whom they provided
music therapy services for the entire year of 2017. 1,338 survey respondents reported
having seen a total of 446,457 clients last year — an average of 334 clients per service
provider. The map below shows the number of clients reported seen last year in each state
and the number of corresponding survey respondents for that state (in parentheses).
Of survey respondents who indicated a job title on their survey, 87% reported their job title as
one which involves mainly clinical responsibilities (i.e., Excluding Director/Admin./Supervisor,
Faculty, and Program Director/Coordinator). As of November 1, 2018, a reported 191 music
therapists were listed on the National Music Therapy Registry and 8,029 board certied music
therapists were reported by the Certication Board for Music Therapists — a total of 8,220
qualied music therapists in the United States as of that date. Extrapolating from the number
of qualied music therapists, if 87% of these 8,220 music therapists each saw an average of
334 clients, then it can be inferred that an estimated 2,388,434 people received music therapy
services last year in the United States.
NB: These reports include both clients seen in both short- and long-term care situations and so the number of clients seen per therapist
may vary greatly depending on the type of care provided.
OR
1,088
(12)
WA
2,647
(19)
ID
128
(6)
NV
3,080
(2)
MT
575
(1)
CA
113,742
(90)
AK
240
(2)
UT
9,313
(18)
CO
2,599
(32)
WY
N/A
AZ
12,193
(26)
NM
937
(5)
TX
73,226
(97)
OK
915
(7)
KS
8,784
(23)
NE
395
(3)
SD
N/A
ND
1,295
(2)
MN
17,832
(82)
IA
2,037
(16)
MO
7,949
(31)
AR
320
(2)
LA
931
(8)
MS
600
(5)
AL
4,745
(11)
GA
18,455
(29)
IL
6,338
(46)
WI
9,113
(33)
MI
19,493
(51)
OH
16,180
(73)
IN
7,459
(68)
KY
1,994 (17)
TN 1,136 (17)
FL
16,655
(57)
SC
8,412
(14)
NC
6,364
(35)
VA
3,431
(31)
WV
1,118
(8)
PA
12,673
(81)
MD
2,870
(20)
DC
775
(4)
DE
2,045
(6)
NJ
3,649
(33)
ME
106
(3)
NY
11,999
(103)
NH
831
(6)
VT
190
(4)
MA
6,790
(36)
CT
4,871
(12)
RI
N/A
Outside the U.S.
7,739
(51)
HI
200
(1)

Membership Matters — Join AMTA Today 27
Prole of the 2018 AMTA Membership
Facilities Served by Music Therapists
S
urvey respondents were asked to estimate the number of distinct facilities in which they
provided music therapy services for the entire year of 2017. 1,388 survey respondents
reported having provided services in a total of 17,089 facilities last year — an average of 12
facilities per service provider. The map below shows the number of facilities served in each
state and the number of corresponding survey respondents (in parentheses).
If 87% of the estimated 8,220 music therapists in the United States (as discussed on the
previous page) each provided services in an average of 12 facilities, it can be inferred that an
estimated 85,824 facilities in the United States offered some form of music therapy services
to clients during the 2017 calendar year.
NB: These reports include both therapists who work full time in individual facilities and those who are in private practice and/or contract to
multiple facilities. The number of facilities served per therapist may vary greatly depending on the type of services provided.
OR
136
(12)
WA
116
(19)
ID
8
(4)
NV
8
(2)
MT
1
(1)
CA
551
(90)
AK
5
(2)
UT
58
(19)
CO
164
(30)
WY
N/A
AZ
116
(28)
NM
23
(5)
TX
651
(94)
OK
29
(7)
KS
102
(24)
NE
25
(4)
SD
N/A
ND
4
(2)
MN
768
(86)
IA
202
(21)
MO
152
(32)
AR
15
(4)
LA
20
(8)
MS
13
(5)
AL
69
(12)
GA
131
(31)
IL
239
(46)
WI
240
(35)
MI
391
(51)
OH
513
(83)
IN
376
(66)
KY 102 (20)
TN 58 (19)
FL
497
(58)
SC
52
(15)
NC
180
(37)
VA
164
(33)
WV
36
(8)
PA
365
(86)
MD
284
(21)
DC
28
(4)
DE
26
(6)
NJ
126
(36)
ME
5
(3)
NY
9,492
(105)
NH
30
(6)
VT
15
(4)
MA
207
(39)
CT
90
(13)
RI
N/A
Outside the U.S.
191
(51)
HI
15
(1)

28 Prole of the 2018 AMTA Membership
Prole of the 2018 AMTA Membership
Funding for Music Therapy Services
A
pproximately 31% of survey responses
reported some form of reimbursement for
music therapy services either via Government
Funding
12
or 3rd Party Reimbursement
13
(see
adjacent graph). A breakdown of all funding
categories reported appears in the chart below. As
government agencies and insurance companies
respond to increased market demand for quality
health care services, music therapy services are
being favored for their ability to meet treatment
goals and address quality of life needs. In response
to increased recognition of music therapy’s unique
contributions, AMTA continues to work to facilitate
the reimbursement process for clients receiving
music therapy services. AMTA offers the E-course,
“Music Therapy Reimbursement: Sources and
Steps to Success,” in its online store, as well as
many member resources to aid music therapists in exploring reimbursement for music therapy services.
Understanding the basics about reimbursement is essential — regardless of a music therapist’s
employment setting or situation. Whether justifying the cost effectiveness in a Medicare PPS system,
establishing eligibility under Medicaid, or documenting medical necessity under private insurance, it is
important to explore all possible reimbursement sources within each work environment.
Number of Percentage of
Funding Source Responses Responses
Financed by Facility/Hospital Budget ................................................................485 ........................18.43%
Don’t Know ........................................................................................................208 .........................7.90%
Endowments .......................................................................................................91 ..........................3.46%
Grants/Donations...............................................................................................370 ........................14.06%
Medicaid Waiver ................................................................................................191 .........................7.26%
Medicare Reimbursement ..................................................................................85 ..........................3.23%
Other...................................................................................................................30 ..........................1.14%
Other - 3rd party payment .................................................................................108 .........................4.10%
Other Gov’t Funds ..............................................................................................88 ..........................3.34%
Other Gov’t Funds (3rd party payment) ...............................................................5 ...........................0.19%
Private Insurance Plans......................................................................................92 ..........................3.50%
Private Pay ........................................................................................................483 ........................18.35%
IDEA/Special Education ....................................................................................165 .........................6.27%
State/County Funding ........................................................................................214 .........................8.13%
Tricare .................................................................................................................8 ...........................0.30%
Workers Compensation .......................................................................................9 ...........................0.34%
Total Respondents
3
1,428
3
Respondents were permitted to list as many categories as appropriate. Therefore, the total number of responses may exceed the
number of survey respondents and percentages are approximate.
12
Gov’t Funding includes: Other Gov’t Funds (less responses appropriate for 3rd Party Reimbursement) and State/County Funding.
13
3rd Party Reimbursement includes: TRICARE, Medicaid, Medicare, Private Insurance Plans, Workers Compensation and appropriate
responses listed in “Other” categories.
3rd Party
Reimbursement
(13)
19%
Don't Know
8%
Endowments
3%
Facility/Hospital
Budget
19%
Grants
14%
Gov't Funding (12)
12%
Private Pay
19%
Special Education
Funding (IDEA, etc.)
6%

Membership Matters — Join AMTA Today 29
Prole of the 2018 AMTA Membership
What You Get for $250 Professional Membership: Value: Over $3300/year:
• Journal of Music Therapy & Music Therapy Perspecves
• AMTA-pro: Free, Online Connuing Educaon
• Member Area of AMTA Website
• Naonal (& Regional) Conference Discounts
• Publicaons & Online E-Courses Discounts
• NMTR Maintenance Discount
• Job Center/Job Hotline/Referrals/Posng a Job
• Online Directory and Yearly Workforce Study
• Private Pracce/Reimbursement/Technical Assistance
• Public Educaon, Advocacy and Job Creaon
• $576
(print and online access)
• $600
(≈$50 per podcast value)
• $218
(based on μ subscripon rates)
• $250
+
• $75
(based on ≈value of 5 purchases)
• $215
• $350
(based on μ subscripon rates)
• $50
• $50
(per 30 minute phone call)
• $1000
Help our profession grow. Become a 2019 member of AMTA today!
...preserve
and protect
the profession
...preserve
and protect
the profession
...promote
music therapy
research
...promote
music therapy
research
...educate
& train
future music
therapists
...educate
& train
future music
therapists
...create
music therapy
jobs
...create
music therapy
jobs
...provide
connuing
educaon
...provide
connuing
educaon
...educate the
public
...educate the
public
W
hen you are a member of AMTA, you support our mission to advance public
awareness of music therapy’s benets and increase access to quality music
therapy services. You commit to iniaves and programs that make music therapy
strong. Not only do you contribute to the important work AMTA does every day,
but you also get a substanal list of benets that support YOU and save you money:
Y
o
u
r
A
M
T
A
M
e
m
b
e
r
s
h
i
p
D
o
l
l
a
r
s
.
.
.
