
1
Northern Arizona Healthcare
Flagstaff Medical Center
Verde Valley Medical Center
Community Health Needs Assessment
2019
Prepared by Cristine Currie with assistance from Rachel Day

2
Table of Contents
Executive Summary……………………………………………………………………………………………………..3
Community Health Needs Assessment………………………………………………………………………..6
Methodology
Survey Instrument
Community defined for assessment
Key informant Focus Groups…………………………………………………………………………………………..7
Community Feedback on Prior Assessment & Implementation ………….………………………….8
Public Health, Vital Statistics & other Data ……………………………………………………………………8
Summary of Findings
Area of Opportunity………………………………………………………………………………………………………….10
Northern Arizona Population Demographics .............................................................................. 15
Death Disease and Chronic Conditions ....................................................................................... 19
Arizona Health Status and Vital Statistics .................................................................................. 24
Infectious Disease ........................................................................................................................ 40
Births ............................................................................................................................................. 46
Modifiable Health Risks ............................................................................................................... 50
2019 Community Needs Survey ................................................................................................... 57
Survey Questions ....................................................................................................................... 58
Individual Responses to Health Issues ................................................................................ 106
Conclusion…………………………………………………………………………………………………………………………….117
Sources…………………………………………………………………………………………………………………………………118

3
Executive Summary
Introduction
Northern Arizona Healthcare (NAH) is the largest healthcare organization in a region that
encompasses more than 50,000 square miles.
Serving more than 700,000 people in communities across the region, NAH provides
comprehensive healthcare services through two hospitals – Flagstaff Medical Center (FMC) and
Verde Valley Medical Center (VVMC) – as well as through primary care and specialty physician
clinics, outpatient surgical centers, the Heart & Vascular Center of Northern Arizona, Cancer
Centers of Northern Arizona Healthcare, EntireCare Rehab & Sports Medicine, Fit Kids of
Arizona, Guardian Air and Guardian Medical Transport and Valley View Care.
As a nonprofit healthcare system, our organization is governed by a volunteer board of
directors.
Our mission is Improving Health and Healing People. The community health needs assessment
(CHNA) allows identification of health needs and opportunities in communities we serve. NAH is
thus better able to respond, as well as collaborate with other organizations, to address
community needs such as Access to Care, Behavioral Health and Chronic Disease.
Overview
This 2019 Community Health Needs Assessment is the fourth assessment since the Patient
Protection and Affordable Care Act of 2010 which required hospitals to conduct a CHNA every
three years. Similar assessments conducted or supported by NAH in 1996, 2010, 2013, 2016,
and 2017 provide a framework for the 2019 CHNA
CHNA guidelines require hospital to complete all of the following steps:
I. Define the community
II. Assess the health needs of that community
III. Solicit and take into account input received from persons who represent the broad
interests of that community, including those with special knowledge of or expertise
in public health
IV. Document the CHNA in a written report
V. Ensure the CHNA report is adopted by an authorized body of the hospital facility
VI. Make the CHNA report widely available
The CHNA includes both qualitative and quantitative data to determine current health needs.
The 2016 CHNA led to a wide scale effort to gather voices from the community. Since 2016,
NAH has partnered with Northern Arizona Behavioral Health Foundation and Northern Arizona
University to gather qualitative data. This included synthesized existing health and needs
assessments relevant to the northern Arizona region (N=57); attending stakeholder
organizational meetings (N=18), conferences and community forums (N=13); completed

4
interviews with community leaders and service providers in many different sectors of public life
(N=62); and completed seven focus groups with community members (N=49).
The 2019 CHNA goals are to:
I. Identify the current health needs, opportunities and assets in the NAH primary service
area
II. Engage colleagues, community members and organizations through the process
III. Determine 2019 priorities and implementation strategy
Additionally, the 2019 CHNA will serve as a tool toward achieving the four NAH foundational
objectives:
I. Be People Centric
II. Provide Better Care Always
III. Provide NOW Access for Amazing Experience
IV. Provide Value and Be Sustainably Affordable
Defining Community
The community assessed in this CHNA is NAH’s primary service area. NAH uses the following
definition to determine the primary service area: NAH’s primary service area is the geographic
area that generates at least 75% of inpatient admissions (whether that be defined by counties,
cities, or zip codes). Once beyond the 75% threshold, hospitals have discretion as to what other
areas they include in their ‘Primary Service Area’.
Based on this (which aligns with the above guidelines for defining the primary service area), our
primary service areas are defined as follows (NOTE: all of the VVMC zip codes are also included
in the FMC zip codes):
FMC 86001, 86002, 86003, 86004, 86005, 86011, 86015, 86017, 86018, 86023,
86024, 86025, 86033, 86034, 86035, 86038, 86040, 86045, 86046, 86047, 86320,
86322, 86324, 86325, 86326, 86331, 86335, 86336, 86337, 86339, 86340, 86341,
86342, 86351, 86401
VVMC 86322, 86324, 86325, 86326, 86331, 86335, 86336, 86339, 86340, 86341,
86342, 86351
NAH (as a system) captures ~57-59% of the inpatient discharges, from the above zip codes—
which amounted to 14,439 discharges in FY18 and 13,886 discharges in FY19.
Key Findings
Top Community Health Concerns among Community Key Informants
Key informants were asked to write down what they individually perceive as the top five health
priorities for the community, based on the group discussion as well as on their own experiences
and perceptions. Their responses were collected, categorized and tallied to produce the top-
ranked priorities as identified among key informants.
I. Access to Healthcare, Including Transportation
II. Mental / Behavioral Health

5
III. Substance Abuse
IV. Nutrition
V. Injuries
VI. Chronic Disease
VII. Collaboration among organizations
Top Community Health Concerns among Community Members
Community Members were asked to share any other health concerns not addressed by the
survey. Their responses were collected, categorized and tallied to produce the top-ranked
priorities as identified among community members.
I. Access to Behavioral Health care
II. Access to Primary Care Providers
III. Lack of specialists (Pediatric)
IV. Access to affordable health insurance/health care in the community
V. Providers (physician/ staff) seen as uncaring, long wait for appointments
Areas of Opportunity Identified in the Flagstaff Region:
I. Access to Health Services
II. Mental Health & Mental Disorders
III. Injury & Violence Prevention
IV. Chronic Health Conditions
Areas of Opportunity Identified in the Verde Valley Region:
I. Access to Health Services
II. Mental Health & Mental Disorders
III. Substance Abuse
IV. Respiratory Health
Final prioritized needs identified for the Northern Arizona Healthcare primary service area
Taking into account data and all of the above community input, the final list of prioritized needs
is:
I. Access to Healthcare
II. Mental / Behavioral Health
III. Chronic Disease
Solutions to address the prioritized needs
I. Collaboration with organizations across the region to compliment services and provide
interdisciplinary support for community members.
II. Social Determinants of Health need to play a key role in healthcare and patient care
plans going forward.
III. Increase quantity and quality of health services
IV. Increase capacity through training and collaboration
V. Integrate health services: primary care, mental health, etc whenever possible
VI. Increase awareness of existing health and social resources

6
Northern Arizona Healthcare 2019 Community Health Needs Assessment
Assessment Process
Methodology
This assessment incorporates data from both quantitative and qualitative sources. Quantitative
data input includes primary research (the NAH Community Health Needs Assessment survey
using Survey Monkey) and secondary research (vital statistics and other existing health-related
data); these quantitative components allow for trending and comparison to benchmark data at
the state and national levels. Qualitative data input includes primary research gathered through
a Key Informant Focus Group conducted in depth in 2018 – 19 throughout northern Arizona’s
five counties.
Survey Instrument
The survey instrument used for this study is based largely on the Centers for Disease Control
and Prevention (CDC) Behavioral Risk Factor Surveillance System (BRFSS), as well as various
other public health surveys and customized questions addressing gaps in indicator data relative
to health promotion and disease prevention objectives and other recognized health issues. NAH
developed the final survey instrument, and it is similar to the previous surveys used in the
region, allowing for data trending.
Community Defined for This Assessment
The community assessed in this CHNA is NAH’s primary service area. NAH uses the following
definition to determine the primary service area: NAH’s primary service area is the geographic
area that generates at least 75% of inpatient admissions (whether that be defined by counties,
cities, or zip codes). Once beyond the 75% threshold, hospitals have discretion as to what other
areas they include in their ‘Primary Service Area’.
Based on this (which aligns with the above guidelines for defining the primary service area), our
primary service areas are defined as follows (NOTE: all of the VVMC zip codes are also included
in the FMC zip codes):
FMC 86001, 86002, 86003, 86004, 86005, 86011, 86015, 86017, 86018, 86023,
86024, 86025, 86033, 86034, 86035, 86038, 86040, 86045, 86046, 86047, 86320,
86322, 86324, 86325, 86326, 86331, 86335, 86336, 86337, 86339, 86340, 86341,
86342, 86351, 86401
VVMC 86322, 86324, 86325, 86326, 86331, 86335, 86336, 86339, 86340, 86341,
86342, 86351
NAH (as a system) captures ~57-59% of the inpatient discharges, from the above zip codes—
which amounted to 14,439 discharges in FY18 and 13,886 discharges in FY19.
A geographic description is illustrated in the following map:

7
2012 PRC Community alth
Key Informant Focus Groups
As part of the Community Health Needs Assessment, a focus group was held in collaboration
with Coconino County Health and Human Services and Yavapai County Community Health
Services as part of their Community Health Improvement Plans. The focus group included key
informants in the community, such as: representatives from public health; physicians; other
health professionals; social service providers; and other community leaders. Agencies
represented were:
Coconino County CHIP Access to Care Group: North Country Healthcare, Flagstaff Unified
School District, Northern Arizona University, Native Americans for Community Action, Northern
Arizona Regional Behavioral Health Authority, Highlands Fire District, Salvation Army, United
Way of Northern Arizona, Northern Arizona Counsel on Aging, First Things First, Flagstaff Family
Food Bank, and Northern Arizona Intergovernmental Public Transportation Authority.
Yavapai County CHIP Group: Yavapai Justice & Mental Health Coalition, Spectrum Healthcare,
Cottonwood-Oak Creek Unified School District, NAMI Sedona, NAMI Yavapai, Care 1
st
, Family
Involvement Center, Expect More AZ, NACOG-AAA, Verde Valley Caregivers, Alzheimer’s
Association, and First Things First.
The Northern Arizona Indian Health Collaboration and the Diabetes Together groups were also
involved as focus groups as part of their quarterly or monthly meetings.

8
Participants were chosen because of their ability to identify primary concerns of the
populations with whom they work, as well as of the community overall. Participants included a
representative of public health, as well as several individuals who work with low-income,
minority or other medically underserved populations, and those who work with persons with
chronic disease conditions.
NOTE: These findings represent qualitative rather than quantitative data. The groups were
designed to gather input from participants regarding their opinions and perceptions of the
health of the residents in the area. Thus, these findings are based on perceptions, not facts.
Community Feedback from prior Community Health Needs Assessments
Community members are encouraged to provide feedback and input for our prior and current
Community Health Needs Assessment and Implementation Plan. Comments may be emailed
to:
There were no comments received by Northern Arizona Healthcare, outside of the Focus
Groups or community survey regarding the 2016 Community Health Needs Assessment or
Implementation Plan.
Public Health, Vital Statistics & Other Data
NAH consulted a variety of existing (secondary) data sources to complement the research
quality of this Community Health Needs Assessment. Date came from the following sources
(specific citations are included with the graphs throughout this report):
Arizona Department Health Services
Arizona Department of Public Safety
Centers for Disease Control & Prevention
National Center for Health Statistics
US Census Bureau
US Department of Health and Human Services8
US Department of Justice, Federal Bureau of Investigation
Note that secondary data reflect county-level data for the Northern Arizona Counties.
Benchmark Data
Trending
On behalf of NAH, PRC administered similar surveys in Flagstaff in 1996 and 2010. CHNA’s have
been conducted every 3 years since, including an additional one in 2017. Trending data, as
revealed by comparison to prior survey results (among ZIP Codes common across all studies),
are provided throughout this report whenever available. Historical data for secondary data
indicators are also included for the purposes of trending.

9
Arizona Risk Factor Data
Statewide risk factor data are provided where available as an additional benchmark against
which to compare local survey findings; these data are reported in the most recent BRFSS
(Behavioral Risk Factor Surveillance System) Prevalence and Trend Data published by the
Centers for Disease Control and Prevention and the US Department of Health & Human
Services. State-level vital statistics are also provided for comparison of secondary data
indicators.
Nationwide Risk Factor Data
National-level vital statistics are also provided for comparison of secondary data indicators.
Healthy People 2020
Healthy People provides science-based, 10-year national objectives for improving the health of
all Americans. The Healthy People initiative is grounded in the principle that setting national
objectives and monitoring progress can motivate action. For three decades, Healthy People has
established benchmarks and monitored progress over time in order to:
Encourage collaborations across sectors.
Guide individuals toward making informed health decisions.
Measure the impact of prevention activities.
Healthy People 2020 is the product of an extensive stakeholder feedback process that is
unparalleled in government and health. It integrates input from public health and prevention
experts, a wide range of federal, state and local government officials, a consortium of more
than 2,000 organizations, and perhaps most importantly, the public.
More than 8,000 comments were considered in drafting a comprehensive set of Healthy
People 2020 objectives. These findings are used to now draft Healthy People 2030.
Information Gaps
While this assessment is quite comprehensive, it cannot measure all possible aspects of health
in the community, nor can it adequately represent all possible populations of interest. It must
be recognized that these information gaps might in some ways limit the ability to assess all of
the community’s health needs.
For example, certain population groups — such as the homeless, institutionalized persons, or
those who only speak a language other than English or Spanish — are not well represented in
the survey data. Other population groups — for example, pregnant women,
lesbian/gay/bisexual/transgender residents, undocumented residents, and members of certain
racial/ethnic or immigrant groups — might not be identifiable or might not be represented in
numbers sufficient for independent analyses.
In terms of content, this assessment was designed to provide a comprehensive and broad
picture of the health of the overall community. However, there are certainly a great number of
medical conditions that are not specifically addressed.

10
Summary of Findings
Areas of Opportunity for Community Health Improvement
The following “health priorities” represent recommended areas of intervention, based on the
information gathered through this Community Health Needs Assessment and the guidelines set
forth in Healthy People 2020. From these data, opportunities for health improvement exist in
the region with regard to the following health areas (see also the summary tables presented in
the following section). These areas of concern are subject to the discretion of area providers,
the steering committee, or other local organizations and community leaders as to actionability
and priority.
Community Members were asked to share any other health concerns not addressed by the
survey. Their responses were collected, categorized and tallied to produce the top-ranked
priorities as identified among community members. These were used to complement and
corroborate findings that emerge from the quantitative dataset.
Key informants were asked to write down what they individually perceive as the top five health
priorities for the community, based on the group discussion as well as on their own experiences
and perceptions. Their responses were collected, categorized and tallied to produce the top-
ranked priorities as identified among key informants. These were used to complement and
corroborate findings that emerge from the quantitative dataset.
Prioritization Process
After reviewing the Community Health Needs Assessment findings and process of
understanding key local data findings (Areas of Opportunity), NAH ranked identified health
issues against the following established, uniform criteria:
Magnitude. The number of persons affected, also taking into account variance from
benchmark data and Healthy People targets.
Impact/Seriousness. The degree to which the issue affects or exacerbates other quality
of life and health-related issues.
Feasibility. The ability to reasonably impact the issue, given available resources.
Consequences of Inaction. The risk of not addressing the problem at the earliest
opportunity.
Prioritization Results
Areas of Opportunity Identified Through This Assessment:
From this exercise, the Areas of Opportunity were prioritized as follows:
Access to Health Services
NAH has worked consistently since 2016 to improve access to care, as have other healthcare
providers. Community members continue to consistently express concern about access.
Therefore this is still a priority for the 2019 CHNA.

11
Adult overall health status
Cost as a Barrier to Physician Visits
Cost as a Barrier to Physician Visits
Difficulty Accessing Healthcare
Difficulty Accessing Healthcare
Insurance Instability for Adults and Children
Lack of access to affordable health insurance
Lack of local specialists (endocrinologist, neurologist, pediatric)
Providers (physician/ staff) seen as uncaring, long wait for appointments
Routine Checkups (Adults)
Routine Checkups (Adults)
Transportation
Resources available for Access to Health Services (including transportation as a barrier)
Arizona Health Care Cost Containment System (AHCCCS)
Camp Verde Unified School District
Coconino County Health & Human Services
Community Health Center of Yavapai (FQHC)
Cottonwood – Oak Creek School District
Flagstaff Medical Center
Flagstaff Shelter Services
Flagstaff Unified School District
Guardian Medical Transport
Highlands Fire District
Hospice Comassus
Independent Providers
LHC Group
Lyft
Mingus High School District
Mountain Line Bus System
Native Americans for Community Action
NorthCountry Health Care (FQHC)
Northern Arizona Healthcare Medical Group
Northern Arizona University Health Services
Northland Hospice
Poore Medical Clinic
Sacred Peaks Health Center
Sedona – Oak Creek Unified School District
Sedona Fire Department
Spectrum Healthcare
Uber
Verde Valley Ambulance

12
Verde Valley Caregivers
Verde Valley CATLine
Verde Valley Medical Center
Yavapai County Department of Health Services
Actions/Changes for Access to Healthcare since 2016 CHNA
Identified patient populations are enrolled in community care management at
FMC and VVMC
Northern Arizona Healthcare Medical Group Primary Care clinics have increased
the number of providers to provide primary and preventive healthcare services.
o Same day appointments are offered by FMC and VVMC primary care
offices
o FMC and VVMC primary care offices offer extended hours to improve
access
o NAH is in partnership with PathfinderHealth ACO to support independent
providers to increase access to their practices in the FMC and VVMC
markets
Insurance/Payor registration support for FMC and VVMC patients
FMC and VVMC provide medical direction and support for Community Integrated
Paramedicine
FMC and VVMC provide remote patient monitoring for patients
Mental Health & Mental Disorders
Many mental health issues take longer than 3 years to change on a population basis. Therefore
this is still a priority for the 2019 CHNA.
Suicides
Violent Deaths (Including Firearm-Related Deaths, Homicide & Suicide)
Lack of access to Behavioral Health care
Resources available for Mental Health & Mental Disorders
Alcoholics Anonymous
Back2Basics
Catholic Social Services
Child Family Services
Community Mental Health First Aid
Cottonwood County Drug Task Force
Flagstaff Medical Center – Behavior Health Services
Health Choice Integrated Care
Independent Providers
MATFORCE
National Alliance on Mental Illness
Native Americans for Community Action
13
North Country Healthcare Behavioral Health
Northern Arizona Regional Behavioral Health Authority
Northern Arizona University Counseling Services
Northern Arizona University Health and Psychology Center
Southwest Behavioral Health
Southwest Behavioral Health Services
Spectrum Healthcare
The Guidance Center
Verde Valley Guidance Clinic
Verde Valley Medical Center
Actions/Changes for Mental Health since 2016 CHNA
VVMC partners with Spectrum Health for a community focused approach to
patients arriving in the ED with mental health needs
FMC and VVMC are integrating Behavioral Health into Primary Care
Mental Health Matters collaboration in Flagstaff (FMC)
Coconino Justice Coalition (CJCC): legal issues with mentally ill (FMC)
AA Group meetings on BHU (FMC)
Crisis calls from community: intake / referrals (FMC/VVMC)
For Flagstaff Police Department (FMC)
o De-escalation skill training
o CIT: crisis intervention training
NACA: Suicide Prevention Grant collaboration (FMC)
Health fairs (FMC and VVMC)
Screenings (FMC and VVMC primary care clinics)
o Depression
o Substance abuse
Internal / External to NAH debriefing crisis intervention (FMC/VVMC)
DUI/Drug Court treatment programs (FMC)
Mental Health / Veteran Court hearings (FMC)
Title 36 (ED intake) – short term crisis (FMC/VVMC)
Trauma START: screenings and brief intervention / assessment (FMC)
o Referrals at discharge for patients with alcohol and drug use issues
Talks and presentations for community groups (FMC)
RN and SW students rotate through department (FMC)
CPI training (de-escalation) for sitters and ED staff (FMC/VVMC)
Mental health and substance abuse information for new grads (FMC/VVMC)
Provide meeting site for monthly National Association of Substance Abuse
Counselors (NASAC) meetings (FMC)
FMC/VVMC offer Mental Health First Aid training to employees and community
members

14
FMC is a supporting member of “Stronger as One” collaboration – which is an
outcome of the 2017 CHNA.
Chronic Disease
Chronic disease are, by nature, health issues that take longer than 3 years to change on a
population basis. Therefore this is still a priority for the 2019 CHNA.
Cancer
Cardiovascular Disease
Cirrhosis/Liver Disease
Diabetes
Obesity
Osteoporosis/Arthritis
Respiratory Health
Resources available for Chronic Disease
Arizona Health Care Cost Containment System (AHCCCS)
Bountiful Baskets
Camp Verde Unified School District
Coconino County Health & Human Services
Community Health Center of Yavapai (FQHC)
Cornucopia Food Pantry
Cottonwood – Oak Creek School District
Fit Kids of Arizona
Flagstaff Community Supported Agriculture Project
Flagstaff Medical Center
Flagstaff Shelter Services
Flagstaff Unified School District
Guardian Medical Transport
Highlands Fire District
Hospice Comassus
Independent Providers
Local Farmer’s Markets
Native Americans for Community Action
NorthCountry Health Care (FQHC)
Northern Arizona Healthcare Medical Group
Northern Arizona University Health Services
Northland Hospice
Poore Medical Clinic
Sacred Peaks Health Center
Sedona – Oak Creek Unified School District
Sedona Fire Department

15
Spectrum Healthcare
St. Mary’s Food Bank
Verde Valley Ambulance
Verde Valley Caregivers
Verde Valley Medical Center
Yavapai County Department of Health Services
YMCA
Actions/Changes for Chronic Disease since 2016 CHNA
Food is Medicine for Diabetes community education classes at FMC and VVMC
Healthy Basics Eating class at FMC and VVMC
Chef Cooking demo’s at FMC
FMC refers patients to the Cancer Support Community programs
Freedom from Smoking program- offered at VVMC- open to the community
Support groups for chronic disease at VVMC and FMC
Comprehensive Care Management at VVMC and FMC
PathfinderHealth ACO Care Process Models at VVMC and FMC
Community screenings for CVD and Diabetes in the VVMC and FMC communities
FMC and VVMC offer Diabetes Education and support
VVMC offers Cardiac Rehab and Pulmonary Wellness
FMC and VVMC are developing plans for sustainable growth to expand chronic
care service lines to the community
Partnering with Indian Health to support cancer care on reservations
Population Demographics
Population, Gender, and Race*
Coconino County (CC)- As of July 1, 2018 estimates, the total population in Coconino County
was 142,854. The population is 50.6% female and 49.4% male. The population was found to be
54.0% White (Not Hispanic or Latino), 27.6% American Indian or Alaskan Native, 14.3% Hispanic
or Latino, 1.5% Black or African American, and 2.1% Asian.
Mohave County (MC)- The total population in Mohave County was 209,550 in 2018. The county
is 49.4% female and 50.6% male. The majority of the county is White (Not Hispanic or Latino) at
76.9% while the largest minority group is Hispanic or Latino at 16.8% of the population. The
population is 3.0% American Indian or Alaskan Native, 1.3% Black or African American, and 1.2%
Asian.
Gila County (GC)- Gila County’s population was 53,889 in 2018. The population was found to be
50.6% female and 49.4% male. The majority of the county is White (Not Hispanic or Latino) at
62.0%. The county is 18.7% Hispanic or Latino, 17.8% American Indian or Alaskan Native, .8%
Black or African American, and .9% Asian.

16
Apache County (AC)- As of 2018, the total population in Apache County was 71,818. Apache
County has slightly more females with 50.8% of the population female and 49.2% male. The
majority of the population is American Indian or Alaskan Native at 74.9%. The population is
18.1% White (Not Hispanic or Latino) and 6.4% Hispanic or Latino.
Navajo County (NC)- The population of Navajo County was 110,445 in 2018. This County is
49.9% female and 50.1% male. The County’s population is 41.7% White (Not Hispanic or Latino),
45.6% Native American or Alaskan Native, 11.5% Hispanic, 1.0% Black and .7% Asian
Yavapai County (YC)- In 2018 there were 231,993 individuals living in Yavapai County. The
population is 51.2% female and 48.8% male. The majority of the population is White (Not
Hispanic or Latino) at 80.4%. The population is 14.7% Hispanic or Latino, 2.1% American Indian
or Alaskan Native, 1.2% Asian, and .9% Black or African American.
Age Distribution*
CC-In 2018, Persons under the age of 18 is 20.6%, nearing the state average of 22.9%. An
estimated 12.5% of the population is 65 years or older.
MC- It was found that 17.1% of Mohave County’s residents were under the age of 18 while
30.3% were over the age of 65.
GC- The population of Gila County had 20.1% of its residents aged 18 or under and 28.8% aged
65 or older in 2018.
AC-In Apache county, persons under the age of 18 is 27.2% and persons older that 65 was at
15.3% in 2018.
NC-It was found that 26.7% of Navajo County’s population is under the age of 18 and 18.1% is
over the age of 65.
YC- An estimated 31.6% of the population is 65 years or older, and 16.2% is under the age of 18.
Education*
CC- A percentage of 35.4% of persons 25 years or older, has earned a bachelor’s degree. These
rates are higher than the state average of 28.4%. Educational attainment in the County is higher
than the state’s average with respect to adults that have graduated from high school.
MC- In Mohave County only 12.3% of adults over the age of 25 have earned their bachelor’s
degree. This is less than half of the state average who have earned a bachelor’s degree at
28.4%. Persons aged 25 and older who are high school graduates was found to be 84.7%.
GC- The percentage of persons aged 25 or older that achieved a bachelor’s degree in Gila
County was 19.0%. Those with a high school diploma that are 25 or older make up 85.0% of the
population.

17
AC- The educational attainment in Apache County is well below the state average. In the county
only 11.5% of the population aged 25 or older has attained a bachelor’s degree and 78.6% of
the population aged 25 or older is a high school graduate.
NC- A percentage (82.6%) of the Navajo County population (age 25+) has graduated from high
school, lower than the state average of 86.5%. Those with a bachelor’s degree was also below
the state average at 15.5% of the population (age 25+).
YC- 25.0% of the population (25+) has earned a bachelor’s degree. Yavapai had a high school
graduation rate of 90.2% for those aged 25 or older.
Income and Poverty*
CC-The median household income in the Coconino County is $53,523, and 15.9% of the
population are below the poverty level. Coconino County has 47,588 households with an
average household size of 2.65.
MC- The median household income is $41,567 in Mohave County. The county has 16.8% of its
population below the poverty level. There are 83,902 households in the county with an average
of 2.39 persons per household.
GC- In Gila County the median household income is $41,179 and 20.4% of the population falls
under the poverty line. There are 21,585 households in the county with an average of 2.42
persons per household.
AC- The median income in Apache County was found to be $32,360 and 37.3% of the county
falls below the poverty level. The county has 19,530 households with an average of 3.59
persons per household.
NC-The estimated 2017 median household income in the County is $38,798. The median
household income in the State of Arizona is $53,510 and the United States $57,652. 28.5% of
the Navajo County population is below the poverty level as compared to 14.0% in the state of
Arizona and 11.8 % in the United States. Navajo County has 34,251 households with an average
of 3.07 persons per household.
YC- The median household income in Yavapai County is $48,259, and 13.2% of the Yavapai
County population is below the poverty level. There are 94,343 households in Yavapai County
with an average of 2.29 persons per household.
Social and Economic Factors
1. Percent Population without Adequate Social/Emotional Support
CC-9.6% grandchildren are raised by grandparents, with or without their parent present in the
household.
NC-With 36.7% of the population indicating that they don’t have adequate social/emotional
support there will be higher rates of negative behavioral health outcomes. This is evident later
in the report when suicide is highlighted. The suicide rates in Navajo County are more than

18
double the rate for Arizona as a whole and the United States. These numbers highlight the need
for an effective mental and behavioral health program in these areas.
YC- Yavapai County has 4.1 mentally unhealthy days per month which is significantly higher
than Health Indicator’s goal of less than 1.6 mentally unhealthy days. There is one mental
health provider per 3,257 people.
2. Percent Population under Age 18 in Poverty
CC-In Coconino County, about 26.45% of children live in poverty*, while 28.01 percent of
Flagstaff children in poverty.
MC- In Mohave County 30.1% of the population under the age of 18 lives in poverty.*
GC-In Gila County, about 32.95% of children live in poverty.*
AC-In Coconino County, about 40.67% of children live in poverty.*
NC-In Navajo County, about 36.59% of children live in poverty.*
YC-In Yavapai County, about 22.13% of children live in poverty.*119 children receive SNAP
(Food stamps) at an average of $114 per child.
3. Teen births**
CC- In Coconino County in 2018, the rate of teen pregnancy was 9.2% per 1,000 females age 19
years and younger, and the rate of births for females 19 or younger was 7.3%.
MC- In Mohave County, the rate of pregnancies to females 19 or younger was 11.2%, while the
rate of births to females 19 or younger was 11.1%.
GC- In Gila County the rate of pregnancies to females 19 or younger in 2018 was 21.6%, and the
rate of births to females 19 or younger was 19.5%.
AC- The rate of pregnancies to females 19 or younger in 2018 in Apache County was 13.0%.
The rate of births to females 19 or younger was 13.0%.
NC-In 2018, Navajo County females 19 or younger had a pregnancy rate of 16.2% and birth rate
of 15.7%.
YC- In 2018, Yavapai County reported a rate of pregnancy to females 19 and under as 13.3%.
The rate of births to females 19 or younger was 10.8%.
4. Uninsured Population*
CC- In Coconino County in 2018, 13.1% of the population under age 65 does not have health
insurance.
MC- 13.4% of individuals under 65 in Mohave County does not have health insurance.
GC- In Gila County 13.4% of the population under 65 does not have health insurance.
AC- In Apache County 19.2% of the population under 65 does not have health insurance.
NC- 15.1% of individuals under 65 living in Navajo County do not have health insurance.

19
YC-In Yavapai County 12.9% of the population under 65 does not have health insurance.
*All demographic information was taken from census.gov/quickfacts unless noted otherwise.
**All demographic information was taken from https://pub.azdhs.gov/health-
stats/report/avs/avs18/pdf/avs2018.pdf, Arizona Department of Health Services 2018, unless
noted otherwise.
Death, Disease, and Chronic Conditions
All data regarding the top 15 causes of mortality were gathered from the CDC Wonder
Database (wonder.cdc.gov).
647,457
599,108169,936
160,201
146,383
121,404
83,564
55,672
50,633
47,173
41,743
40,922
35,316 31,963
20,108
15 Leading Causes of Death in the United States, 2017
Diseases of heart
Cancer
Accidents
Chronic lower respiratory diseases
Stroke
Alzheimer's disease
Diabetes mellitus
Influenza and pneumonia
Nephritis, nephrotic syndrome and nephrosis
Intentional self-harm (suicide)
Chronic liver disease and cirrhosis
Septicemia
Essential hypertension and hypertensive renal
disease
Parkinson's disease
Pneumonitis due to solids and liquids

20
All data regarding the top 15 causes of mortality were gathered from the CDC Wonder
Database (wonder.cdc.gov).
12,398
12,008
4,184
3,802
3,058
2,681
2,054
1,327
1,137
1,019
876
754
540
468
441
15 Leading Causes of Death in Arizona, 2017
Diseases of heart
Cancer
Accidents
Chronic lower respiratory diseases
Alzheimer's disease
Stroke
Diabetes mellitus
Intentional self-harm (suicide)
Chronic liver disease cirrhosis
Essential hpertension and hypertensive renal
disease
Influenza and pneumonia
Parkinson's disease
Nephritis, nephrotic syndrome and nephrosis
Septicemia
Assault (homicide)

21
Northern Arizona Counties Compared to Peer Counties*
Mohave
Yavapai
Coconino
Gila
Navajo
Apache
Mortality
Alzheimer's Disease
Moderate
Moderate
Better
Worse
Better
Better
Cancer Deaths
Worse
Better
Better
Moderate
Better
Better
Chronic Kidney Disease
Moderate
Moderate
Moderate
Moderate
Better
Better
Chronic Lower Respiratory
Deaths
Worse
Moderate
Better
Worse
Better
Better
Coronary Heart Disease Deaths
Worse
Moderate
Moderate
Moderate
Better
Better
Diabetes Deaths
Worse
Better
Moderate
Worse
Moderate
Moderate
Female Life Expectancy
Worse
Moderate
Moderate
Worse
Better
Better
Male Life Expectancy
Worse
Moderate
Moderate
Worse
Moderate
Worse
Motor Vehicle Deaths
Worse
Worse
Worse
Worse
Worse
Worse
Stroke Deaths
Moderate
Moderate
Moderate
Moderate
Better
Better
Unintentional Injury (Including
Motor Vehicle)
Worse
Worse
Worse
Worse
Worse
Worse
Morbidity
Adult Diabetes
Moderate
Moderate
Moderate
Worse
Moderate
Moderate
Adult Obesity
Worse
Moderate
Better
Worse
Better
Better
Adult Overall Health Status
Worse
Worse
Moderate
Worse
Better
Better
Alzheimer's Disease
Better
Better
Better
Better
Better
Better
All Cancer
Better
Better
Better
Better
Better
Better
Gonorrhea
Better
Moderate
Worse
Worse
Worse
Moderate
HIV
Better
Moderate
Moderate
Moderate
Moderate
Moderate
Older Adult Asthma
Moderate
Worse
Moderate
Worse
Worse
Worse
Older Adult Depression
Moderate
Better
Better
Better
Better
Better
Preterm Births
Moderate
Worse
Worse
Worse
Moderate
Better
Syphilis
Better
Better
Moderate
Better
Moderate
Moderate
Health Care Access and
Quality
Cost Barrier to Care
Moderate
Worse
Moderate
Moderate
Better
Better
Older Adult Preventable
Hospitalizations
Worse
Better
Moderate
Moderate
Better
Moderate
Primary Care Provider Access
Moderate
Worse
Moderate
Moderate
Moderate
Better
Uninsured
Moderate
Moderate
Worse
Moderate
Moderate
Moderate
Health Behaviors
Adult Binge Drinking
Moderate
Moderate
Better
Moderate
Moderate
Moderate
Adult Female Routine Pap
Tests
Worse
Moderate
Moderate
Worse
Worse
Moderate
Adult Physical Inactivity
Worse
Moderate
Better
Worse
Better
Better
Adult Smoking
Worse
Worse
Better
Moderate
Better
Better

22
Teen Births
Worse
Worse
Moderate
Worse
Moderate
Better
Social Factors
Children in Single-Parent
Households
Moderate
Moderate
Worse
Worse
Moderate
Moderate
High Housing Costs
Moderate
Moderate
Moderate
Moderate
Moderate
Better
Inadequate Social Support
Worse
Moderate
Worse
Worse
Moderate
Moderate
On Time High School
Graduation
Moderate
Moderate
Moderate
Moderate
Worse
Moderate
Poverty
Worse
Moderate
Worse
Worse
Worse
Moderate
Unemployment
Worse
Moderate
Moderate
Moderate
Worse
Worse
Violent Crime
Moderate
Moderate
Moderate
Worse
Moderate
Moderate
Physical Environment
Access to Parks
Moderate
Moderate
Moderate
Worse
Moderate
Moderate
Annual Average PM2.5
Concentration
Better
Better
Better
Better
Housing Stress
Moderate
Moderate
Worse
Worse
Worse
Worse
Limited Access to Healthy Food
Worse
Worse
Worse
Worse
Worse
Worse
Living Near Highways
Better
Better
Worse
Moderate
Moderate
*Peer Counties located across the United States that have similar demographics.
All information found on the US Department of Health and Human Service Centers for Disease Control
and Prevention website (wwwn.cdc.gov)

23
All information found at arizonahealthmatters.org unless noted otherwise.
*Mental Health was found at healthmatters.org.
**% Obese was found at stateofobesity.org.
Health Indicator Mohave Yavapai Coconino Gila Navajo Apache Arizona HP 20/20 Target
% (age 18-65) With Health Insurance 75 80.4 81 76.5 71.6 81.5 100
% (age <18) With Health Insurance 80.1 84.9 82.7 86.5 80.6 90 100
Cervical Cancer Incidence Rate 8.4 8.6 6.4 5.9 6.8 7.1
Colorectal Cancer (Age-Adjusted Death Rate) 47.2 36 26.4 31.7 28.8 23.4 35.4 39.9
Workers Commuting by Public Transportation 0.4 0.2 1.9 0.4 1.4 0.6 2 5.5
Coronary Heart Disease (Age-Adjusted Death Rate) 183.7 97.2 82.9 104.2 98 90.4 110 103.4
High Blood Pressure Prevalence 30.7 26.9
High Cholesterol Prevalence 39.7 13.5
% [Age 65+] Pneumonia Vaccine Ever 72 90
Tuberculosis Incidence per 100,000 1.5 0 4.4 0 2.8 8.3 2.8 1
Pedestirian Death Rate 2.3 1.4
Firearm-Related Deaths (Age-Adjusted Death Rate) 19.7 21.3 10 20.9 15.1 20.7 14.1 9.3
%Preterm Births 7.5 8.5 9.2 9.3 8.8 8 9 11.4
% Mothers who Received Early Prenatal Care 81.2 82 84.9 68.3 70.5 68.3 81.3 77.9
% of Low Birthweight Births 6.4 7.6 7.2 8.3 8.4 5.6 6.9 7.8
Infant Death Rate 3.4 4.4 6.2 11.3 4.5 10.5 5.3 6
% "Fair/Poor" Mental Health 4 3.6 4 4.1 4.6 5.3 3.6
Suicide (Age-Adjusted Death Rate) 29.5 30.3 17.7 33.7 23.2 38.1 17 10.2
Salmonella Infection Incidence Rate 18.2 17.8 14 11.2 34 34.6 15.3 11.4
% Obese 27% 26% 24% 27% 31% 32% 28.90%
% Adults 18+ Obese 26.8 30.5
Healthy People 2020 Comparisons

24
Arizona Health Status and Vital Statistics
Cardiovascular Disease*
Cardiovascular disease and heart disease are often used interchangeably. They are similar;
however, heart disease is related to the disease of the heart, and cardiovascular disease refers
to the function of the blood vessels. Cardiovascular Disease and Stroke were the first and sixth
leading causes of death in Arizona. The Arizona Cardiovascular Disease Prevention Plan was put
in place to hold public health professionals, policy members, and other community members
accountable for the education and prevention of Cardiovascular Disease.
Cardiovascular & Heart Disease
In the NAH region in 2017, Mohave County reported having the highest rate of
cardiovascular disease mortality with 503.4 per 100,000 individuals, and the lowest rate
was at 151.3 per 100,000 individuals in Coconino County.
Cardiovascular disease mortality rates include heart disease.
0
100
200
300
400
500
600
Apache Coconino Gila Mohave Navajo Yavapai Arizona
Cardiovascular Disease Mortality
Cardiovascular Disease Mortality Rates per 100,000

25
Stroke
In the NAH region in 2017, Yavapai County recorded the highest rate of stroke mortality
at 68.3 per 100,00 individuals, and Coconino recorded the lowest rate of stroke
mortality at 25.
0
50
100
150
200
250
300
350
400
450
Apache Coconino Gila Mohave Navajo Yavapai Arizona
Heart Disease Mortality
Heart Disease Mortality Rates per 100,000
0
10
20
30
40
50
60
70
80
Apache Coconino Gila Mohave Navajo Yavapai Arizona
Stroke Mortality
Stroke Mortality Rates per 100,000

26
Hypertension
In the NAH region in 2017, Gila County recorded the highest rate of hypertension
mortality at 20 per 100,00 individuals, and Coconino recorded the lowest rate of
hypertension mortality at 6.2.
*All demographic information was taken from https://pub.azdhs.gov/health-
stats/report/ahs/ahs2017/pdf/5e13.pdf, Arizona Department of Health Services 2017, unless
noted otherwise.
Cancer
All Cancer
In the NAH region in 2017, Mohave County experienced the highest overall cancer
mortality rate at 342.7 per 100,000. Coconino County had the lowest rate at 106.9 per
100,000.*
In Arizona from 2003 through 2012, males experienced higher cancer mortality rates
than females, and white (non-hispanic) individuals experienced higher cancer mortality
rates than other races.**
0
5
10
15
20
25
Apache Coconino Gila Mohave Navajo Yavapai Arizona
Hypertension Mortality
Hypertension Mortality Rates per 100,000

27
Cancer Mortality Rates per 100,000*
Arizona: Age-Adjusted Incidence Rates of All Cancer per Ethnicity and Sex by
Diagnosis Year**
0
50
100
150
200
250
300
350
400
Apache Coconino Gila Mohave Navajo Yavapai Arizona
All Cancer Lung Cancer Colorectal Cancer
Breast Cancer Prostate Cancer Malignant Melanoma of Skin
Cervical Cancer

28
Breast Cancer
Arizona: Early/Late Summary Stage Race/Ethnicity by Diagnosis Year: Female
Breast Cancer, 2003-2012**
*All demographic information was taken from https://pub.azdhs.gov/health-
stats/report/ahs/ahs2017/pdf/5e13.pdf, Arizona Department of Health Services 2017, unless
noted otherwise.
**All demographic information was taken from
http://azdhs.gov/documents/preparedness/public-health-statistics/cancer-
registry/reports/arizona-cancer-registry-data-2003-2012.pdf unless noted otherwise.

29
Respiratory Diseases*
There are respiratory diseases present in Northern Arizona, and in some counties they reach
the highest rate of mortality in the state. Chronic Lower Respiratory Diseases (CLRD) include
several diseases that affect the lungs. Chronic Pulmonary Lung Disease, Emphysema, and
Chronic Bronchitis are diseases that have serious consequences if not watched and treated
properly. For each of these three diseases, the lungs are somehow affected, either by damaged
alveoli or swollen bronchi. Breathing is not as easy as it may be for someone without a
respiratory disease. It is important to visit the doctor for screenings or tests if you do not feel
well, because these diseases can be life threatening. Smoking cigarettes increases your
likelihood of getting a CLRD.
Pneumonia is contracted typically after the body has been invaded by a bacteria or virus. If it is
caught early, then the recovery time is faster; however, if it is not caught early, it can be life
threatening when the alveoli fill with fluid.
Chronic Lower Respiratory Diseases
Mohave County recorded the highest rate of CLRD mortality in the NAH region at 133.9
per 100,000 individuals. Gila was the next highest at 127.4 per 100,000, and Yavapai was
third highest at 123.8.
The other three counties in the NAH region had CLRD mortality rates less than half that
of Yavapai.
0
20
40
60
80
100
120
140
160
Apache Coconino Gila Mohave Navajo Yavapai Arizona
CLRD Mortality Rates per 100,000
CLRD Mortality Rates per 100,000

30
Pneumonia and Influenza
In the NAH region in 2017, Mohave County showed the highest pneumonia and
influenza mortality rate at 25.3 per 100,000, and Coconino showed the lowest at 9 per
100,000.
*All demographic information was taken from https://pub.azdhs.gov/health-
stats/report/ahs/ahs2017/pdf/5e13.pdf, Arizona Department of Health Services 2017, unless
noted otherwise.
Injury and Violence
The Arizona State Trauma Advisory Board reported in 2018 that Northern Arizona has a greater
rate of traumatic injury than any other region in the state (see graphs on next page).*
0
5
10
15
20
25
30
Apache Coconino Gila Mohave Navajo Yavapai Arizona
Pneumonia & Influenza Mortality
Pneumonia & Influenza Mortality Rates per 100,000

31

32
Accidents and Unintentional Injury**
Accidents and unintentional injuries include such incidents as accidental poisoning, falls,
motor vehicle accidents, and accidental drowning.
All counties in the NAH region experienced higher accident and unintentional injury
mortality rates than the overall rate for Arizona in 2017.
Apache County experienced the highest overall rate at 140.3 per 100,000 individuals,
while Mohave experienced the lowest at 62.9.
Yavapai County had the highest mortality rate for falls at 45.3 per 100,000, while
Arizona’s mortality rate for falls was 15.4.
Gila County had the highest mortality rate for motor vehicle accidents at 70 per
100,000, which is significantly higher than Arizona’s rate of 14.1.
Assault (Homicide)**
Apache County had the highest assault mortality rate in the NAH region in 2017, with
15.1 per 100,000 individuals, which is more than double that of Arizona’s rate. Mohave
County had the lowest rate at 1.9.
0
20
40
60
80
100
120
140
160
Apache Coconino Gila Mohave Navajo Yavapai Arizona
Accident & Unintentional Injury Mortality Rates per
100,000
All Accidents Poisoning Accidents Falls Motor Vehicle Accidents Accidental Drowning
33
Injury by Firearms **
All counties in the NAH region had higher mortality rates for injury by firearms than the
rate for Arizona in 2017.
Gila County had the highest rate at 29.1 per 100,000 individuals. Coconino County had
the lowest rate at 16.7, which was only slightly above the Arizona rate of 16.1.
0
2
4
6
8
10
12
14
16
Apache Coconino Gila Mohave Navajo Yavapai Arizona
Assault Mortality
Assault Mortality Rates per 100,000
0
5
10
15
20
25
30
35
Apache Coconino Gila Mohave Navajo Yavapai Arizona
Injury by Firearms Mortality
Injury by Firearms Mortality Rates per 100,000

34
*All trauma-related, regional demographic information was taken from
https://www.azdhs.gov/documents/preparedness/emergency-medical-services-trauma-
system/reports/2018-stab-annual-report.pdf .
**All cause of death demographic information was taken from https://pub.azdhs.gov/health-
stats/report/ahs/ahs2017/pdf/5e13.pdf, Arizona Department of Health Services 2017, unless
noted otherwise.
Substance Abuse*
Drug-Induced Deaths
Drug-induced deaths include those involving prescription opioids.
The highest rate of drug-induced mortality in the state in 2017 was Gila County at 43.7
per 100,000 individuals.
Apache County had the lowest rate of drug-induced deaths in the NAH region in 2017 at
8.3 per 100,000.
The other Northern Arizona counties ranged from 18 to 26.7 per 100,000.
0
5
10
15
20
25
30
35
40
45
50
Apache Coconino Gila Mohave Navajo Yavapai Arizona
Drug-Induced Mortality Rates per 100,000
Drug-Induced Deaths Opioid-Induced Deaths
35
Alcohol-Induced Deaths
All counties in the NAH region experienced higher alcohol-induced mortality rates than
Arizona in 2017.
The top 2 highest rates of alcohol-induced mortality in the state in 2017 were Apache
County and Navajo County, with 63.3 and 53.9 deaths per 100,000 individuals
respectively. These are more than triple the rate of Arizona.
*All cause of death demographic information was taken from https://pub.azdhs.gov/health-
stats/report/ahs/ahs2017/pdf/5e13.pdf, Arizona Department of Health Services 2017, unless
noted otherwise.
Liver Disease*
Chronic Liver Disease and Cirrhosis
In 2017 all counties in the NAH region had higher mortality rates from chronic liver
disease and cirrhosis than Arizona’s rate. These rates, along with the alcohol-induced
mortality rates for the same counties, suggest high rates of alcohol consumption in the
region.
Gila County had the highest rate of chronic liver disease and cirrhosis mortality, with
41.9 deaths per 100,000 individuals. Coconino had the lowest rate at 20.8, while
Arizona’s rate was 16.1.
0
10
20
30
40
50
60
70
Apache Coconino Gila Mohave Navajo Yavapai Arizona
Alcohol-Induced Mortality
Alcohol-Induced Mortality Rates per 100,000

36
*All cause of death demographic information was taken from https://pub.azdhs.gov/health-
stats/report/ahs/ahs2017/pdf/5e13.pdf, Arizona Department of Health Services 2017, unless
noted otherwise.
Intentional Self-Harm
In 2017 suicide was the 8
th
leading cause of death in Arizona, while it was the 10
th
leading cause
of death in the United States that same year.* According a 2018 report from Arizona
Department of Health Services, “In Arizona…adjusted suicide rates have been rising, from 15.4
to 18.0 between 2006 and 2017.”** Additionally, “Trends in suicide rates from 2006 to 2017
demonstrate excessive mortality among White males in comparison to all other groups for
most of the period under study.”** As of 2017, Arizona has included suicide prevention as a
priority in the state’s health improvement plan.***
Suicide*
In 2017 all counties in the NAH region had higher mortality rates from suicide than
Arizona.
Navajo County had the highest rate of suicide mortality, with 39.5 deaths per 100,000
individuals, which is more than double the rate of Arizona.
Coconino had the lowest rate at 26.4, while Arizona’s rate was 18.7.
0
5
10
15
20
25
30
35
40
45
Apache Coconino Gila Mohave Navajo Yavapai Arizona
Chronic Liver Disease and Cirrhosis Mortality
Chronic Liver Disease and Cirrhosis Mortality Rates per 100,000

37
*All cause of death demographic information was taken from https://pub.azdhs.gov/health-
stats/report/ahs/ahs2017/pdf/5e13.pdf, Arizona Department of Health Services 2017, unless
noted otherwise.
**Information taken from https://pub.azdhs.gov/health-stats/report/suicide/2018/suicide-report-12-
2018.pdf, Arizona Department of Health Services 2018
***Information taken from https://azdhs.gov/documents/operations/managing-
excellence/suicide.pdf
Diabetes
Diabetes is a condition in which the body does not properly use its insulin. This can mean that
there is not enough insulin or it is not being used effectively. If not watched over time, diabetes
can lead to major health issues such as heart disease, blindness, kidney failure, and more. There
are two different types of diabetes: the first is insulin-dependent diabetes mellitus (IDDM), and
the second is non-insulin-dependent diabetes mellitus (NIDDM) or adult-onset diabetes. For
either type of diabetes, it is extremely important that a doctor monitor the patient's condition.
Diabetes Deaths*
All but one county in the NAH Region had higher diabetes mortality rates than Arizona’s
rate, which was 29.2 per 100,000 individuals.
Coconino County’s 18 deaths per 100,000 was the lowest rate in the region.
Apache had the highest rate in the region with 57.8 diabetes deaths per 100,000
individuals.
0
5
10
15
20
25
30
35
40
45
Apache Coconino Gila Mohave Navajo Yavapai Arizona
Suicide Mortality
Suicide Mortality Rate per 100,000

38
*All demographic information was taken from https://pub.azdhs.gov/health-
stats/report/ahs/ahs2017/pdf/5e13.pdf, Arizona Department of Health Services 2017
Other Diseases – Non-Infectious
Alzheimer’s Disease is the most common type of Dementia. It is not a normal part of aging, and
it can even affect people even at 40-50 years old. There is no cure for Alzheimer’s, but there are
treatments that can slow the progressive process of the disease. The cause for the disease is
still unknown, but the person can begin to change even decades before they discover the
disease. Symptoms of Alzheimer’s Disease include loss of memory, thinking skills, and ability to
carry out easy tasks. Researchers believe it is because of protein deposits in the brain near the
hippocampus, which controls memory.
Parkinson’s Disease is a central nervous system disorder that causes loss of muscle control. It
can impair movement, speech, cognition, bodily functions, and more. There is no cure.
Alzheimer’s Disease*
The highest mortality rate in the NAH region in 2017 for Alzheimer’s Disease was 97.2
per 100,000 individuals in Yavapai County.
The lowest rate in the region was 16 per 100,000 in Coconino.
0
10
20
30
40
50
60
70
Apache Coconino Gila Mohave Navajo Yavapai Arizona
Diabetes Mortality
Diabetes Mortality Rates per 100,000

39
Parkinson’s Disease*
The highest mortality rate in the NAH region in 2017 for Parkinson’s Disease was 18.6
per 100,000 individuals in Yavapai County.
The lowest rate in the region was 7.3 per 100,000 in Coconino.
*All demographic information was taken from https://pub.azdhs.gov/health-
stats/report/ahs/ahs2017/pdf/5e13.pdf, Arizona Department of Health Services 2017
0
20
40
60
80
100
120
Apache Coconino Gila Mohave Navajo Yavapai Arizona
Alzheimer's Disease Mortality
Alzheimer's Disease Mortality Rates per 100,00
0
2
4
6
8
10
12
14
16
18
20
Apache Coconino Gila Mohave Navajo Yavapai Arizona
Parkinson's Disease Mortality Rates per 100,000
Parkinson's Disease Mortality Rates per 100,000

40
Infectious Disease
Vaccine Preventable Conditions
Mohave County had the highest incidence rate for vaccine preventable diseases in 2013
out of all 15 Arizona counties.
The primary care areas of Flagstaff, Prescott Valley, and Cottonwood/Sedona all had an
incidence rate that was less than 20 per 100,000 individuals. This does not show a
significant differences to the other areas in the state.
By Counties
Lowest – Santa Cruz Highest – Mohave
By Primary Care Area
Lowest – Multiple with Zero Highest – Colorado City
363.7
24.9
18.6
3.8
21.4
20.4
2.1
363.7
0
50
100
150
200
250
300
350
400
Mohave Yavapai Coconino Gila Navajo Apache Lowest Highest
Per 100,000 Individuals
Vaccine Preventable Diseases

41
Influenza and Pneumonia Vaccination
County # Enrolled 4+DTaP 3+Polio 1+MMR 3+ Hib 2 Hep A 3+ Hep B
+1 Varicella or Hist
Personal Exempt Medical Exempt
Apache 250 94.80% 96.40% 96.40% 92.80% 85.60% 96.00% 96.80% 4.40% 0.80%
Coconino 1514 94.80% 94.80% 95.60% 93.00% 68.70% 94.50% 95.10% 4.30% 0.50%
Gila 443 94.60% 94.60% 95.30% 91.90% 71.10% 95.00% 94.40% 5.00% 1.10%
Mohave 2084 91.40% 94.20% 94.40% 92.50% 60.90% 93.00% 93.80% 4.70% 0.70%
Navajo 1398 94.60% 96.60% 97.10% 93.60% 74.70% 96.80% 96.80% 3.00% 0.20%
Yavapai 2052 87.60% 89.90% 89.90% 88.80% 52.70% 88.40% 88.50% 10.90% 0.40%
Total AZ 84,778 93.20% 95.40% 95.80% 95.70% 96.60% 4.60% 0.30%
http://azdhs.gov/documents/preparedness/epidemiology-disease-control/immunization/statistics-reports/childcare-coverage-2014-
2015.pdf
AZ Childcare Immunization Coverage Levels 2014-15 School Year, 18-60 months of age
County # Enrolled 4+DTaP 3+Polio 2+MMR 3+ Hep B
+1 Varicella
Personal Exempt Medical Exempt
Apache 997 96.90% 95.70% 96.30% 97.60% 96.80% 2.20% 0.60%
Coconino 1414 93.90% 94.30% 94.10% 95.70% 96.30% 5.10% 0.70%
Gila 694 94.70% 94.80% 94.70% 96.30% 96.80% 4.20% 0.10%
Mohave 1817 92.10% 92.10% 91.50% 94.30% 95.40% 5.10% 0.10%
Navajo 1239 93.90% 93.90% 93.60% 96.20% 96.30% 4.50% 1.20%
Yavapai 1936 88.40% 89.60% 87.70% 91.10% 92.30% 10.00% 0.70%
Total AZ 84,651 94.30% 94.70% 94.20% 95.70% 96.60% 4.60% 0.30%
AZ Kindergarton Immunization Coverage Levels 2014-15 School Year
http://azdhs.gov/documents/preparedness/epidemiology-disease-control/immunization/statistics-
reports/kindergarten-coverage-2014-2015.pdf
County # Enrolled 1Tdap 1 MV/MCV 2+MMR 3+ Hep B
+1 Varicella
Personal Exempt Medical Exempt
Apache 919 84.40% 83.60% 98.80% 99.00% 98.30% 1.00% 1.00%
Coconino 1311 91.40% 89.50% 97.00% 96.90% 97.10% 4.10% 0.10%
Gila 639 88.40% 87.90% 98.30% 98.60% 98.90% 3.60% 0.00%
Mohave 1954 84.00% 84.30% 94.80% 95.20% 95.10% 5.80% 0.20%
Navajo 1349 86.20% 86.10% 96.30% 96.60% 96.90% 6.00% 1.20%
Yavapai 1998 81.60% 81.70% 94.40% 95.30% 95.20% 12.40% 0.70%
Total AZ 86,000 90.00% 89.80% 97.40% 97.50% 97.90% 4.70% 0.40%
AZ 6th Grade Immunization Coverage Levels 2014-15 School Year
http://azdhs.gov/documents/preparedness/epidemiology-disease-control/immunization/statistics-
reports/sixth-grade-coverage-2014-2015.pdf

42
Tuberculosis
In 2013 the counties of Yavapai, Coconino, Gila, and Apache did not have any cases of
Tuberculosis.
Navajo county reported the highest incidence rate for Tuberculosis in the state of
Arizona.
The primary care areas of Flagstaff, Prescott Valley, and Cottonwood/Sedona did not
report any cases of Tuberculosis in 2013.
By Counties
Lowest – Multiple with Zero Highest - Navajo
By Primary Care Areas
Lowest – Multiple with Zero Highest - Florence

43
Sexually Transmitted Diseases
CC- Chlamydia rates in Coconino County continue to be significantly above the national
average, according to a monthly report released by the county public health services district. In
2013, the rate of chlamydia cases in the county was 30 percent higher than the national
average, with a rate of 593 cases per 100,000 people.
NC- In Navajo County during 2010, the rates of genital herpes, gonorrhea, and syphilis were
21.4, 33.5, and 1.9 respectively. This is compared to the state of Arizona, which had a rate of
29.0 for genital herpes, 50.8 for gonorrhea, and 3.6 for syphilis.18 The rates for these three
STDs were lower in Navajo County than the state-wide statistics. The rate of chlamydia,
however, was much higher in Navajo County than in Arizona. In 2010, the rate of chlamydia
was 559.3 in Navajo County and 420.2 in Arizona.
YC- Yavapai has the lowest Chlamydia prevalence rates in Arizona, at 151.8 cases per 100,000
people. This is much lower than the national average of 401.3 cases per 100,000.
Gonorrhea
In 2013 the annual average incidence rate of gonorrhea for Coconino County was 104.1
per 100,000 individuals.
Navajo County held the highest incidence rate for gonorrhea in 2013 at 167.8.
The primary care area of flagstaff reported 63.7 per 100,000 individual cases of
gonorrhea in 2013.
By Counties
Lowest – Yavapai Highest - Navajo

44
By Primary Care Areas
Lowest – Multiple with Zero Highest – White Mountain Apache Tribe
Syphilis
Coconino County was found to have an incidence rate for primary and secondary
syphilis of .7 per 100,000 individuals in 2013.
Apache County held the highest incidence rate with 5.5 per 100,000 individuals that
were reported to have primary or secondary syphilis.
The primary care areas of Flagstaff, Prescott Valley, and Cottonwood/Sedona did not
report any new cases of syphilis in 2013.
By Counties
Lowest – Multiple with Zero Highest - Apache

45
By Primary Care Areas
Lowest – Multiple with Zero Highest – Salt River Pima-Maricopa Community
Chlamydia
Northern Arizona reported some of the highest incidence rates for chlamydia with
Coconino, Apache, and Navajo coming in at 13
th
, 14
th
, and 15
th
respectively out of the 15
counties of Arizona.
Coconino County had an incidence rate of 663.7 per 100,000 individuals in 2013.
Navajo County reported the highest incidence rate of chlamydia in Arizona with 856.6
per 100,000 individuals infected.
The primary care area of Flagstaff had an incidence rate of 567.7 per 100,000 individuals
that were infected with chlamydia in 2013.
By Counties
Lowest – Yavapai Highest - Navajo

46
By Primary Care Areas
Lowest – Sun City West Highest – White Mountain Apache Tribe
Births*
Prenatal Care Visits
In the NAH region in 2018, Gila County had the highest rate of pregnant women who
had less than 5 prenatal visits, with 16 per 100 live births. Yavapai had the lowest rate
at 3.95 per 100 live births.
0
2
4
6
8
10
12
14
16
18
Apache Coconino Gila Mohave Navajo Yavapai Arizona
Less than 5 Prenatal Visits - Rate per 100 Live Births
Less Than 5 Prenatal Visits - Rate per 100 Live Births

47
Low Birthweight (LBW)
In the NAH region in 2018, Gila County had the highest rate of low weight births at 11.3
per 100 live births.
Mohave County had the lowest rate in the region, with 6.9 low weight births per 100.
Infant Mortality
Apache and Gila Counties had less than 6 infant mortalities per 1,000 live births in 2018,
which equates to rate of approximately 0.
Navajo County had the highest rate of infant mortality in the NAH region in 2018 with
13.8 per 1,000 live births.
0
2
4
6
8
10
12
Apache Coconino Gila Mohave Navajo Yavapai Arizona
LBW Rate
LBW Rate per 100 Births

48
Family Planning
Birth to Unwed Mothers
In the NAH region, Apache County held the highest rate of a birth to unwed mothers in
2018 with a rate of 70.7 per 100 births.
Yavapai County had the lowest rate in the region with a rate of 43 per 10 live births,
which is nearing the Arizona rate of 44.6.
0
2
4
6
8
10
12
14
16
Apache Coconino Gila Mohave Navajo Yavapai Arizona
Infant Mortality
Infant Mortality Rate per 1,000 Live Births
0
10
20
30
40
50
60
70
80
Apache Coconino Gila Mohave Navajo Yavapai Arizona
Rate of Births to Unwed Mothers per 100 Births
Rate of Births to Unwed Mothers per 100 Births

49
Birth to Teen Mothers (Females 19 or Younger)
In the NAH region in 2018, Gila County reported the highest rate of births to teen
mothers with a rate of 19.5 births per 1,000 females age 19 or younger. This was not
quite double the rate of Arizona, which was 10.1 per 1,000 teen females.
Coconino County reported the lowest rate in the region with 7.3 births per 1,000
females age 19 or younger.
*All data taken from https://pub.azdhs.gov/health-stats/report/avs/avs18/pdf/avs2018.pdf
unless otherwise noted
0
5
10
15
20
25
Apache Coconino Gila Mohave Navajo Yavapai Arizona
Rate of Births per 1,000 Females 19 or Younger
Rate of Births per 1,000 Females 19 or Younger
50
Modifiable Health Risks
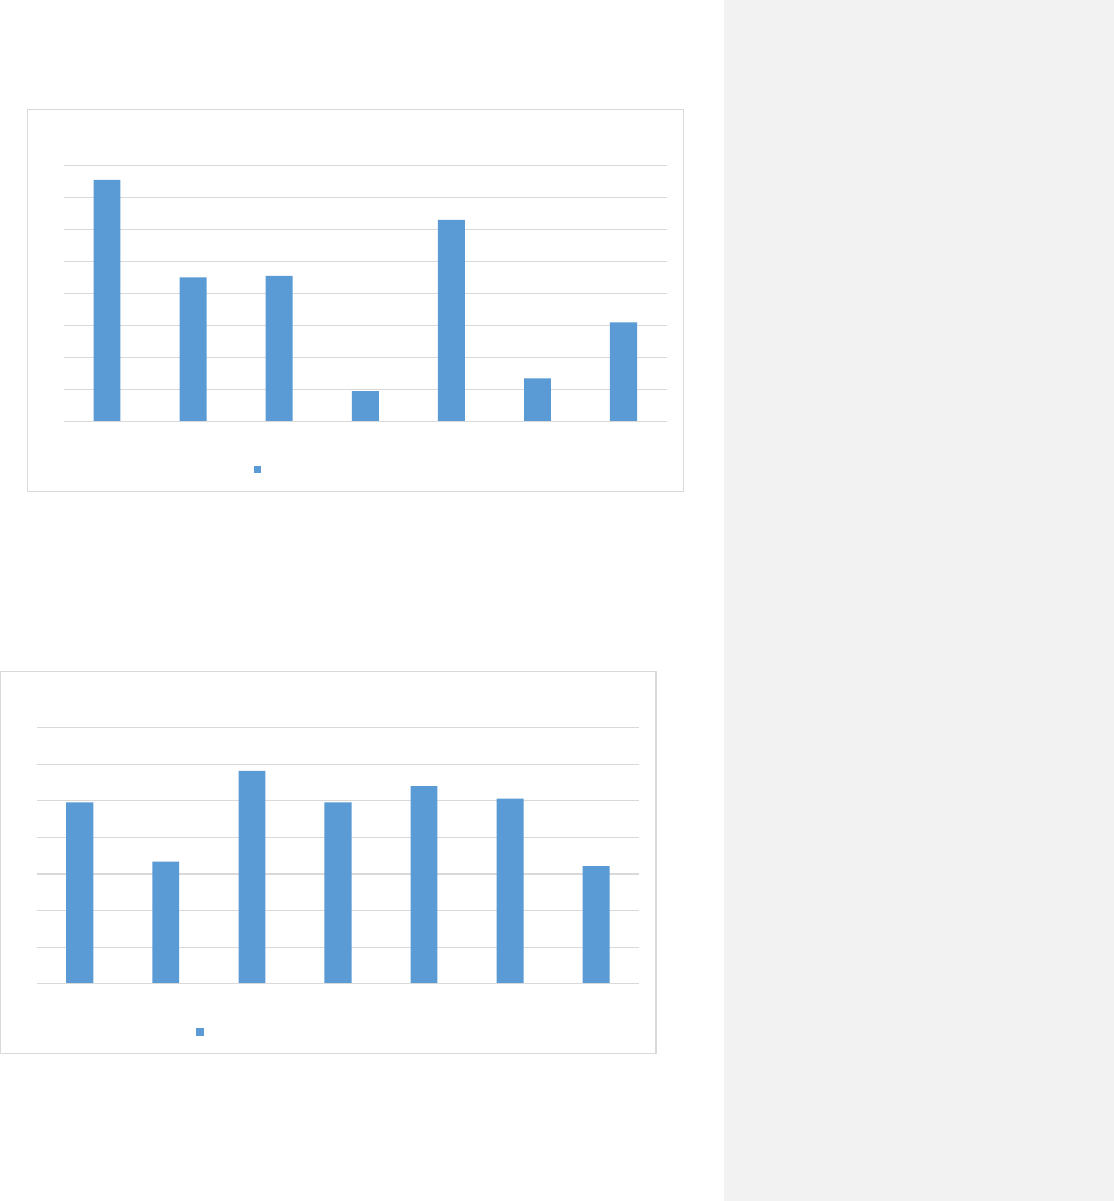
Leisure-Time Physical Activity
Lowest – Coconino Highest – Mohave
Source – countyhealthrankings.org 2011
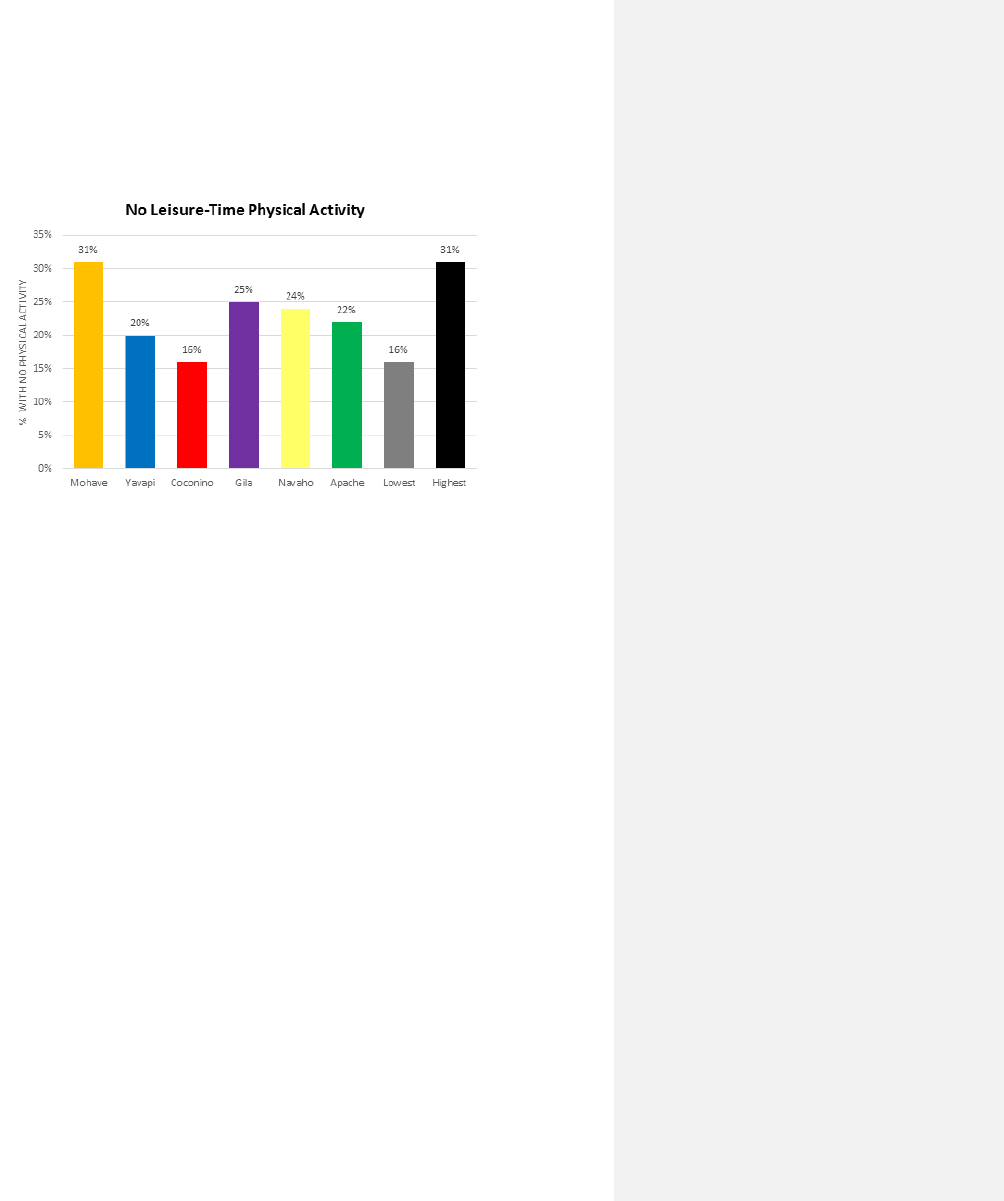
Obesity and Overweight Status
According to the 2011 Behavioral Risk Factor Surveillance Survey (BRFSS), as reported
through Arizona Health Matters, 25 percent of adults in Coconino County and 32
percent of adults in Navajo County are obese. The state average is 24.7 percent and the
Healthy People 2020 national health target is 30.6 percent.
Obesity isn’t just a health issue relegated to adults; childhood obesity is also a significant
health issue, with 8.6 percent of Coconino County and 9.2 percent of Navajo children
classified as obese. Arizona Health Matters reported that results from a recent study
indicate that nearly 80 percent of children who were overweight as teenagers were
obese adults at age 25.
In Yavapai County, the percent of adults that report a BMI ≥ 30 is 20%.

51
Lowest – Santa Cruz Highest – Greenlee
Source – countyhealthrankings.org 2011
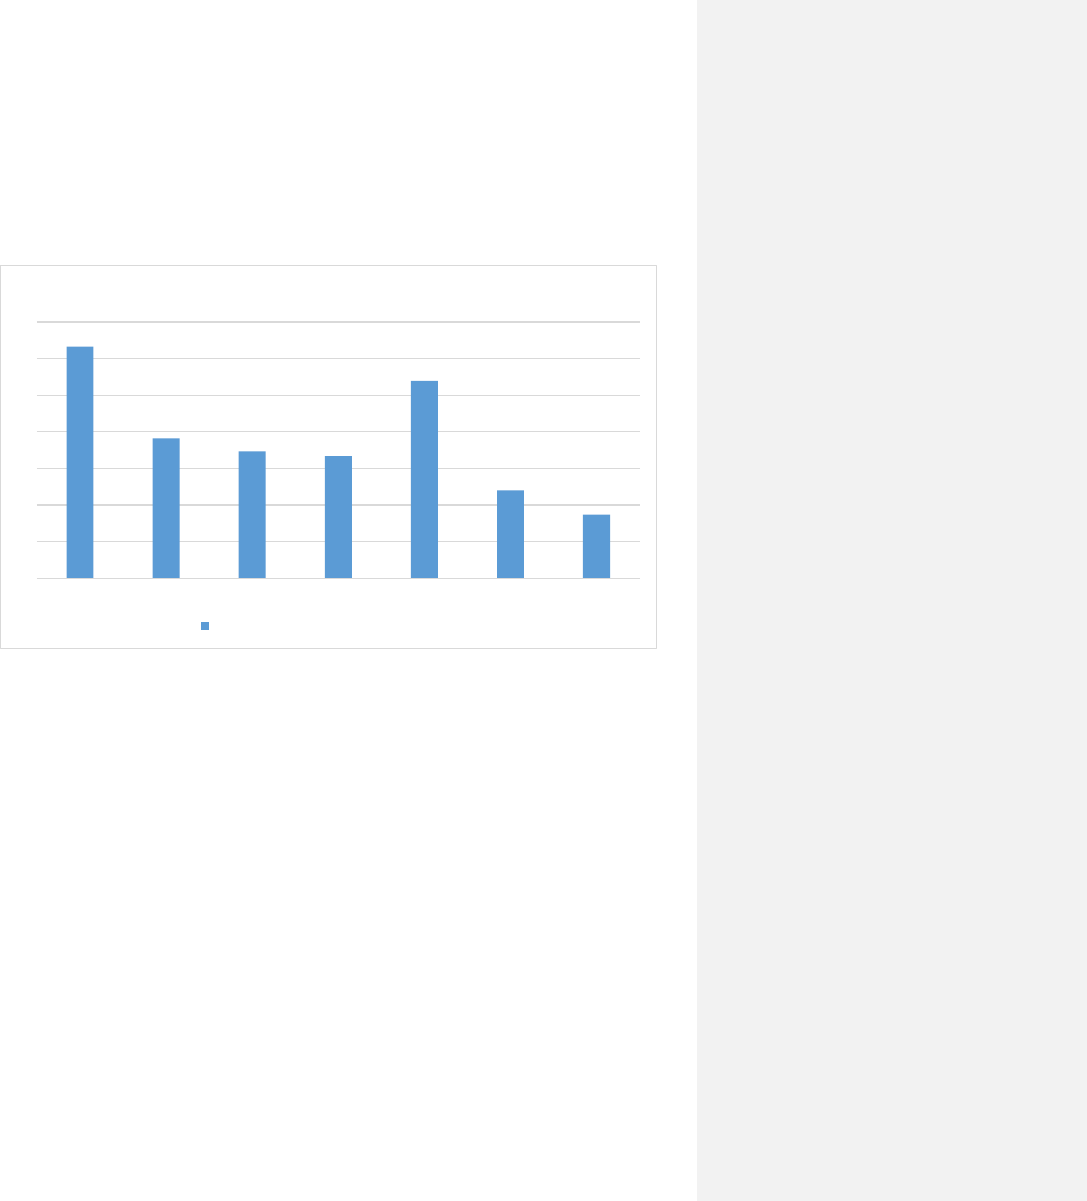
Substance Abuse
Age-Adjusted Cirrhosis/Liver Disease Deaths
Lowest – Yuma Highest – Navajo

52
High-Risk Alcohol Use
Lowest – Navajo Highest – La Paz
Source – countyhealthrankings.org
Lowest – Cochise Highest – Graham
Source – countyhealthrankings.org

53
Drug-Induced Deaths
Lowest – Greenlee Highest – Mohave
Tobacco & Cigarette Use
The facts about the health effects of smoking have been known for years and we have seen a
decline in the amount of deaths. However, “Smoking is the single most preventable cause of
death in the U.S.” In the Northern Arizona counties the Mohave county meets the highest rate
of smoking for Arizona but the rest of the counties fall below.
- Arizona Health Assessment azdhs.gov
Lowest – Yuma Highest – Mohave
Source – countyhealthrankings.org
All 2013 data was take from Arizona Department of Health Services Dashboard unless noted otherwise

54
Oral Health
Oral health of Arizona preschool children remains below national recommendations
(http://www.azdhs.gov/documents/prevention/womens-childrens-health/oral-
health/survey/survey-preschool.pdf).
The Arizona Department of Health Services, Office of Oral Health’s (OOH) survey of preschool
children shows that the oral health of Arizona preschoolers is well below national
recommendations. Oral disease is nearly 100 percent preventable and this new information will
help determine what resources are needed and where best to place them to improve the oral
health of children statewide.
Arizona preschool children have a significant burden of oral disease and it starts early with 7%
of children ages birth through age one having the first signs of tooth decay. By the time
children reach the ages of 2 through 4, 37% have had tooth decay and 30% have untreated
tooth decay. These levels are far beyond the U.S. Department of Health and Human Services’
Healthy People 2010 targets of 11% having ever had tooth decay and 9% having untreated
tooth decay.
Data further show that race, ethnicity and socioeconomic status may be factors in oral health.
Over 43% of Asian/Pacific Islander children ages 2-4 have untreated tooth decay. Thirty-four
percent of Hispanic children have untreated tooth decay with similar rates found in Black (32%)
and Native American (31%) children. Children who come from families where
parents/guardians a high school education or less are much more likely to have untreated tooth
decay (42%) than children who come from families with parents/guardians who have more than
a high school education (24%).
Dental insurance status was not significantly related to whether a child had untreated tooth
decay. Twenty-seven percent of children who have private dental insurance have untreated
tooth decay; similar rates are found among children with public dental insurance (32%) and
children who have no dental insurance (30%).
The American Academy of Pediatrics (AAP) recommends that children be seen by a dentist
within 6 months of the first tooth erupting or by 1 year of age, whichever comes first. Only 6%
of children ages birth to one had seen a dentist, according to parents’ reports. In addition,
older children are not getting needed dental care; more than half (54%) of parents/guardians
responded that their preschool children age 3 had never visited a dentist.
These results indicate that tooth decay clearly remains a problem for young children in Arizona.
Although preventive measures, such as fluorides have been widely available for years, efforts
need to focus on reaching underserved children who stand to benefit the most. These findings
challenge us to strengthen disease prevention programs and to implement strategies that lead
to treatment access for specific populations. The direction of OOH is to address this and other

55
oral health issues by setting goals and providing specific, measurable and time-phased
objectives and activities for accomplishing them.
Methods: Preschool children received oral health screenings at 100 randomly selected licensed
child care centers with classroom sizes of ten pupils or more. The screenings of 989 children
were completed during the fall of 2008 through the spring of 2009. The survey involved a
standardized cross-sectional, open-mouth screening developed by the Association of State and
Territorial Dental Directors and conducted by trained dental staff.
Key Findings:
Tooth decay starts early in childhood; 7% of children ages birth through age have the
first signs of tooth decay.
Children ages 2 through 4 have tooth decay rates far beyond national
recommendations; 37% have tooth decay experience and 30% have untreated tooth
decay.
Disparities exist for children who come from families where parents/guardians have a
high school education or less. They are significantly more likely to have untreated tooth
decay (42%) than children who come from families with parents/guardians who have
more than a high school education (24%).
Children are not getting needed dental visits; 54% of children age 3 had never visited a
dentist.
To view the detailed factsheets, please visit: http://www.azdhs.gov/phs/owch/ooh/index.htm .

56
Dental Care in Northern Arizona
Data reported here were collected by the Coconino County Public Health Services. Each year, they
randomly examine children, ages 1-6, from the surrounding communities.
0
0.1
0.2
0.3
0.4
0.5
0.6
0.7
0.8
1 2 3 4 5
Percentage of Children with
Untreated Dental Decay
Age
Proportion of Children with Untreated Dental Decay
by age and Primary Care Area
Flagstaff
Grand Canyon Village
Page
Winslow

57
2019 Community Needs Survey
Survey Population Demographics
Northern Arizona Healthcare administered a widespread survey asking questions regarding
1164 local individual’s perceptions of their access to healthcare. Survey respondents were
predominately female (79.71%), married (64.32%), white (86.32%), and/or not of Spanish,
Hispanic, or Latino descent (91.20%). The following tables and graphs provide descriptive
statistics regarding the survey respondents’ demographics.

58

59

60

61

62

63

64

65

66

67

68

69

70

71

72

73

74

75

76

77

78

79

80

81
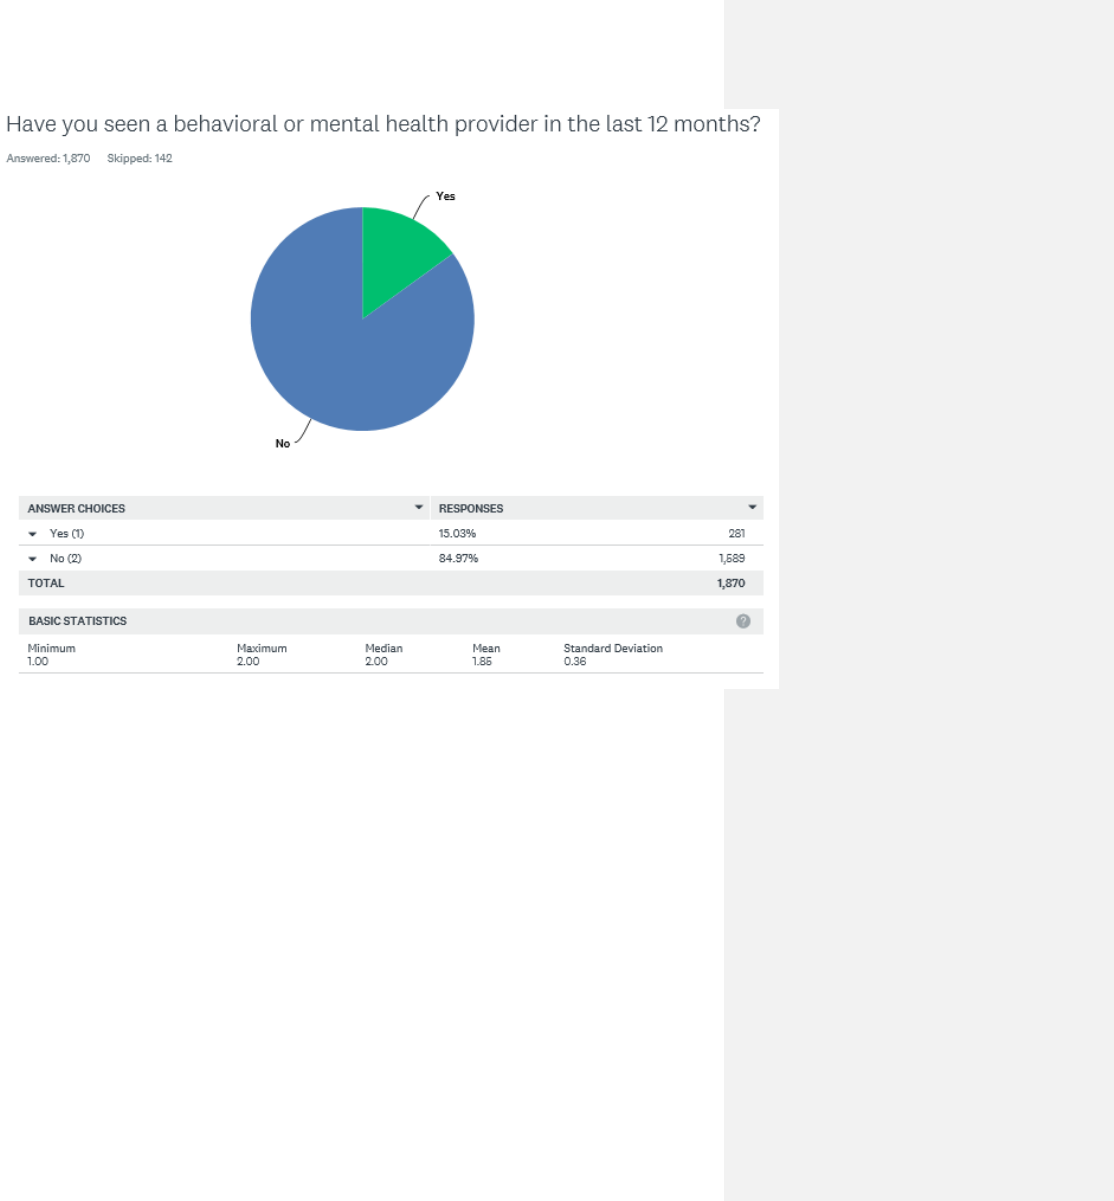
82

83

84
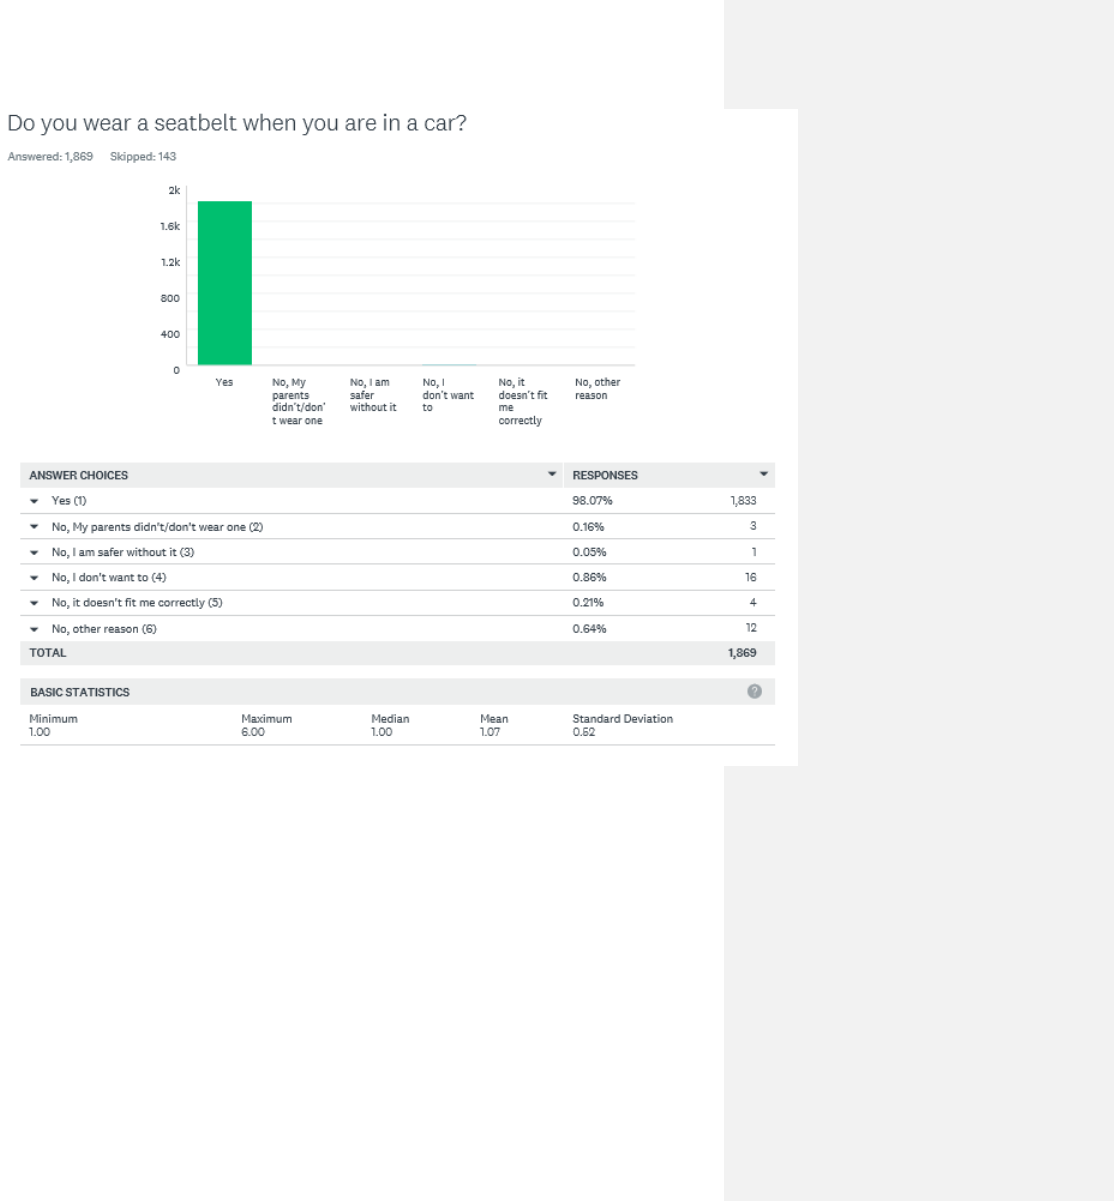
85

86

87

88

89

90

91

92

93

94

95

96
(Do you have any of the following health challenges? Cont.)

97

98

99

100

101

102

103
(What are your biggest barriers to healthy eating? Cont.)

104

105
From the 1164 individuals that answered the survey, 195 (16.75%) offered comments after
being asked Are there any other health issues that we did not include in the survey that are
very important to you?. These comments (n=260, as some individuals offered a comment that
covered more than one topic) were categorized by themes emerging from the responses given
(n=28). The top 5 themes are:
Behavioral Health care: access to services and health issues 27 responses
Lack of local specialists (endocrinologist, neurologist, pediatric) 23 responses
Access to affordable health insurance/health care in the community 21 responses
Providers (physician/ staff) seen as uncaring, long wait for appointments 19 responses
Access to more PCPs in town 15 responses
A complete list of the themes and the percentage of responses received for each one is
presented below. Verbatim comments are listed at the end of this document.
Commented [RD1]: I did not update/change this, or any
of the following pages.

106
Are there any other health issues that we did
not include in the survey that are very
important to you?
195 individuals provided a response other than “No”
● $1500/$3000 deductible is not doable. I have had to stop pursuing treatment for my child's back
injury due to not being able to pay the deductible for the hospital's insurance, and I have the
best plan. I now owe $1200 and can not take him back to the doctor for follow-up and further
treatment until I pay that. I had better insurance when I worked for the State. $70 co-pays for
specialists are outrageous. For someone who works for a hospital, I have less access to
healthcare than I did when I didn't work in the industry. Not happy at all and my husband is
absolutely outraged.
● ***GOOD*** MEDICAL CARE!!!! Our health has declined greatly since we moved here. Medical
care here sucks. Bad, rude, uncaring support staff!
● ability to minimize cost to myself (deductibles) by comparing fees from multiple sources.
● Abuse prevention, nutrition, access to healthy foods and beverages, stress management
● Access to affordable health insurance, self pay, if working less (preretirement) and not yet
qualified for medicare
● Access to affordable healthy foods
● Access to all aspects of health care, including PCP, Dental, Vision and Mental Health care are
incredibly important. If one is very poor, then State aid will kick in...but only if one has been
away from a job that pays minimum wage or less, or no job, for a year (this was told to our son
who was out of work and desperately seeking insurance). If one is well off, then medical care
can be paid for. In-between folks whose incomes are not huge but not poverty level, are left to
search for a plan that covers all the above important parts (ie. dental/vision/mental health,
etc.)....but...this is a huge and defeating task when most of the carriers out there will carry some
things and not others, and charge huge fees (ie. close to $400/month or more). Mid-income or
low end folks are being hurt badly right now, and they are letting their health go because of it.
Our son is a great example. He had a job paying $17/hr, but still got a low end BCBS after
searching the Obama Plan type insurances, and then couldn't get the mental health coverage he
needed for his anxiety/depression issues. Dental was also not well covered, and any work would
create astronomical bills that he could not recover from. This is an ongoing issue for many, many
folks of today.
● Access to general practitioners. Seems they are too limited in numbers. Emergency room is a
nightmare experience!
● Access to health care in Flagstaff is limited. Due to problems getting in to Northern Arizona
Medical Group, I had to get an appointment with a physician in Phoenix, so now I have to drive
100+ miles for primary care, and go to urgent care for emergencies.

107
● Access to mental health care in a reasonable amount of time
● Access to mental health providers. Very important!
● access to mental healthcare
● Affordability of health CARE, not just health INSURANCE is the issue. It's not enough to have
health insurance if the out of pocket costs are unaffordable.
● Affordable exercise facilities in Flagstaff.
● AFFORDABLE HEALTH CARE FOR A HARD WORKING PERSON THAT MAKES OVER 50K A YEAR
● affordable RX medication/ chronic disease help
● Affording health care and medications as I approach retirement.
● Alcoholism in the community and all it's consequences.
● alcoholism/family members of alcoholics
● All people receiving quality healthcare even if they do not have insurance.
● auto immune diseases
● availability for alcohol rehabilitation programs
● Availability of primary care physicians as well as specialty physician in Yavapai County
● behavioral health issues
● Being able to get into a doctor in a timely manner.
● Better nutrition is very important
● Better RX coverage
● CANCER
● Cancer prevention
● cancer screening for those that can't afford insurance
● Cancer treatment and support, access to hospice, palliative care or SNFs. These are very
expensive and illness is very unpredictable. No one expects to get diagnosed with cancer. When
they do, there isn't enough support medically or financially for these patients.
● Can't not afford my health insurance deductibles.
● cheaper health insurance and when 2 people work at fmc should not be penalized an extra
25.00 per pay period because of that 2 people work at same facility
● Childhood intervention and prevention related to healthy foods and exercise.
● chiropractic care, Accupuncture/accupressure,
● chronic exhaustion from a stressful work schedule
● chronic illness education and counseling to help minimize exacerbations of chronic conditions
● Coat of prescription drugs and the large number of unnecessary appointments with Dr. To
obtain/maintain script.
● Conventional approaches to healthcare tend to be too quick to prescribe pharmaceuticals too
quickly which often interfere with people's incentives to be more responsible for promoting
their own wellness. And most MDs and health professionals are unaware about the nature and
benefits of complementary options
● Cost of health care is outrageous, even with insurance. Healthcare should be less costly so it is
available to more people.
● decent coverage for mental health (depression) issues
● Deductibles are too high, causing many of us to delay or not seek the care we need to get
healed.

108
● Dental insurance is too expensive for those who don't have insurance and dental visits are too
expensive for the uninsured. Obama care doesn't offer dental and medicaid no longer covers for
adults.
● Depression
● Depression -not necessarily a mental illness - more a life illness
● depression, and stress control.
● Diabetes
● Diabetes, cancer, heart disease, suicide, behavioral health, healthcare for inmates, medical
insurance that has very good coverage (regardless of price)
● diabetes, some of these questions are none of your dang business!!!!!
● Diet is very important in preventing many of the health problems people have. I believe eating
processed foods and tons of sugar contributes to many if not all the health problems people
have.
● Easy access to affordable, healthy, REAL food. Better education about what real food is (ie.
minimal processing with simple ingredients).
● Educating people about diet according to independent, unbiased, long-term studies. PLANT
BASED OIL FREE diets. Not PROTEIN, PROTEIN, PROTEIN!!!
● Education. Overuse of anti-biotics because of ignorance.
● Employers may pay for some of the costs for employees but as costs increase, this becomes
harder and harder for families to afford health insurance. Barriers to care.
● Environmental issues, public health, community health
● Exercise places and activities for after middle school age children.
● eye care coverage
● Eye drops to prevent a high pressure reading to turn into glaucoma.
● Feel that it is terrible that I work for the hospital and almost none of the PCP's in the area are in
the Pathfinder so I have to pay more to see them.
● Few issues in #46 truly affect me, so it is not a valid or reliable question and answer for me. The
biggest issue is socio-economic - the disparities in care and affordability for people not as
privileged as I have been with good health care.
● finding a Doctor that will listen to you instead of telling you how you feel.
● Fines from Obamacare
● FMC hospital costs as compared to outpatient facilities or facilities in the Valley
● food insufficiency causing nutritional and other health issues in the general population
● For our community: Alcohol/Drug use, poverty, lack of endocrinologist in the community.
● Friends and I sometimes leave Flagstaff for care because it is too difficult to get an appointment
with a specialist here, or because we feel that the doctors and hospitals are better in the
Phoenix area or in Prescott.
● Greater access to non NAH, affiliated Doctor's of my choice. Support our access to a broader
range of choices not trying to restrict us NAH contracted healthcare. Go on the principle " build
a better healthcare system/structure here and they will come" not, restrict their choices and
they have to come! We DO NOT want a scenario wherein a system develops like Veterans have
to deal with. This seems likely with recent changes We've all noted since the recent
healthcare/insurance changes have begun. Needed is a range of provider's with the time and
range of training and experiance to address ALL my concerns or needs with out being influenced

109
by mandated time lines or other predetermined restraints/treatment options to my healthcare.
Limit restrictions of payer % for out of network. Support our rights to enable us to maintain
relationships with more than one doctor for comparison/second opinions on health issues. LESS
control by insurance Co.'s on providers! Universal oversight of insurance Co.'s in general to slow
the fleecing of people dependent on them with little or no choice for other insurance. More
oversight and more restrictions of institutions that self insure and write in major constraints like
the ones mentioned above in relation to payer % for Company doctors which results in lowering
our choices and our quality of healthcare by definition at the same time! Lower choices = lower
quality! We know Wal-Mart proved that on a grand scale as did the aforementioned Veterans
Administration. Finally posting of ALL prices for ED, Provider in and out patent services
compared to ALL other facility's world wide. This will eventually give us a real time picture of
what is going on and what is actually needed.
● Health care in America is far too expensive, with too many wealthy people at the top of the
health care delivery systems !
● Help with obtaining and understanding health care.
● High stress jobs, feeling secure at your place of employment (NAH) Our organization could do
better.
● HIV, testing, medical care. Transgender HRT, etc. education.
● How to encourage people to make better decisions: get some exercise, eat more healthy foods,
choose not to use tobacco. What factors drive people to make poor choices in the first place &
address these issues.
● I am concerned that my cardiologist, Dr. Dewar, won't be able to see me due to his office
closing.
● I am healthy. For the community, continued attention to obesity (FIT KIDS), alchohol in the
community
● I am most concerned for those in our community that have insurance but cannot afford copays
and deductibles but make too much for assistance. Like myself and my husband medical costs
take a big chunk of our budget and we cannot pay all our bills.
● I don't like the receptionist asking if you are on drugs or what you are there to see the doctor
for. I don't like only being able to talk about one thing with my doctor at a visit, since it takes so
long to get in. When you schedule an appointment ( and have to wait several weeks to get in) it
is canceled by the doctors office and rescheduled, this happened more than once for the same
appointment. I really don't like not being able to switch doctors within the same clinic. I think
Summit Health Care has some real problems in the way they operate their clinics. We do not
have enough family or specialty doctors in this area. From a business few, I think they need to
resect patient confidentiality, and lose medical releases.
● I filled out this survey for my 11 year old. He has some mental health issues which are hard to
address here in FLG. Since we have BCBS it is very difficult to find providers. He would be much
better off on ACCSS. Currently he sees Amber Wright via telemed, but if his issues get any more
involved, we are looking at commuting to PHX.
● I had a seizure and needed to see a neurologist within 4-6 days of my seizure. There were no
appointments available until 3 months later. Therefore I have to find a way to get to Phoenix, I
am unable to drive myself because of my seizure, and have my follow up appointment done

110
there. I wish Flagstaff had what I needed. It's caused me to lose faith in what care our
community provides. Many of my friends and family now feel the same.
● I have had several friends that are unable to receive follow up care with these following
specialists: neurologist, pulmonologist, high risk perinatology, pediatric orthopedics, all because
the soonest appointments were months out. Therefore, they traveled to Phoenix. It is
frustrating when our own local hospital and specialists can't provide care to our local
community. Due to this issue, I know multiple people that have transferred their specialty care
and needs to Phoenix. They now feel FMC and it's specialty partners are not able to address
their needs and the respect for Flagstaff Healthcare declines.
● I have insurance though my work but I have a lot of out of pocket costs, the insurance doesn't
cover as much as it used to. I have not had procedures done because I didn't want to pay the
out of pocket portion.
● I think its funny how you expect people to get insurance and if its offered at there job you all
believe its affordable if I put my family on my health care I would owe the company I work for
money so then what?! how do I pay my bills, feed my family, clothe them and pay for school
supplies?! Then when when I apply for help access the people you have working make you feel
like a piece of crap! I work I pay my taxes im not a free loader living off the state but I do need
help, but its IMPOSSIBLE in this state, country to get that help without being treated like CRAP!
Trying to get into a Dr. is now is horrible!!! I cant even pee in a cup when I know I have UTI for
two weeks, Yeah ok thanks now I will get a kidney infection too.Summit has made seeing our Dr.
a pain and a inconvenience. WE need affordable heath care, not this Obama crap!
● I think that this is too personal therefore I left a lot of it blank as only my doctor and I need to
know thank you!
● I would have included all as exceptionally important only one somewhat less important would
have been injury prevention
● I would have included mental health in the Health People 2020 issues. Especially considering the
recent string of completed suicides on the Navajo Nation. Vision and hearing are also extremely
important to me.
● IBS
● illness prevention- naturopathic or simply healthy living.
● im Asthmatic
● importance of women's health and adequate prenatal care, health education in the schools,
education within the community regarding reasons to visit the emergency room versus primary
care doctor. Access to urgent medical care at a reasonable cost.
● Infections resulting from hospital care
● Insurance coverage for complimentary alternative therapies.
● IT is difficult to schedule appointment with physicians VVMC employees are to see, if really ill
you are told to go to urgent care or ER
● it is not just the access to care, but the quality of care that is an issue, I would rather travel to an
excellent team than go to a doctor who is not giving quality care or has a team that does not
treat me with respect or dignity.
● It is not only important to have a PCP but also to have access to specialists. Also, having a
physician does not help if that person is not doing a good job. I have been unhappy with several
of my recent medical experiences due to physicians who either did not care or did not know

111
what they were talking about and were not willing to educate themselves. I had to go to the ED
earlier this year at FMC and the physician not only provided substandard care but he refused to
evaluate me for the reason I was actually there.
● It shouldn't take 3+ months to get in to see NAH employed physicians, especially when you work
for NAH. Outpatient services are incredibly expensive at NAH facilities.
● It would be nice if NAH could be a part of the community instead of an island. We are fortunate
to have so many great providers in our community, however NAH's "us versus them" mentality
creates gaps in services and gives one the impression that profit is more important than the
community you serve, that is really sad.
● Lack of choice at close proximity
● lack of doctors in extreme northern arizona (outside of Flagstaff and IHS)
● Lack of neurology support, lack of specialists for non-sports orthopedics/hand surgeons, lack of
specialists for spasticity management after stroke
● laws to require seat belts use,
● leading off of the selected "access to a regular doctor," I would say that timely access in this
town is more of the challenge. Even if you are sick, all doctors are booked and you have to wait
several days to be seen.
● Limit the intake of sugar, soda and packaged goods
● LONG TERM CARE - HAVE SEEN TOO MANY SENIOR CITIZENS NOT ABLE TO GET CARE BECAUSE
THEY HAVE NO MONEY BUT MEDICARE AND NO SERVICES FOR IN HOME CARE FOR MORE THAN
A COUPLE HOURS EACH DAY THAT IS COVERED
● Lower insurance deductibles Lower premiums
● Lower prices and hospital transparency about pricing.
● Lowering the outrageous costs of prescription medications. There is no excuse for it. None.
● Maternal health. Access to affordable and safe child care.
● Menopause
● Mental health
● Mental health issues
● mental health issues are extremely important
● Mental health issues related to the well-being of American Indians and Alaska Natives.
● Mental health. Expanded preventative measures such as more counseling available and other
measures to prevent burn out or poor coping.
● Mental health: I have depression and take medication for it.
● mild cognitive impairments from mential illness stress or dementia.... dementia is not a mental
health problem. Caregiver burden from a family member who has a serious health problem/or
dementia.
● More mental health community and hospital resources are absolutely essential. Why doesn't
FMC employ Psychiatric Mental Health Nurse Practioners to fill the gaps of lack of ability to
recruit Psychiatrists? The prices for counselors in the outpatient FMC clinic is outrageous! Plus,
they never are open for new patients. I once asked out of curiosity, how many new patients the
psychiatry clinic turns away. I heard it can be about 5 patients/day. We could generate business
if we had providers and competitive prices! I would like to stay local, but can't get a local
psychiatrist...
● My daughter and family are on AHCCCS but she does not have good dental coverage.

112
● My doctors keep leaving town every year!
● My regular doctor is a naturopath and dentist are in Prescott. There are a lack of OB/GYNs in the
Cottonwood area. Also dentists who take our insurance which is Tricare/UHC. The imaging
center is good but I would like access to CT colonography of which also I cannot get in Prescott.
● Myself and my family have access to excellent health care and utilize the services as needed.
Many people in Coconino and Yavapai counties do not. Some primary issues are, providers who
don't accept pt ins., nor have openings. Providers who work part-time and are unavailable to
respond to urgent issues of known high-risk pts. Many elderly folks need help to dispense daily
meds and they need meds delivered to their homes. FMC has sought ways to deliver meds but
that's only upon D/C. Two community based programs, NACOG and VVCG, fill gaps in care but
have limits on their scope of practice as well as service area. NAIPTA approves most para-transit
riders but the transport time periods are lengthy and exhausting to ill disabled or elderly folks.
CATS transit in Cottn is the same plus provides rides to a very limited geographic service area.
Historically, FMC facilitated safe and appropriate hospital D/Cs. Over the past year, hasty D/Cs
have been noted, resulting in pt's in unsafe environments; even leading to readmits. VVMC has
not infrequent unsafe D/Cs and has for many, many years. Both have utilized the "observation"
status with negative consequences to pts including higher out of pocket costs, confusion around
hospital status, lack of access to needed placements. Billing is a significant issue. As NAH
impresses need for cost cutting measures, I've known of pts receiving fairly routine care not
getting billed for near a year for their hospital stay.This leads to a significant lack of trust in the
NAH system w pts citing they will seek care in Phx rather than No AZ. Thank you for accepting
my additional input as it speaks for at least 100's of No AZ residents.
● Neurology - It takes 3 months to receive a consult.
● No, but question 28 was a horribly written question, how is suicide or abuse an accident!!
● No, but there are questions that are not important
● no, yes help for homebound seniors, I broke a bone and could not use my left leg and by the
time I had help I was a month away from being done but the first month extremely difficult, and
I found the medical equipment I needed and paid for it or borrowed, what in heaven's name do
more fragile seniors do? I believe well seniors really could take up the slack and gladly
● Not many of these questions relate to the elderly, who have distinct issues. I know our
population skews young, but in spite of Medicare and VA my experience is the elderly struggle
to navigate health care, especially serious illnesses & chronic conditions.
● Nuclear Radiation and its effects on the human body. Thyroid cancer, Down winders information
needs to be provided to people, not just by the North country health center but by all health
centers in the area.
● nutrition
● on #46 the reason I don't get insurance through NAH is because the deductible is 1600 dollars. I
have worked other places and have never seen one that high. Also to see a specialist is $50-55
bucks!
● Once a person retires from their job and if its before 65, they usually have to pay an arm and a
leg for insurance or take their chances without. Some bridge program that is affordable would
be wonderful.

113
● One thing that is rarely discussed is access to fitness equipment or gym memberships, which are
often unaffordable, yet crucial to optimal health. I would like to see more insurances and
organizations help people have access to this.
● Over prescribing medications
● Overloaded Primary care clinics in the area. We need more PCPs!!!! Please
● overprescribing of medication by doctors. access to care for mentally ill individuals and care
beyond prescriptions.
● Patient responsibility to follow up with education and instructions given by medical staff
● people with out health insurance and work lower income jobs can not afford the Healthcare
marketplace insurance. and therefore get very little preventive care which is very important for
future generations. every community should have available services for the homeless and
mentally ill. a facility where they feel welcome and can receive the help they need. Thank You
for your concern.
● Physical activity / exercise would be my 4th choice in question 46.
● Poor quality medical care in community. Local physician misdiagnosed my wife multiple times
and recommended major surgery each time. I was misdiagnosed at the emergency center and
was not properly diagnosed by, at that time, my local DR.
● Prenatal breastfeeding education and access to breastfeeding support.
● Prevenative care
● preventative medicine
● Prevention
● Preventive health care is a big issue. Why is natural/holistic practices not covered by insurance?
● pulmonary doctor once Dr Arnold leaves for husband
● Regular HIV/STI testing for those at risk of infection.
● Resources for preventing stroke, followup home programs when family is not able to assist.
● sleep time
● Socialized health care is the only humane system of health care. Those who prey on the most
vulnerable members of our society through the great scam that is the American HealthCare
system are truly, morally corrupt. Start asking some questions that engage the people in taking
back their right to the products of their labor.
● Some type of behavioral heath resources for all populations, not just the homeless, including
legislative reform that closely monitors risk to society from these types of behaviors.
● Specifically, childhood obesity
● stress at the work place
● stress management and wellness
● stroke prevention
● substance abuse
● Substance Abuse, it is rampant!
● Sudden Unexpected Infant Death/Sudden Infant Death Syndrome
● suicide and depression screening, prevention of partner abuse/domestic violence,dx and tx of
diabetes and it's complications
● Sun exposure and skin cancer. These are major regional risks.
● The effects on our nation's economy and general health of our current medical care
system...which is dominated by money at all levels

114
● The fact that medical insurance does nothing for mental health issues and THAT is really what I
need. THAT is my biggest concern and it was not even listed above. Mental health is really
important and it is completely ignored by today's "Affordable Health Care". Also my health
insurance which used to have mental health coverage was WAY cheaper than this "Affordable
Health Care" that I now have and I no longer even have that coverage. My costs for health care
have almost tripled for less health care that I used to receive. That angers me as now I am
getting less health care than I was previously.
● The fact that your billing department sucks - they can't ever get the billing correct and we have
been referred to Prescott where costs are half of yours- and gladly went over the hill to save the
expense of costly care
● The nationalization or attempt thereat of health insurance.
● The obscene lack of funding for mental health and for education. There is a clear and proven
correlation between socio-economic status and health -- socio-economic status is primarily
driven by education level. Mental health is a growing problem in our community and state. And
with the presence of so many unregulated "recovery homes" in our community (Prescott) that
becomes a major factor in driving up our suicide rates, our health care costs as many of those
people end up in the Emergency Room and the quality of life in our community.
● The Verde Valley needs neurologists. If they won't move here to live and work, then NAH needs
to use telemedicine with neurologists in the Phoenix or Tucson areas.
● There are two issues. 1. Peanut and Nut Allergies 2. Pharmaceutical Allergies
● There is a lacking of primary care providers in the Flagstaff area
● There is more than sufficient evidence on an individual level to show that the use of alternative
therapies (homeopathic remedies, naturopathic medicine, acupuncture etc.) work extremely
well for many people. In fact, these alternatives often work even when conventional medicine
does not. I am an example of where conventional medicine failed and alternative medicine
succeeded. But I am one of the fortunate ones. I was able to spend $20,000 out-of-pocket to pay
for treatments not covered by insurance. Until insurance pays for alternative care our
population will continue to get sicker. Canada is just one example of a country that pays for
naturopathic/alternative care. They spend less per capita on health and their population lives
longer.
● This community needs about 3 more neurologists for outpatient care.
● Timeliness of getting appointment with PCP Providers
● Veteran care for physically injured and PTSD
● Vision
● Vision
● Vision care
● Vision care. Care for elder family members.
● Vision.
● Vision...The provider I want to see is unavailable to my current vision plan (Sam's) ...wish I had
more options
● Waste. I am disgusted by how much waste there is in the industry. When people do not pay for
something directly they tend to abuse and take advantage of it. I see this every day and am
angry that I pay for others to take advantage of a system that doesn't run well as a result of
people wanting others to support their poor choices and take care of them after poor choice

115
after poor choice has resulted in poor health. Benefits should be awarded on result. If you do as
your doctor instructs (right weight, right lab results, right lifestyle choices) THEN you get
discounts and services. If you refuse to follow advice, you lose more and more services every 3-6
months until they are gone. If it is important to you, you will find the motivation to provide for
the needs or meet the requirements. If not, you will make excuses in which case you should not
receive my money to support your poor choices.
● We finally have full Cardiology coverage, but need more PCP's, GI, and Neurology in this town. If
you aren't employed by Gore, Purina, FMC or NAU, you likely have a high deductible plan
without dental or vision coverage paying full (exorbitant) rates for care until you meet your
deductible.
● We need endocrinology in Flagstaff
● We need more dentists with more appropriate hours for appointments in Flagstaff.
● we need more family practice in this town.... several that we have totally suck... and there is no
support for them....
● When is VVMC going to increase bed capacity? Understand ship patient out if they need
specialized or higher level of care but just for no beds available is ridiculous. Before my husband
passed, he was shipped to Phoenix multiple times causing undo stress on him and me, cost of
gas, meals and hotel rooms. His last transfer basically caused his demise. Doctors were not
familiar with him or how his doctors up here were treating him aggressively for his conditions
and it caused him to decline rather than improve. Now a widow, what happens if I get
transferred to Phoenix? No way to get back home when I am alone. VVMC wants to be the best
of the best and I am all for it but you need to expand your capacity to keep patients near their
homes as well as your expand technology to treat those patients.
● When you are let go from a job, for instance NAH lays you off after more than 15 years
employment saying your position was eliminated, they should at least offer you health
insurance besides the very very expensive cobra for at least a month while you try to figure it
out. how can NAH say they care about the health of the community when they care so little
about the health of their own people, even if they are letting those folks go due to budget
reasons. Seriously, having to come up with health insurance money nearly put me under. NAH
would not have even known they were paying for me for one more month. To be it was like
being bitten by a rattle snake, to them it would have felt like a gnat landing on their skin.
● Wish general fitness was free including personal training at gyms. Also wish there were free
dietician services for those without a diagnosis of diabetes or cardiac conditions
● With regard to dependents, I think there should be questions about pediatric care/check-ups.
● women's health issues
● Yearly increases in premiums and rising co-pays even with medical insurance coverage.
● Yes - the wait time to see a physician in Flagstaff is way too long.
● Yes I do not understand why when I work in the healthcare field taking care of patients, my blue
cross insurance is not great and I get a bill for nearly $600 after insurance for 3 physiotherapy
sessions at my work outpatient??? I have sore feet from the long hours at work on my feet, but
no help from work for this problem and now a big bill for PT????? This seems crazy to me?
● Yes Northern Arizona needs a high risk perinatologist/OB and a pediatric neurologist
● YES! You didn't even collect information related to diversity! Your survey was not mutually
inclusive and did not have a box for transgender people. In fact, I only took the survey to explain

116
how offended I am that in 2015, health orgs still ignore my identity status. You should know that
you are missing an entire population because you neglect to add an additional box so my
community can matter. Thankx
● Yes, How many times did you have to go back to the emergency room because a full diagnosis
0n a child was not done the first time- sent home without meds. Had to come back 4 days later
with worse pain, fatigue and weight loss.
● yes, I see a nurse practitioner. Family doctors are nearly non-existent now a days.
● Yes, I want to have a healthcare provider that knows me. Too many clinics have md's/np's that
do not stay around for too long. Seems similar to urgent care- which is not ideal. Also
preventative healthcare with nutrition and excersise very important to me
● Young adults between jobs and at low paying jobs can't afford dental care and health care.
● youth behavioral health, access to behavioral health care for children and adults, availability of
emergency mental health care/hospital beds

117
Conclusion
NAH’s 2019 Community Health Needs Assessment (CHNA) identifies ongoing health needs, data
that can guide and inform a concerted strategic planning, funding and implementation plan
through 2021. Since NAH’s 2016 assessment, some issues improved, yet some parameters grew
worse.
Positive progress includes lower incidence of diabetes and an increase in mental health
resources. Local agencies are partnering or increasing services to address unmet community
needs identified in 2016. This is particularly true in the area of suicide prevention and mental
health – where new coalitions have formed for both suicide prevention, mental health first aid
and pediatric behavioral health.
Like most of the United States, the community struggles to recruit and retain enough health
providers, at a time when its aging population increases health service demand. However,
solutions such as comprehensive care management, remote patient monitoring, health
coaching, nutrition programs aimed at disease prevention, mental health first aid training, and
community integrated paramedicine have all been created and/or supported by NAH to
address various health needs and access in the community.
NAH is always looking for ways to partner constructively with community agencies and
organizations throughout northern Arizona to improve health and heal people. The 2019 CHNA
will assist in guiding funding with our partner Foundation, as well as support increasing access
to healthcare in our primary service area.
In listening to our communities, NAH will be sensitive to the community recommended
solutions to address the prioritized needs:
I. Collaboration with organizations across the region to compliment services and provide
interdisciplinary support for community members.
II. Social Determinants of Health need to play a key role in healthcare and patient care plans
going forward.
III. Increase quantity and quality of health services
IV. Increase capacity through training and collaboration
V. Integrate health services: primary care, mental health, etc whenever possible
VI. Increase awareness of existing health and social resources

118
Sources
1. Arizona Department of Health Services (azdhs.gov)
2. Arizona Cardiovascular Disease State Plan- Susan Gerard
3. Arizona Health Matters (arizonahealthmatters.org)
4. CDC Wonder Database (wonder.cdc.gov)
5. County Health Rankings (countyhealthrankings.org)
6. Healthy People 20/20 (healthypeople.gov)
7. U.S. Census Bureau (census.gov)
8. “Advancing Wellbeing in Northern Arizona: A Regional Health Assessment”, Northern
Arizona University Center for Health Equity Research. 2017.
9. census.gov/quickfacts
10. https://pub.azdhs.gov/health-stats/report/avs/avs18/pdf/avs2018.pdf (Arizona
Department of Health Services 2018)
11. wonder.cdc.gov
12. https://pub.azdhs.gov/health-stats/report/ahs/ahs2017/pdf/5e13.pdf (Arizona
Department of Health Services 2017)
13.
http://azdhs.gov/documents/preparedness/public-health-statistics/cancer-
registry/reports/arizona-cancer-registry-data-2003-2012.pdf
14. https://www.azdhs.gov/documents/preparedness/emergency-medical-services-trauma-
system/reports/2018-stab-annual-report.pdf
15. https://pub.azdhs.gov/health-stats/report/suicide/2018/suicide-report-12-2018.pdf (Arizona
Department of Health Services 2018)
16. https://azdhs.gov/documents/operations/managing-excellence/suicide.pdf
