
!"#$%&'&()*+$,-*.$/$0111$%23&)$42'5($6(7$/$"89-5$#:&('(-5;$<=$01>??$@<A/$B>CDBB>D1E?F$/$GGG.HIJ)&'&()*+.*8I
US Market Penetration Of WaterSense Shower Heads,
Lavatory Faucets And Toilets
!
A GMP Research Industry Report commissioned by
Plumbing Manufacturers International (PMI)
July 2015
GMP Research
Global Solutions

!!!
!!!2!
GMP$Research$Inc.$|$2999$River$Vista$Way$|$Mount$Pleasant,$SC$29466$USA|$843D884D9567$|$www.gmpresearch.com
About Plumbing Manufacturers International (PMI)
Plumbing Manufacturers International is the voluntary, not-for-profit international industry
association of manufacturers of plumbing products, serving as the Voice of the Plumbing
Industry. Member companies produce about 90 percent of the nation’s plumbing products. As
part of its mission, PMI advocates for plumbing product performance and innovation
contributing to water savings, sustainability, public health and safety, and consumer
satisfaction. For more information on PMI or its conferences, contact the organization at 1921
Rohlwing Road, Unit G, Rolling Meadows, IL, 60008; tel.: 847-481-5500; fax: 847-481-5501.
Visit our website at http://www.safeplumbing.org.
About!GMP!Research!
GMP Research is a global full service market research and consulting firm located in
Mount Pleasant, SC. GMP Research aims to provide leaders in manufacturing,
distribution, commercial, public and social sectors, and legislators with facts and
insights on which to base management and policy decisions.
GMP Research combines the disciplines of economics and management, employing
the analytical tools of economics with the insights of business leaders. Our "micro-to-
macro" methodology examines forces affecting business strategy and public policy.
GMP Research's in-depth industry reports have covered more than 50 countries and
various industries related to both the commercial and residential construction
markets.
Current research focuses on the market trends in the commercial and residential
construction markets, with special focus on the kitchen/bath industry, the HVAC-R
industry and building materials industry.
GMP Research is led by Victor Post, trained as a corporate economist with a major in
marketing management and market research. Mr. Post has successfully built
business in the United States, Latin America, Europe and Asia. He has held
executive positions with the Kohler Company, Gerber Plumbing, Briggs Industries,
Nokia, Hewlett Packard and Digital Equipment. He spent 20 years living in Europe
and is fluent in English, German, French and Spanish.
GMP Research works with a network of affiliated partners throughout the world. Our
clients are the leaders of their industry and are at the forefront of technology and
design.
Our mission is to supply our clients with the best market intelligence always. We go
to great lengths to research the subject matter at hand, and then spend an equal
amount of time validating our data, to ensure our clients are receiving the best
possible market intelligence.
! !

!!!
!!!3!
GMP$Research$Inc.$|$2999$River$Vista$Way$|$Mount$Pleasant,$SC$29466$USA|$843D884D9567$|$www.gmpresearch.com
TABLE OF CONTENTS
Page
Executive Summary
4
Research Methodology
6
Key Findings
10
• Existing Home Inventory in the United States
10
• Existing Commercial Inventory in the United States
16
• US Installed base of Shower Heads, Lavatory Faucets and Toilets
18
• Market Penetration for Shower Heads, Lavatory Faucets and Toilets
26
Conclusions
Final Thoughts
34
35

!!!
!!!4!
GMP$Research$Inc.$|$2999$River$Vista$Way$|$Mount$Pleasant,$SC$29466$USA|$843D884D9567$|$www.gmpresearch.com
EXECUTIVE SUMMARY
Despite the urgent need to save water, consumers and businesses in drought-stricken states
have been slow to purchase and install the most water-efficient toilets, shower heads and
lavatory faucets, according to this study, conducted by GMP Research, Inc., and
commissioned by Plumbing Manufacturers International (PMI).
The study found that only 5.5 percent of California’s 33.5 million installed residential and
commercial toilets are high-efficiency toilets using 1.28 gallons per flush – the Environmental
Protection Agency’s WaterSense
®
standard for toilets evaluated to be 20 percent more water-
efficient than other plumbing products meeting federal standards. Despite drought conditions
in California, only 21.1 percent of lavatory faucets there meet the WaterSense standard of 1.5
gallons per minute (gpm) and 23.9 percent of shower heads meet the WaterSense standard of
2.0 gpm. The WaterSense program was introduced in 2006 to encourage the use of water-
efficient plumbing products.
The study further found that, on average, 7.0 percent of toilets installed nationwide are
WaterSense toilets, 25.4 percent of lavatory faucets are WaterSense certified and 28.7
percent of shower heads are WaterSense certified. New York, New Jersey and Pennsylvania
have the highest WaterSense toilet installation rates (averaging 10.0 percent), and Alabama,
Kentucky, Tennessee and Mississippi the lowest (averaging 5.1 percent). Texas has the
highest WaterSense shower head installation rate (39.5 percent), and Arkansas the highest
WaterSense lavatory faucet installation rate (35.1 percent). Connecticut has the lowest
installation rates for both WaterSense lavatory faucets (12.7 percent) and WaterSense shower
heads (13.6 percent).
“With droughts beginning to affect more regions of the U.S., now is the time to create stronger
rebates and incentives for consumers and businesses to purchase and install WaterSense
plumbing products,” said Barbara C. Higgens, PMI CEO and executive director, noting that up
to 360 million gallons of water a day can be saved through stronger adoption of WaterSense
products in California alone. “WaterSense products are widely available now, and can quickly
help save water.”
PMI has been providing input to the California Energy Commission, the Department of Water
Resources and the State Water Resources Control Board as they work to fulfill Governor Jerry
Brown’s executive order to develop a statewide rebate program providing monetary incentives
for the purchase of water-efficient plumbing products.
“We also are reaching out to the governors of states impacted by drought to offer our point of
view and assistance,” Higgens continued. “The future is now – a time when steps to sustain
an ever-precious resource must be taken,” Higgens stated. “As good stewards of the
environment, PMI wants everyone to know that using WaterSense plumbing products is an
immediate action that can be taken to save water. There have been tremendous
advancements in the technology and efficacy of plumbing products. Using WaterSense
products is common sense. Start saving more water today.”

!!!
!!!5!
GMP$Research$Inc.$|$2999$River$Vista$Way$|$Mount$Pleasant,$SC$29466$USA|$843D884D9567$|$www.gmpresearch.com
GMP Research reviewed the current housing and commercial property inventory in all 50
states, speaking with industry professionals, utilities, retailers, builders and distributors. GMP
Research examined the housing characteristics of over 171,240 homes in all price ranges in
90 metropolitan areas to determine the number of bathrooms per home, and to determine the
number of plumbing fixtures and fittings installed.
In addition, GMP Research examined the current inventory of commercial properties in the
United States and, by using the requirements spelled out in the International Plumbing Code,
estimated the number of installed plumbing fixtures and fittings in these properties.
The study revealed that almost two-thirds of the homes in the United States are equipped with
the original fixtures that were installed when the house was built.
• 26.7% of the homes were equipped with toilets that consume 3.5 gallons or more per
flush.
• 66.3% of the homes were equipped with toilets that consume 1.6 gallons per flush.
• 7.0% of the homes were equipped with WaterSense certified toilets, using 1.28
gallons per flush or less.
The following table gives a regional overview of the market penetration of the various types of
lavatory faucets, shower heads and toilets installed in the United States:
US!Region!
States!
Lavatory!Faucets!
Shower!Heads!
Toilets!
>!2.2!
GPM!
2.2!
GPM!
WaterSense!
>!2.5!
GPM!
2.5!
GPM!
WaterSense!
5.0!gpf!
3.5!gpf!
1.6!gpf!
WaterSense!
New!England!
CT,!MA,!ME,!
NH,!RI,!VT!
7.6%!
74.6%!
17.8%!
9.1%!
70.9%!
20.0%!
5.0%!
20.0%!
67.5%!
7.50%!
Middle!
Atlantic!
NJ,!NY,!PA!
9.4%!
74.7%!
15.9%!
11.1%!
70.9%!
18.0%!
5.5%!
21.9%!
62.6%!
10.0%!
South!Atlantic!
DC,!DE,!FL,!
GA,!NC,!SC,!
VA,!WV!
14.0%!
58.2%!
27.8%!
12.8%!
55.6%!
31.6%!
2.9%!
19.4%!
71.4%!
6.3%!
East!North!
Central!
Il,!IN,!MI,!
OH,!WI!
9.9%!
69.2%!
20.9%!
10.3%!
66.0%!
23.7%!
6.0%!
35.4%!
51.8%!
6.8%!
West!North!
Central!
IA,!KS,!MN,!
MO,!ND,!NE,!
SD!
14.4%!
60.4%!
25.2%!
11.3%!
60.0%!
28.7%!
2.0%!
10.8%!
79.6%!
7.6%!
East!South!
Central!
AL,!KY,!MS,!
TN!
11.4%!
57.2%!
31.4%!
9.5%!
55.7%!
34.8%!
5.3%!
34.0%!
54.6%!
6.1%!
West!South!
Central!
AR,!LA,!OK,!
TX!
7.1%!
59.6%!
33.3%!
5.4%!
57.9%!
36.7%!
2.0%!
18.5%!
74.3%!
5.2%!
Mountain!
AZ,!CO,!ID,!
MT,!NM,!NV,!
UT,!WY!
17.2%!
51.5%!
31.3%!
14.7%!
50.2%!
35.1%!
3.5%!
14.0%!
76.3%!
6.2%!
Pacific!
AK,!CA,!HI,!
OR!
10.8%!
62.3%!
26.9%!
9.5%!
60.0%!
30.5%!
3.5%!
14.0%!
76.3%!
6.2%!
USA!
All!50!States!
11.2%!
63.4%!
25.4%!
10.7%!
60.6%!
28.7%!
4.5%!
22.2%!
66.3%!
7.0%!
Sources: US Census Bureau, GMP Research field interviews

!!!
!!!6!
GMP$Research$Inc.$|$2999$River$Vista$Way$|$Mount$Pleasant,$SC$29466$USA|$843D884D9567$|$www.gmpresearch.com
RESEARCH METHODOLOGY
During the months of March through June 2015, GMP Research reviewed the penetration rate
of WaterSense certified products among the installed base of residential and commercial
bathroom fixtures.
According to the US Census Bureau, there are 132.8 million homes in the United States. In
addition, there are approximately 11.4 million commercial properties.
Commercial buildings include hotels, restaurants, schools, nursing homes, health care
facilities, retail/wholesale establishments, government buildings, gas stations, passenger
terminals, sport stadiums, shopping centers, office buildings, university buildings, museums,
cinemas and performing arts facilities.
GMP Research first examined the number of homes and commercial properties per US state
and then reviewed when the buildings were built.
GMP Research then examined the housing characteristics of 171,240 homes in all price
ranges in 90 metropolitan areas to determine the average number of bathrooms and plumbing
products per house.
For the commercial properties, GMP Research relied on statistical information provided by the
US Census Bureau concerning the number of employees per commercial property and used
the International Plumbing Code to approximate the number of plumbing fixtures and fittings
for each type of commercial building.
In a next step, GMP Research interviewed the manufacturers of bathroom fixtures and fittings
to determine the average life expectancy of shower heads, lavatory faucets and toilets, in
order to determine the estimated replacement cycle for the products.
Through field interviews with plumbers in all 50 states, GMP Research determined on average
the number of homes with original plumbing fixtures and fittings still installed, even though
they technically were beyond the expected life expectancy of the product.
In a final step, GMP Research reviewed when federal legislation was enacted, determining
when low flow and WaterSense products had to be installed with any new construction.
This lead to a detailed assessment of the market penetration of WaterSense certified products
installed in each of the 50 US states and cumulatively in the United States. While the study is
based on certain product life expectancy assumptions, GMP Research interviewed several of
the leading plumbing fixture and fittings manufacturers, as well as plumbers and property
managers, to get as accurate a read as possible of the type of plumbing fixtures and fittings
that are installed in the United States.
To ensure the research sample was representative of the demographics of the United States,
interviews were conducted in all 50 US states. The research sample included 60
plumbing/fitting manufacturers, 165 plumbing wholesalers or contractors, and 115 water
utilities.
!!!
!!!
C!
!"#$%&'&()*+$,-*.$/$0111$%23&)$42'5($6(7$/$"89-5$#:&('(-5;$<=$01>??$@<A/$B>CDBB>D1E?F$/$GGG.HIJ)&'&()*+.*8I
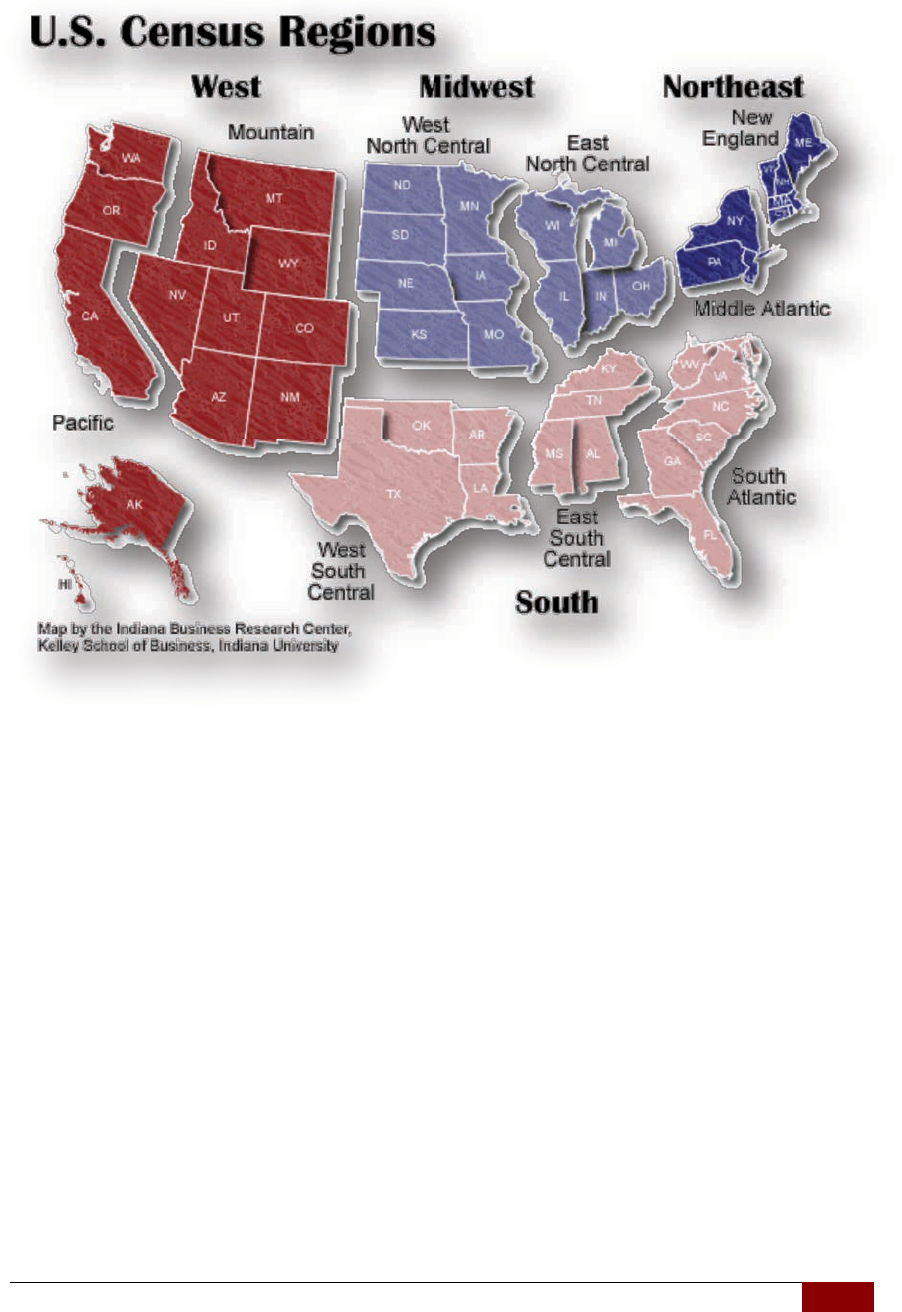
The US Census segments the country into 9 US Census regions. We followed this approach
to determine the regional market penetration of WaterSense products.

!!!
!!!
E!
!"#$%&'&()*+$,-*.$/$0111$%23&)$42'5($6(7$/$"89-5$#:&('(-5;$<=$01>??$@<A/$B>CDBB>D1E?F$/$GGG.HIJ)&'&()*+.*8I
The following map gives an overview of the research sample for this study:
Water Utility
Manufacturer
Plumbing Wholesale
Or Contractor

!!!
!!!
F!
!"#$%&'&()*+$,-*.$/$0111$%23&)$42'5($6(7$/$"89-5$#:&('(-5;$<=$01>??$@<A/$B>CDBB>D1E?F$/$GGG.HIJ)&'&()*+.*8I
As the state of California is the most affected by the current drought, GMP Research
conducted 17 interviews with regional water utilities, six manufacturers, and 11 major
plumbing wholesalers in the state of California.
In California, water utilities were contacted in Anderson, Chico, Fresno, Imperial Beach, Los
Angeles, McCloud City, Modesto, Monterey, Oceanside, Sacramento, San Diego, San
Francisco San Jose, San Luis Obispo, Santa Rosa, Ukiah, and Windsor.

!!!
!!!10!
GMP$Research$Inc.$|$2999$River$Vista$Way$|$Mount$Pleasant,$SC$29466$USA|$843D884D9567$|$www.gmpresearch.com
KEY FINDINGS
Existing Home Inventory in the United States
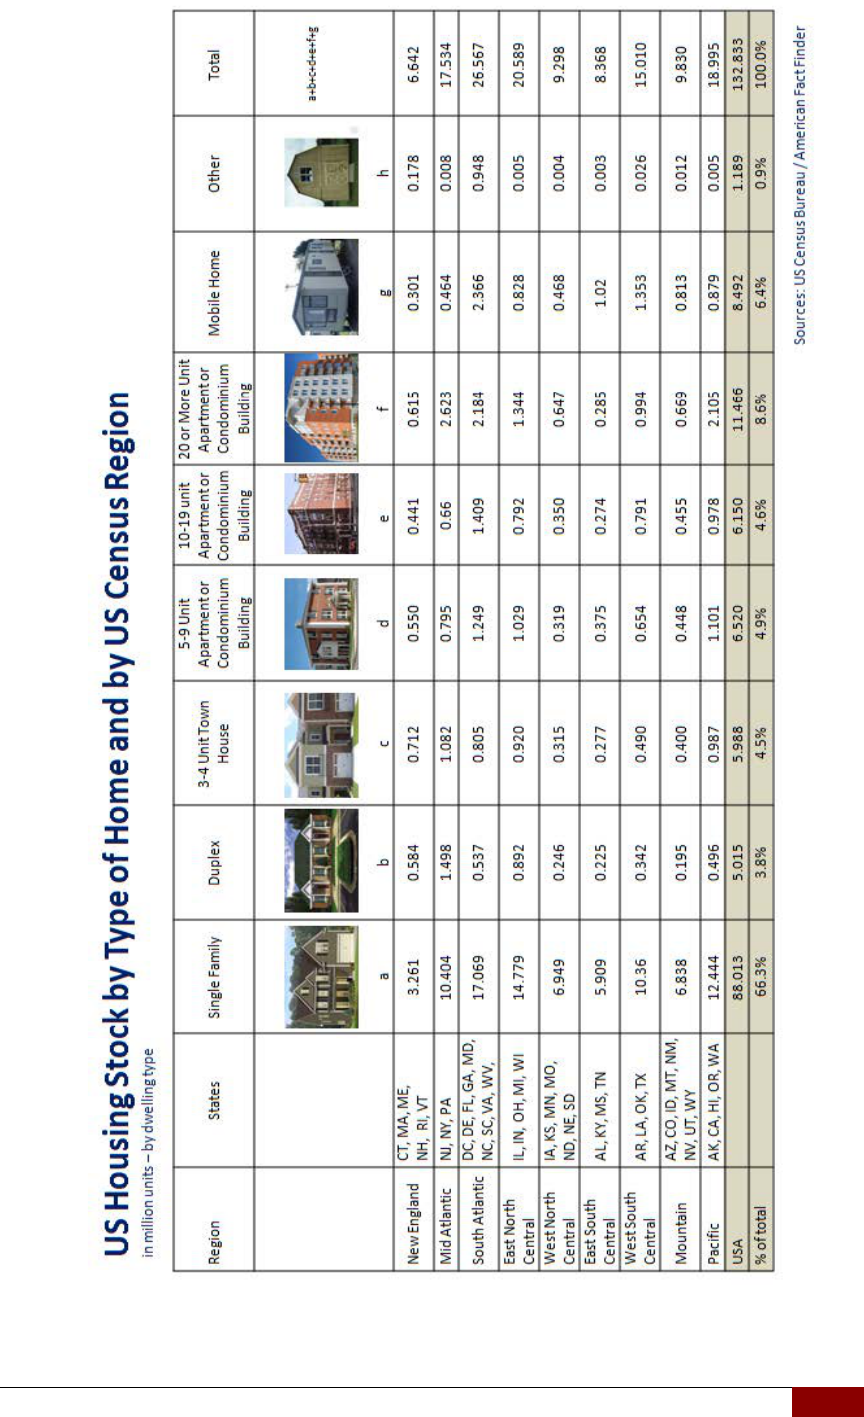
According to the US Census, there are 132.8 million existing homes in the United States.
• 66.3% are single family homes
• 3.8% are duplex homes
• 4.5% are 3-4 unit town houses
• 4.9% are 5-9 unit apartment or condominium buildings
• 4.6% are 10-19 unit apartment or condominium buildings
• 8.6% are 20 or more unit apartment or condominium buildings
• 6.4% are mobile homes
• 0.9% are classified as other types of homes
On a regional basis, we see the following:
• 5.0% of the homes are in the New England region
• 13.2% of the homes are in the Middle Atlantic region
• 20.0% of the homes are in the South Atlantic region
• 15.5% of the homes are in the East North Central region
• 7.0% of the homes are in the West North Central region
• 6.3% of the homes are in the East South Central region
• 11.3% of the homes are in the West South Central region
• 7.4% of the homes are in the Mountain region
• 14.3% of the homes are in the Pacific region
The chart on the following page gives an overview of the total housing inventory in the United
States by region and housing type.
! !
!!!
!!!11!
GMP$Research$Inc.$|$2999$River$Vista$Way$|$Mount$Pleasant,$SC$29466$USA|$843D884D9567$|$www.gmpresearch.com

!!!
!!!12!
GMP$Research$Inc.$|$2999$River$Vista$Way$|$Mount$Pleasant,$SC$29466$USA|$843D884D9567$|$www.gmpresearch.com
Number of Bedrooms and Bathrooms per House
The US Census Bureau provided insight into the number of bedrooms per home:
• 2.2% of the homes had no bedrooms
• 11.2% of the homes had one bedroom
• 26.7% of the homes had two bedrooms
• 39.7% of the homes had 3 bedrooms
• 16.0% of the homes had four bedrooms
• 4.2% of the homes had five or more bedrooms
Using this information, GMP Research reviewed a total of 171,240 homes in 90 metropolitan
areas, covering all price points, to determine the average number of bathrooms per home:
• 36.4% of the homes had one bathroom
• 12.5% of the homes had 1-1/2 bathrooms
• 33.1% of the homes had two bathrooms
• 9.0% of the homes had three bathrooms
• 5.6% of the homes had four bathrooms
• 3.4% of the homes had five or more bathrooms

!!!
!!!
7#!
!"#$%&'&()*+$,-*.$/$0111$%23&)$42'5($6(7$/$"89-5$#:&('(-5;$<=$01>??$@<A/$B>CDBB>D1E?F$/$GGG.HIJ)&'&()*+.*8I
US Housing Stock by Age of Home
The following chart gives an overview of when the existing homes in the United States were
built.
Source: US Census Bureau
1939 or
earlier
1940-49 1950-59 1960-69 1970-79 1980-89 1990-99 2000-09
2010 or
later
Total
76 years
or older
66-75
years
56-65
years
46-55
years
36-45
years
26-35
years
16-25
years
6-15
years
5 years
or less
in Millions
15.760 7.118 14.398 14.566 20.931 18.250 18.409 19.867 3.534 132.833
11.9% 5.4% 10.8% 11.0% 15.7% 13.7% 13.8% 15.0% 2.7% 100.0%

!!!
!!!
7$!
!"#$%&'&()*+$,-*.$/$0111$%23&)$42'5($6(7$/$"89-5$#:&('(-5;$<=$01>??$@<A/$B>CDBB>D1E?F$/$GGG.HIJ)&'&()*+.*8I
The following map gives an overview of the concentration of homes in the United States by
age of the home:
The table on the following page gives an overview of 30 US metropolitan areas with the
largest share of housing units built before 1940.
The table is ranked according to the percentage of homes of the local housing inventory that
were built before 1940.
< 10 years 75+ years
Source: US Census Bureau / American Community Survey 5- year estimates / 2014

!!!
!!!
7%!
!"#$%&'&()*+$,-*.$/$0111$%23&)$42'5($6(7$/$"89-5$#:&('(-5;$<=$01>??$@<A/$B>CDBB>D1E?F$/$GGG.HIJ)&'&()*+.*8I

!!!
!!!16!
GMP$Research$Inc.$|$2999$River$Vista$Way$|$Mount$Pleasant,$SC$29466$USA|$843D884D9567$|$www.gmpresearch.com
Existing Commercial Inventory in the United States
!
According to the US Census, there are 11.361 million existing commercial buildings in the
United States.
• 5,966 airports (international, large, midsize and small airports)
• 2,617 sports stadiums
• 5,053,400 office buildings
• 87,600 shopping centers
• 103,825 education and office buildings on a university campus
• 131,400 elementary and middle schools
• 37,100 public and private high schools
• 6,792 hospitals
• 56,880 nursing homes
• 495,450 other health care facilities
• 7,300 museums
• 39,600 cinemas
• 123,150 performing arts facilities
• 52,887 hotels
• 1,000,000 restaurants (full service, fast food, limited service restaurants)
• 1,624,600 retail/wholesale establishments
• 9,600 government buildings
• 43,750 gas stations
• 338,413 manufacturing facilities
• 2,140,670 commercial facilities classified as "other", which include utilities, EDP
centers, Waste treatment facilities, leisure and entertainment facilities, military
installations and penal institutes
On a regional basis, we see the following:
• 5.7% of the commercial properties are in the New England region
• 14.3% of the commercial properties are in the Middle Atlantic region
• 19.8% of the commercial properties are in the South Atlantic region
• 14.7% of the commercial properties are in the East North Central region
• 8.1% of the commercial properties are in the West North Central region
• 5.1% of the commercial properties are in the East South Central region
• 13.7% of the commercial properties are in the West South Central region
• 4.8% of the commercial properties are in the Mountain region
• 13.8% of the commercial properties are in the Pacific region

!!!
!!!
7C!
!"#$%&'&()*+$,-*.$/$0111$%23&)$42'5($6(7$/$"89-5$#:&('(-5;$<=$01>??$@<A/$B>CDBB>D1E?F$/$GGG.HIJ)&'&()*+.*8I
US Commercial Properties by Age of Property
The next chart provides an overview of when existing commercial properties in the United
States were built. According to industry market studies conducted by GMP Research,
approximately 4% of all plumbing products are sold into new commercial applications, while
6% of all plumbing products are sold as replacement products for commercial applications.
The table below gives the average age of commercial building by building type. This table
indicates which industry sectors within the commercial non-residential building market have
the greatest need for product replacements:
Source: US Census Bureau

!!!
!!!18!
GMP$Research$Inc.$|$2999$River$Vista$Way$|$Mount$Pleasant,$SC$29466$USA|$843D884D9567$|$www.gmpresearch.com
US Installed Base of Toilets, Lavatory Faucets and Shower Heads
To arrive at the market penetration rates of WaterSense products, GMP Research measured
the number of WaterSense products installed compared to the total installed base of toilets,
lavatory faucets and shower heads.
To quantify the total number of toilets, lavatory faucets and shower heads installed, GMP
Research made the following assumptions:
• According to industry market studies conducted by GMP Research, roughly 70% of
the plumbing fixtures/fittings are sold as replacement items, while roughly 20% are
sold into new residential construction and 10% are sold into commercial construction
applications
• Plumbing fixtures and fittings per home
Number!of!Bathrooms!
per!home!
1!
1!1/2!
2!
3!
4!
5!
6!
7!
Lavatory!Faucets!
per!bathroom!
1!
2!
4!
5!
6!
7!
9!
10!
Shower!Heads!per!
bathroom!
1!
1!
2!
3!
4!
5!
6!
6!
Toilets!per!bathroom!
1!
2!
2!
3!
4!
5!
6!
7!
• A shower head is replaced every 12.5 years
• All shower heads installed prior to 1992 had flow rates greater than 2.5
gallons per minute. All shower heads installed from 1992 to 2006 had flow
rates of 2.5 gallons per minute, as stipulated by the Energy Policy Act of
1992.
• According to various faucet/shower head manufacturers, approximately
98% of all shower heads installed after 2006 were WaterSense-certified
and had a flow rate of 2.0 gallons per minute.
• A lavatory faucet is replaced every 15 years
• All lavatory faucets installed prior to 1992 had flow rates in excess of 2.2
gallons per minute. All lavatory faucets installed from 1992-2006 had flow
rates of 2.2 gallons per minute as stipulated by the Energy Policy Act of
1992.
• According to various faucet manufacturers, approximately 98% of all
faucets installed after 2006 were WaterSense-certified and had a flow rate
of 1.5 gallons per minute
• A toilet is replaced every 30 years
• Research has revealed that some 60% of the homes are equipped with
toilets originally installed when the house was built. Of these toilets, 22%
will use 3.5 gallons per flush or more, while 38% will be use 1.6 gallons
per flush.
• All toilets installed prior to 1992 used 3.5 gallons or more per flush. Toilets
installed from 1992 to 2006 used 1.6 gallons per flush, as stipulated by
the Energy Policy Act of 1992. By January 1, 1994, all replacement
residential toilets installed needed to comply with the Energy Policy Act of

!!!
!!!19!
GMP$Research$Inc.$|$2999$River$Vista$Way$|$Mount$Pleasant,$SC$29466$USA|$843D884D9567$|$www.gmpresearch.com
1992. By January 1, 1997, all newly installed commercial toilets needed to
comply with the Energy Policy Act.
• WaterSense toilets were introduced in 2006. While installing WaterSense
toilets is recommended, it is not mandated. The market continues to
prefer 1.6 gallon per flush toilets over the 1.28 gallon per flush
WaterSense products as consumers are seemingly more concerned with
toilet performance than water savings and generally lack a clear
understanding of the excellent performance of WaterSense toilets.
• According to plumbing manufacturers, WaterSense toilets represent
approximately 30% of all new product sales in 2015.
The following table gives an overview of the installed shower heads, lavatory faucets and toilets
installed in the 132.8 million homes:
!
1!
1!1/2!
2!
3!
4!
5!
6!
7!
Total!
Number!of!
Bathrooms!
44.167!
20.783!
43.973!
11.955!
7.439!
0.225!
0.212!
4.079!
132.833!
Lavatory!
Faucets!
44.167!
41.566!
175.892!
59.775!
44.634!
1.575!
1.908!
40.790!
410.307!
Shower!!
Heads!
44.167!
20.783!
87.946!
35.865!
29.756!
1.125!
1.272!
24.474!
245.388!
!
Toilets!
44.167!
41.566!
87.946!
35.865!
29.756!
1.125!
1.272!
28.553!
270.250!
Source: US Census Bureau, GMP Research

!!!
!!!
"3!
!"#$%&'&()*+$,-*.$/$0111$%23&)$42'5($6(7$/$"89-5$#:&('(-5;$<=$01>??$@<A/$B>CDBB>D1E?F$/$GGG.HIJ)&'&()*+.*8I
Every year GMP Research completes a
detailed analysis of the US Kitchen/Bath
Industry by product type. To complete these
studies, GMP Research interviews all of the
major manufacturers, distributors, retailers
and contractors to learn about the market
dynamics.
These reports specify the annual volume of
toilets, lavatory faucets and shower heads
sold in the United States since 1987 to
present and highlight into which construction
applications the products were sold.
The US Census Bureau supplied detailed
information about the number of homes that
were built from 1939 to present. From this,
and from our analysis of the 171,240 homes
in all price ranges in the ninety largest
metropolitan areas, we were able to infer how
many products were sold in the time period
from 1939-1987.
Also from the US Census Bureau, GMP
Research obtained the inventory count of all
the commercial properties in the United
States. The US Bureau of Economic Analysis
provided insight into the non-residential
construction expenditures per year dating
back to 1939.
This allowed GMP Research to further fine tune its analysis of the market penetration for
WaterSense products.
In a next step, GMP Research considered the "normal" replacement cycle for the products.
The replacement demand has a direct correlation to when the products were installed. A
residential shower head will typically be replaced every 12.5 years. A lavatory faucet is
replaced every 15 years and a toilet is replaced on average every 30 years.
The time of replacement is important, because it will, to a large extent, determine the market
penetration of WaterSense products, which came on to the market after 2006.
2015 US Kitchen and Bath Industry Report
Source: GMP Research Inc.

!!!
!!!
"7!
!"#$%&'&()*+$,-*.$/$0111$%23&)$42'5($6(7$/$"89-5$#:&('(-5;$<=$01>??$@<A/$B>CDBB>D1E?F$/$GGG.HIJ)&'&()*+.*8I
This Old House
Let's consider a house that was built in 1939. By 2014, let’s assume this house will have
experienced several upgrades or had plumbing products replaced.
By 2014, the shower heads will have been
replaced at least five times.
The first replacement would have occurred
around 1951, roughly 12.5 years after the
initial shower head was installed.
The second shower head replacement would
have been around 1964, 12.5 years after the
second shower head had been installed.
The third replacement would have been in 1976.
The fourth replacement would have been in 1988.
The fifth replacement would have been in 2001.
Based on the time frame when new technology was introduced, assume the original shower
head and the first three replacement units were designed around old technology and were
using more than 2.5 gallons per minute.
In the case of our 1939 house, the last water guzzling shower head was replaced in 1989 -
three years before the enactment of the Energy Act of 1992, which stipulated shower head
had to a maximum of 2.5 gallons per minute. This shower head reached its theoretical "end-of-
life" at around 2001 and, if replaced, was replaced with an Energy Act shower head that only
used 2.5 gallons per minute.
In 2006 WaterSense products were introduced. The most current shower head in the 1939
house was replaced in 2001 - five years before the introduction of WaterSense products. Let’s
assume the shower head will be replaced at the end of its technical life span of 12.5 years –
within the 2013-2014 time frame. As 98% of the shower heads currently being manufactured
are WaterSense products, assume the shower head was replaced with a WaterSense product.
Source: www.realtor.com

!!!
!!!22!
GMP$Research$Inc.$|$2999$River$Vista$Way$|$Mount$Pleasant,$SC$29466$USA|$843D884D9567$|$www.gmpresearch.com
There are similar replacement scenarios for lavatory faucets and toilets.
According to plumbing manufacturers, lavatory faucets are replaced on average every 15
years. In the case of our 1939 house, by 2014, the lavatory faucets will have probably been
replaced four times. The first replacement would have occurred around 1954. The second
replacement would have taken place around 1969. The third replacement would have been
around 1984. The fourth replacement would have occurred in the 1999-2000 time frame.
The current lavatory faucets would have been installed during the time frame when 2.2 gallons
per minute water usage was mandated. These faucets are due to be replaced in 2015.
According to various faucet manufacturers, 98% of the current faucet production is
WaterSense products. Assume the current lavatory faucets installed in our 1939 house will be
replaced with WaterSense lavatory faucets.
For toilets, manufacturers are suggesting an average life span of 30 years.
In our 1939 house example, this would mean the toilets probably have been replaced twice.
The first replacement would have occurred around 1969, while the subsequent replacement
would have taken place around 1999-2000.
Based on the available technology at the time, assume the original toilet consumed 5.0 gallons
per flush. In 1969, those toilets were probably replaced with toilets that used 3.5 gallons per
flush.
In the next wave of replacements, in 1999 or 2000, the 3.5 gallon per flush toilets were
replaced with 1.6 gallon per flush toilets, as specified by the Energy Act of 1992.
By 2014, these 1.6 gpf toilets were still in use. Expect the home owner to use the 1.6 gpf
toilets for the next 15 years, and to only replace them as needed, unless they receive a
financial incentive from the community or water utility to replace them earlier.
The chart on the following page is an illustration of the theoretical replacement cycles for
shower heads, lavatory faucets and toilets. These are the theoretical replacement cycles, as
typically products are only replaced as needed.
Discussions with plumbing manufacturers and wholesale and plumbing contractors confirm
our knowledge that products are replaced when they stop working, or when the home owner
has decided to complete a home renovation project.
• Shower heads are replaced more frequently - mainly because the product
performance starts to deteriorate from daily use. The replacement products are readily
available and relatively easy for a home owner to install.
• Lavatory faucets are replaced a bit less frequently than a shower head. In the case of
faucets, replacement is usually driven by design rather than functionality. The
replacement products are readily available. The installation is, however, a bit more
difficult. Some home owners choose to do the product swap out themselves, while
others rely on the plumber. Faucets are usually replaced when a bathroom is either
getting a face lift, or when it is totally being remodeled.
• Toilets are replaced infrequently. Usually they are replaced only if the product
becomes defective, or it is replaced in the case of a bathroom remodel. While
replacement products are readily available, most home owners choose to have a
plumber or handyman install the products.

!!!
!!!
"#!
!"#$%&'&()*+$,-*.$/$0111$%23&)$42'5($6(7$/$"89-5$#:&('(-5;$<=$01>??$@<A/$B>CDBB>D1E?F$/$GGG.HIJ)&'&()*+.*8I
.
By 2014, a home owner of a house built in 1939, will have experienced five replacement cycles for their shower head based on the life expectancy
of the product. They would have experienced four replacement cycles for the lavatory faucets and two replacement cycles for the toilet.
Source: GMP Research Inc.

!!!
!!!24!
GMP$Research$Inc.$|$2999$River$Vista$Way$|$Mount$Pleasant,$SC$29466$USA|$843D884D9567$|$www.gmpresearch.com
What Does This Imply?
According to the annual GMP Research Kitchen and Bath Industry Analysis, roughly 20% of
the kitchen/bath products are sold into new residential construction, 10% are sold into
commercial construction and 70% of the products are sold into the replacement market.
As illustrated in the example of our 1939 built house, the vast majority of the US housing
inventory is entering into a product replacement phase for shower heads and lavatory faucets.
When home owners replace products, they will likely select WaterSense products, resulting in
significant future water savings.
In the case of toilets, the majority of existing homes in the United States have replaced their
older toilets with 1.6 gpf toilets. There is, however, a considerable time lag expected before
these 1.6 gpf toilets will be replaced with WaterSense products, which save roughly 20% more
water than products meeting the higher federal standards.
Unless financial incentives are offered to home and business owners to replace their existing
toilets with WaterSense products, we will continue to see WaterSense toilets having a low
market penetration for years.
• Shower Heads
According to the research, there are 245.4 million shower heads installed in the US
homes. During 2007-2014, our annual industry analysis indicates some 71.862 million
shower heads were sold, of which 24% were sold into new residential construction
and 76% were sold as replacements.
Based on inputs from the manufacturers, 98% of these 71.862 million shower heads
sold were WaterSense products. This indicates the total amount of WaterSense
shower heads was 70.4 million units.
Based on our assumptions of installation, there are 148.7 million shower heads that
operate with a 2.5 gallon per minute flow rate and 26.2 million installed shower heads
that are operating with a flow rate greater than 2.5 gallons per minute.
• Lavatory Faucets
According to the research, there are 410.3 million lavatory faucets installed in the US
homes. During 2007-2014 a total of 106.343 million lavatory faucets were sold, of
which 23.8% were sold into new construction and 76.2% were sold as replacement.
98% of these faucets were WaterSense lavatory faucets (104.2 million lavatory
faucets).
Based on our installation assumptions there are 260.2 million faucets installed with a
flow rate of 2.2 gallons per minute, and 45.913 million lavatory faucets with a flow rate
greater than 2.2 gallons per minute.

!!!
!!!25!
GMP$Research$Inc.$|$2999$River$Vista$Way$|$Mount$Pleasant,$SC$29466$USA|$843D884D9567$|$www.gmpresearch.com
• Toilets
According to the research, there are 270.3 million toilets installed in US homes.
In addition, there are approximately 12.5 million residential toilets installed in the
various light commercial applications (office buildings, hotel rooms, restaurants,
nursing homes, retail/wholesale establishments, government buildings, gas stations
and manufacturing).
The total amount of residential toilets installed is therefore:
270.3 million residential toilets installed in homes
+ 12.5 million residential toilets installed in light commercial applications
282.8 million residential toilets installed
During 2007-2014, a total of 19.842 million WaterSense toilets have been sold.
Based on our assumptions of installation, there are 75.6 million toilets installed that
require 3.5 gallons or more per flush and 187.3 million toilets which require 1.6 gallons
per flush.
Not included in this calculation are the commercial toilets that require a flush valve.
(Commercial spud bowls). These toilets are typically found in high traffic areas, such
as airports, bus terminals, leisure and entertainment venues, health care facilities, and
other commercial buildings. According to our field research, we believe an additional
45.6 million commercial spud-bowl toilets are installed throughout the United States.
On page 33 of this report, there is a table showing the types of toilets installed in the
residential, light commercial and commercial applications.

!!!
!!!26!
GMP$Research$Inc.$|$2999$River$Vista$Way$|$Mount$Pleasant,$SC$29466$USA|$843D884D9567$|$www.gmpresearch.com
Market Penetration for Shower Heads, Lavatory Faucets
And Toilets
On a national level, we see the following market penetration of WaterSense
products:
Shower Heads
Installed Base
In Million Units
% of Installed Base
> 2.5 gallons per minute
26.2
10.7%
2.5 gallons per minute
148.7
60.6%
2.0 gallons per minute
70.4
28.7%
Total
245.3
100.0%
Lavatory Faucets
Installed Base
In Million Units
% of Installed Base
> 2.2 gallons per minute
45.9
11.2%
2.2 gallons per minute
260.2
63.4%
1.5 gallons per minute
104.2
25.4%
Total
410.3
100.0%
Residential Toilets
Installed Base
In Million Units
% of Installed Base
3.5 gallons per flush or more
75.6
26.7%
1.6 gallons per flush
187.3
66.3%
1.28 gallons per flush or less
19.8
7.0%
Total
282.7
100.0%
Source: GMP Research field interviews with plumbing manufacturers, wholesalers, contractors and water utilities
March-June 2015

!!!
!!!27!
GMP$Research$Inc.$|$2999$River$Vista$Way$|$Mount$Pleasant,$SC$29466$USA|$843D884D9567$|$www.gmpresearch.com
Within the toilet category, we need to further examine the products by the flushing technology
used within the toilet:
Total installed residential toilets in the United States
Gallons Per Flush
Residential Toilets
% of Total US Residential
Toilets
Prior to Energy Policy
Act of 1992
5.0 gpf
12,778,050
4.5%
3.5 gpf
62,870,445
22.2%
Energy Policy
Act of 1992
1.6 gpf
169,835,550
60.1%
1.6 gpf pressure assist
17,434,775
6.2%
1.28 gpf
10,525,820
3.7%
1.28 gpf pressure assist
3,994,690
1.4%
Dual Flush 1.6 / 1.28 gpf
5,323,665
1.9%
Total Residential Toilets
282,762,995
100.0%
Source: GMP Research field interviews with plumbing manufacturers, wholesalers, contractors and water utilities
March-June 2015
Residential toilets have undergone significant technological advancements. With the
introduction of the Energy Policy Act of 1992, toilets were redesigned to flush with 1.6 gallons
per flush. Since 1992, toilet manufacturers have invested significantly to improve the
effectiveness of toilets. New technology, advanced fluid dynamic modeling and modern
manufacturing enable manufacturers to significantly boost performance of toilets without
increasing water usage.
To meet the WaterSense requirements established in 2006, toilets must consume 20% less
water while performing at the same level or higher as products meeting the 1992 Energy
Policy Act. This means toilets are only allowed to use a maximum of 1.28 gallons per flush.

!!!
!!!28!
GMP$Research$Inc.$|$2999$River$Vista$Way$|$Mount$Pleasant,$SC$29466$USA|$843D884D9567$|$www.gmpresearch.com
Regional Market Penetration of WaterSense Products
The following pages give detailed information concerning the market penetration of
WaterSense lavatory faucets shower heads and toilets per US Census region and within the
region per US State.
The regional market penetration information for the WaterSense toilets is listed subsequently.
In addition to the regional market penetration, there is an overview of where residential and
commercial toilets are installed.
The applications chart shows where market replacement action needs to be effectively
implemented to gain the biggest overall water savings.
!!!
!!!
"F!
!"#$%&'&()*+$,-*.$/$0111$%23&)$42'5($6(7$/$"89-5$#:&('(-5;$<=$01>??$@<A/$B>CDBB>D1E?F$/$GGG.HIJ)&'&()*+.*8I
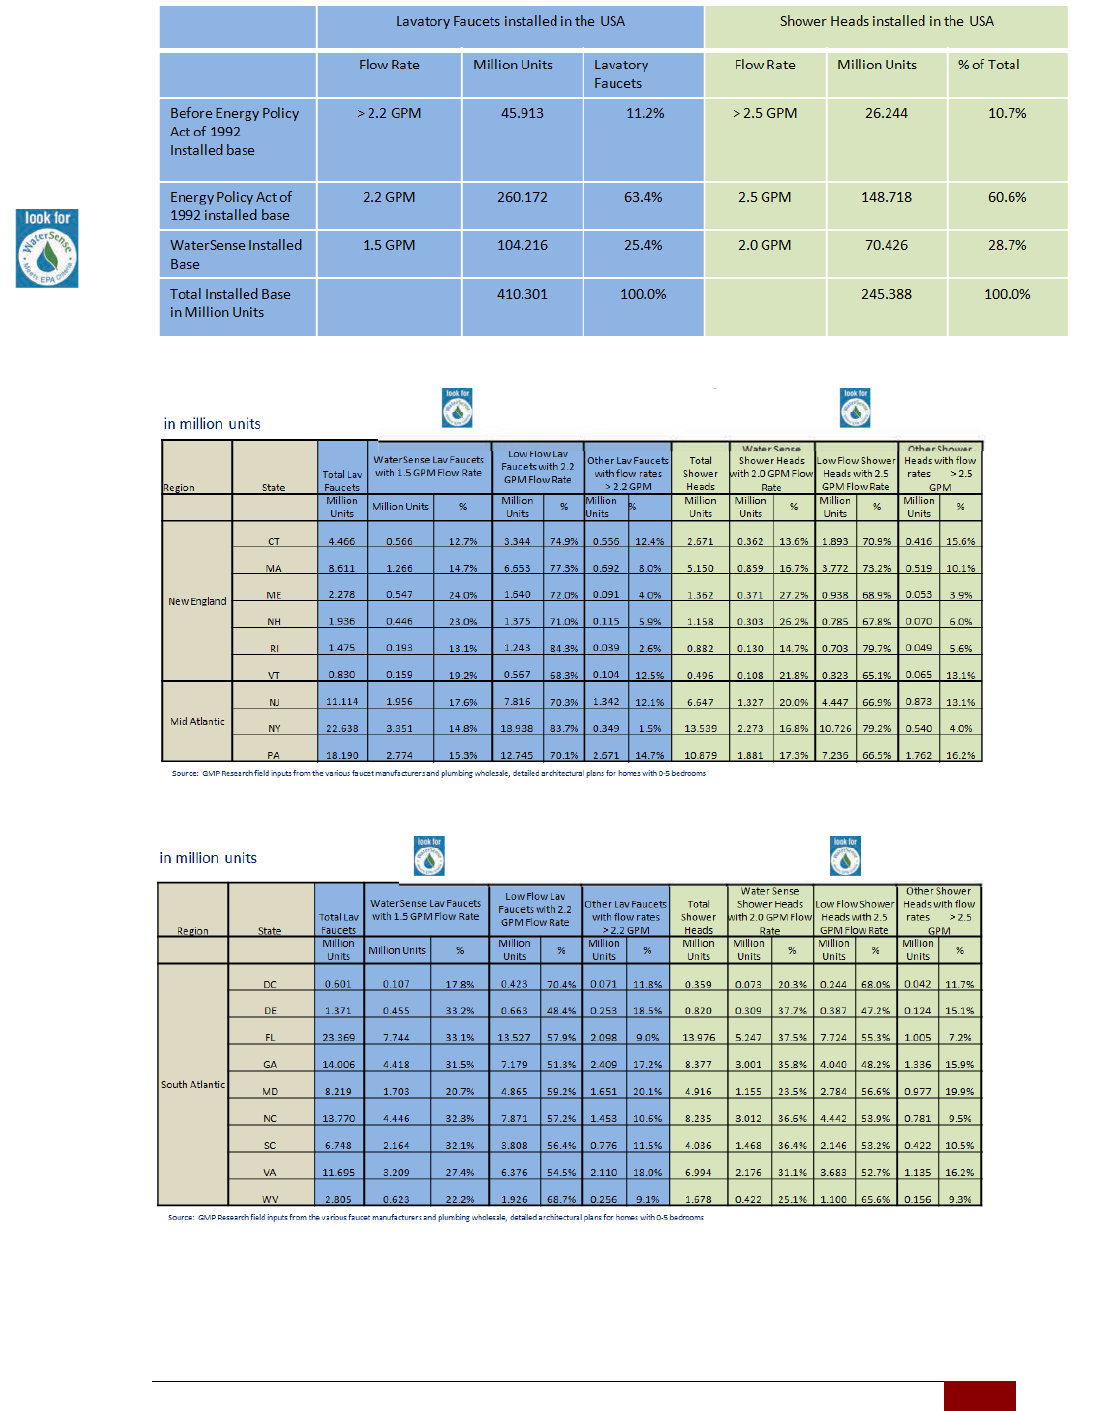
National Market Penetration Rates for WaterSense Lavatory Faucets and Shower Heads
Regional Market Penetration Rates for WaterSense Lavatory Faucets and Shower Heads
!
!
12"!
!
!
!
!
!
!
!
!
!!!!!!!!!!!!!!!!
!
!
!
!
!
!
!
!
!
!
?+:!@53>-5<!
!
!
!
!
!
(4<!"&>-5&4/!
!
!
!
!
!
!
!
!
2$%&0!
"&>-5&4/!
!
!
!
Regional Market Penetration Rates for WaterSense
Lavatory Faucets and Shower Heads

!!!
!!!
#3!
!"#$%&'&()*+$,-*.$/$0111$%23&)$42'5($6(7$/$"89-5$#:&('(-5;$<=$01>??$@<A/$B>CDBB>D1E?F$/$GGG.HIJ)&'&()*+.*8I
!
!
!
!
!
@-,&!?$.&0!
A+5&.->!
!
!
!
!
!
!
B+,&!?$.&0!
A+5&.->!
!
!
!
!
!
!
!
!
!
!
!
@-,&!2$%&0!
A+5&.->!
!
!
!
!
B+,&!2$%&0!
A+5&.->!
!
!
!
!
!
!
!
!
!
!
!
!
!
!
!
!"#$%&'&()*+$,-*.
!
!
!
!
!
!
($%5&-45!
!
!
!
!
!
!
!
!
!
!
!
!
!

!!!
!!!
#7!
!"#$%&'&()*+$,-*.$/$0111$%23&)$42'5($6(7$/$"89-5$#:&('(-5;$<=$01>??$@<A/$B>CDBB>D1E?F$/$GGG.HIJ)&'&()*+.*8I

!!!
!!!
#"!
!"#$%&'&()*+$,-*.$/$0111$%23&)$42'5($6(7$/$"89-5$#:&('(-5;$<=$01>??$@<A/$B>CDBB>D1E?F$/$GGG.HIJ)&'&()*+.*8I
Regional Market Penetration of WaterSense Toilets
USA
!!
>)\!
=24L(2]!
/^]]L)!
<'L(2'^[!
&UR'W!<'L(2'^[!
=(*'!
>U1'W!
9)2'1(L!
0)*'!>U1'W!
9)2'1(L!
=(*'!
&UR'W!
9)2'1(L!
0)*'!&UR'W!
9)2'1(L!
/UR2'(^2!
.([^6^[!
Q&!
<Y)1(4)!
&'(')*!
9:;!/<;!
/=;!>?;!@A;!
B:!
>G;!>H;!
.<
!
I9;!I=;!JK;!
-<;!/I;!>9;!
&9;!B<;!0B!
AL;!A>;!/A;!
M?;!0A!
A<;!N&;!/>;!
/M;!>I;!
>=;!&I!
<K;!NH;!
/&;!:>!
<@;!K<!;MN;!
:O
!
<P;!9M;!AI;!/:;!
>/;!>B;!Q:;!
0H!
<N;!9<;!
?A;!M@;!
0<!
&'(')*
!
%,3!456!
%,3D!
%,%D!
",FD!
8,3D!
",3D!
%,#D!
",3D!
#,%D!
8,%D!
$,%D!
#,%!456!
"3,3D!
"7,FD!
7F,$D!
#%,$D!
73,ED!
#$,3D!
7E,%D!
7$,3D!
"%,ED!
"","D!
7,8!456!
-1(Y^'Z!
8",$!
%%,8D!
88,3D!
$$,8D!
C7,8D!
$F,8D!
8E,#D!
C3,3D!
%%,3D!
83,7D!
7,8!456!
.1)**R1)!
<**^*'!
%,7D!
C,3D!
%,$D!
C,"D!
E,3D!
8,3D!
8,3D!
8,#D!
C,3D!
8,"D!
7,"E!456!
-1(Y^'Z!
$,%D!
%,"D!
#,3D!
",FD!
#,7D!
",FD!
",%D!
$,"D!
",ED!
#,CD!
7,"E!456!
.1)**R1)!
<**^*'!
7,3D!
",3D!
3,CD!
7,7D!
",%D!
7,"D!
7,CD!
7,3D!
7,$D!
7,$D!
IR(L!JLR*W!
",3D!
",ED!
",8D!
",ED!
",3D!
7,3D!
7,3D!
7,3D!
7,%D!
7,FD!
!:U'(L!Q&<!!
733,3D!
733,3D!
733,3D!
733,3D!
733,3D!
733,3D!
733,3D!
733,3D!
733D!
733,3D!

!!!
!!!
##!
!"#$%&'&()*+$,-*.$/$0111$%23&)$42'5($6(7$/$"89-5$#:&('(-5;$<=$01>??$@<A/$B>CDBB>D1E?F$/$GGG.HIJ)&'&()*+.*8I

!!!
!!!34!
GMP$Research$Inc.$|$2999$River$Vista$Way$|$Mount$Pleasant,$SC$29466$USA|$843D884D9567$|$www.gmpresearch.com
CONCLUSIONS
In the case of WaterSense shower heads and lavatory faucets, we believe the best course of
action is to continue to educate the consumer on the benefits of the WaterSense products.
WaterSense shower heads and lavatory faucets have achieved a healthy market penetration
in a relatively short time period. In addition, a large number of homes are entering the next
replacement cycle for shower heads and lavatory faucets. Home owners will be replacing their
current shower heads and lavatory faucets with WaterSense labeled products, which will
significantly increase the installed base for WaterSense shower heads and lavatory faucets.
In the case of WaterSense toilets, we believe significantly more work is needed for the
products to gain comparable acceptance in the market place to the shower heads and lavatory
faucets.
While manufacturers have invested heavily in the development of new products that feature
superior performance, these products have not gained widespread acceptance with the end
consumer.
We believe this is, in part, due to the 30 year replacement cycle for toilets. But we also believe
the end consumer does not understand the advantages of the new WaterSense toilets.
We believe communities and utilities need to create financial incentives, which are geared at
getting the home or the business owner to replace the 1.6 gpf toilets, or even the remaining
3.5 gpf toilets, with WaterSense certified 1.28 gpf toilets.
In conclusion, we believe:
• The market dynamics are working in favor of the WaterSense products. Houses that
were constructed in the most recent building boom are approaching the time frame
when shower heads and lavatory faucets are replaced. As 98% of the current products
being manufactured are WaterSense certified, it is clear that, as the replacement cycle
sets in, the current inefficient products will be replaced by WaterSense products, thus
continuing to increase the installed base significantly.
• Concerning WaterSense toilets, more effective education of the end-consumer is
needed. While manufacturers and industry advocates have spent significantly on
advertising and public relations, the end-consumer simply is not aware, or is unwilling
to recognize, the advantages of WaterSense toilets.
• We believe government officials and regulators are not sufficiently aware of the
technological advancements that have taken place and the effect this has had on
water conservation. We believe the industry needs to proactively communicate these
technological advances with live flushing performances to augment the true water
savings these products can achieve.
• We believe communities and water utilities need to invest in creating financial
incentives, which will motivate home and business owners to swap out their existing
water guzzling toilets with WaterSense products. We believe this will be the best and
quickest tool to boost the market penetration of WaterSense products.
• We believe manufacturers should continue to invest in water saving technology and
product advancements, but we need to understand that this is part of a long term
strategy to reduce overall water consumption. New plumbing products and new
plumbing technology take a very long time before they are accepted by the general
public.
Product innovations are key to any industry. They are fundamental for the plumbing industry.
Mount Pleasant, July 2015
GMP Research Inc.

!!!
!!!35!
GMP$Research$Inc.$|$2999$River$Vista$Way$|$Mount$Pleasant,$SC$29466$USA|$843D884D9567$|$www.gmpresearch.com
FINAL THOUGHTS
This report examines the market penetration of WaterSense shower heads, lavatory faucets
and toilets, as was commissioned by the Plumbing Manufacturers International.
For more details and market insight, please contact Victor Post, Vice President and Managing
Partner of GMP Research Inc. directly.
GMP Research Inc.
2999 River Vista Way
Mount Pleasant, SC 29466
Tel. 843-884-9567
email: [email protected]
