
California Employer Health Benefits:
Are Workers Covered?
CALIFORNIA
Health Care Almanac
AUGUST 2021

CALIFORNIA HEALTH CARE FOUNDATION 2
Between 2000 and 2020, the percentage of employers offering health benefits declined in California
from 69% to 60%. Workers are shouldering more of the cost for their health benefits, paying both a
larger share of premiums and higher deductibles and copays. The prevalance of plans with deductibles
over $1,000 increased from 6% in 2006 to 54% in 2020, largely due to enrollment shifts into different
plan types.
California Employer Health Benefits: Are Workers Covered? presents data compiled from the 2020 California
Employer Health Benefits Survey.
KEY FINDINGS FROM THE 2020 SURVEY:
• Forty-five percent of Californians pay more than 25% of the premium for single coverage, compared to 21%
of workers nationally.
• The average monthly health insurance premium in California, including the employer contribution, was
$653 for single coverage and $1,717 for family coverage.
• Seventy-two percent of workers in small firms (3 to 199 workers) faced an annual deductible of at least
$1,000 for single coverage, compared to 48% of workers in larger firms.
• About one in eight firms (13%) that employ many workers with lower wages (those earning $25,000 or less)
offered health coverage to employees in 2020.
• In the past year, 14% of California firms reported that they increased cost sharing for their workers.
• Twenty-four percent of California firms stated they are “very likely” to increase the amount workers pay for
premiums in 2022.
California Employer Health Benefits
CONTENTS
Overview ..................................... 3
Coverage ..................................... 4
Cost of Health Insurance ......................13
Benefits and Cost Sharing .......................21
Employer Views and Practices . . . . . . . . . . . . . . . . . . . .35
Methods .....................................40
Executive Summary
Executive Summary
Note: See the current and past editions of California Employer Health Benefits at www.chcf.org/collection/california-employer-health-benefits-almanac.

CALIFORNIA HEALTH CARE FOUNDATION 3
1%<1%
US
CA
US
CA
US
CA
■
3–9
■
10–49
■
50–199
■
200–999
■
1,000+
Employers*
Workers
Covered Workers
9% 18% 14% 12% 46%
7% 16% 13% 14% 49%
4%
11% 14% 16% 56%
61% 31% 6%
59% 33% 6%
1%2%
4%
12% 16% 13% 54%
Overview
California Employer Health Benefits
Employers, Workers, and Covered Workers, by Firm Size
California vs. United States, 2020
In 2020, California firms with 3 to
49 workers accounted for 92% of
all employers, but just 27% of all
workers, and 16% of workers with
health coverage, similar to national
firms.
NUMBER OF WORKERS
* Estimates are statistically different between California and US.
Note: Segments may not total 100% due to rounding.
Sources: California Employer Health Benefits Survey (2020), CHCF/NORC; and author analysis of Employer Health Benefits Survey public use file (2020), KFF.

CALIFORNIA HEALTH CARE FOUNDATION 4
60%
56%
202020192018201720162015201420132012201120102009200820072006200520042003200220012000
56%
60%
58%
61%
63%*
73%
70%
71%71%
67%
67%
70%
71%
61%
53%
57% 57%
56%
57%
55%
57%
60%*
69%*
59%
63%
59%
61%
60%
63%
66%66%
68%
55%
57%
60%
69%*
70%
69%
68%
California United States
Coverage
California Employer Health Benefits
Employers Offering Health Benefits
California vs. the United States, 2000 to 2020
The percentage of California
employers offering health insurance in
2020 (60%) was similar to the overall
US rate of 56%. The offer rate among
California firms has been fairly stable
since 2012.
* Estimates are statistically different from the previous year shown.
Note: The survey was not conducted in California in 2019.
Sources: California Employer Health Benefits Survey (2007–18 and 2020), CHCF/NORC; California Employer Health Benefits Survey (2005–6), CHCF/HSC; California Employer Health
Benefits Survey (2004), CHCF/HRET; California Employer Health Benefits Survey (2000–3), Kaiser/HRET; Employer Health Benefits Survey (2018–20), KFF; and Employer Health Benefits
Survey (2000–17), Kaiser/HRET.

CALIFORNIA HEALTH CARE FOUNDATION 5
No Union Workers
At Least Some Union Workers
Fewer Part-Time Workers*
Many Part-Time Workers*
Fewer Workers with Lower Wages*
Many Workers with Lower Wages*
All Firms
60%
64%
31%
66%
58%
92%
13%
Coverage
California Employer Health Benefits
Employers Offering Health Benefits, by Firm Characteristics
California, 2020
Whether a firm offers health insurance
coverage to its employees varies
widely by firm characteristics. Firms
that employ many workers with
lower wages or part-time workers
were much less likely to offer health
insurance than those that employ
fewer of these workers. Most
companies with union workers (92%)
offered coverage.
* Estimate is statistically different from all other firms.
Notes: Many workers with lower wages firms are those with 35% or more of workers earning $25,000 or less per year. Fewer workers with lower wages firms are those with less than 35% of
workers earning that amount. Many part-time workers is defined as 35% or more of the workforce working part time. Fewer part-time workers is the inverse.
Source: California Employer Health Benefits Survey (2020), CHCF/NORC.

CALIFORNIA HEALTH CARE FOUNDATION 6
1,000+200 to 99950 to 199*10 to 493 to 9All Firm Sizes
■
California
■
United States
Number of Workers
60%
56%
52%
48%
63%
61%
98%
92%
100%
99%
100%
99%
Coverage
California Employer Health Benefits
Employers Offering Health Benefits, by Firm Size
California vs. United States, 2020
About half (52%) of California’s
smallest firms (three to nine workers)
offered coverage in 2020, while the
vast majority of larger firms did so.
Offer rates for California employers
were similar to national figures.
* Estimates are statistically different between California and US.
Sources: California Employer Health Benefits Survey (2020), CHCF/NORC; and author analysis of Employer Health Benefits Survey public use dataset (2020), KFF.

CALIFORNIA HEALTH CARE FOUNDATION 7
Covered WorkersEligible Workers
83%
82%
63%
64%
■
California
■
United States
78%
75%
Eligible Workers Who…
Take Up Coverage
Coverage
California Employer Health Benefits
Employee Eligibility, Take-Up Rates, and Coverage
California vs. United States, 2020
Not all employees are eligible for
health insurance offered by their firm,
and not all who are eligible elect to
participate. Eighty-three percent of
people working in California firms
offering coverage were eligible for
health benefits in 2020. Of those
eligible, 75% elected to enroll,
resulting in a 63% coverage rate.
Note: Tests found no statistically different estimates between California and US.
Sources: California Employer Health Benefits Survey (2020), CHCF/NORC; and Employer Health Benefits Survey (2020), KFF.

CALIFORNIA HEALTH CARE FOUNDATION 8
Large Firms (200+ workers)
Small Firms (3 to 199 workers)
All Firms
65%
67%
68%
63%
63%
■
2020
■
2018
■
2016
■
2014
■
2012
63%
62%
62%
64%
66%
65%
65%
63%
62%
63%
61%
62%
62%
65%
68%
Coverage
California Employer Health Benefits
Worker Coverage Rates Among Firms Offering Health Benefits
by Firm Size, California, 2012 to 2020, Selected Years
Insurance coverage rates among
California employers offering health
benefits have been fairly stable since
2012. Large and small firms had
similar coverage rates.
Note: Tests found no statistically different estimates from previous year shown within firm size.
Source: California Employer Health Benefits Survey (2012–18 and 2020), CHCF/NORC.
CALIFORNIA HEALTH CARE FOUNDATION 9
HMO*PPOHDHP/SO*POSConventional*
■
California
■
United States
11%
62%
56%
74%
54%
26%
31%
27%
3%
<1%
Coverage
California Employer Health Benefits
Covered Worker Health Plan Options, by Type
California vs. United States, 2020
Covered workers in California were
more likely to have an HMO option
than workers nationally. Sixty-
two percent of covered workers
in California had an HMO option,
compared to only 11% of covered
workers nationally.
* Estimates are statistically different between California and US.
Notes: POS is point-of-service plan. HDHP/SO is high-deductible plan with savings option. HDHPs have a deductible of at least $1,000 for single coverage and at least $2,000 for family
coverage.
Sources: California Employer Health Benefits Survey (2020), CHCF/NORC; and Employer Health Benefits Survey (2020), KFF.

CALIFORNIA HEALTH CARE FOUNDATION 10
2020
2018
2016
2014
2012
■
Conventional
■
HMO
■
PPO
■
POS
■
HDHP/SO
California
2020
2018
2016
2014
2012
United States
<1%
<1%
10%
15%
13%
10%
5%
14%
13%
5%
8%
7%
30%
28%
31%
29%
33%
46%
45%
51%
54%
55%
<1%
<1%
<1%
<1%
1%
31%
29%
29%
20%
19%
8%
6%
9%
8%
9%
47%
49%
48%
58%
56%
13%
16%
15%
13%
16%
Coverage
California Employer Health Benefits
Enrollment of Covered Workers, by Plan Type
California vs. United States, 2012 to 2020, Selected Years
The proportion of covered workers
in HMO plans in California has fallen
from 55% in 2012 to 46% in 2020.
HMO enrollment is still dramatically
higher in California relative to the
United States as a whole.
Notes: POS is point-of-service plan. HDHP/SO is high-deductible plan with savings option. HDHPs have a deductible of at least $1,000 for single coverage and at least $2,000 for family
coverage. Segments may not add to 100% due to rounding. Conventional plan enrollment in both California and the US was 1% or less in 2012–20.
Sources: California Employer Health Benefits Survey (2012–18 and 2020), CHCF/NORC; author analysis of data from Employer Health Benefits Survey public use files (2018–20), KFF; and
Employer Health Benefits Survey public use files (2012–17), Kaiser/HRET.

CALIFORNIA HEALTH CARE FOUNDATION 11
HDHP with HSAHDHP with HRAOer High-Deductible Plan
■
All Firms
■
Small Firms
■
Large Firms
(3–199 workers) (200+ workers)
73%
72%
82%
8%
7%
17%
41%
40%
52%
Coverage
California Employer Health Benefits
Firms Offering a High-Deductible Plan, by Firm Size
California, 2020
Compared to other plan types, HDHPs
typically expose workers to higher
out-of-pocket costs. Seventy-three
percent of all California firms offered a
high-deductible health plan (HDHP)
in 2020. Of these firms, 8% offered an
HDHP with a health reimbursement
arrangement (HRA), while 41%
offered an HDHP with a health savings
account (HSA).
Notes: Tests found no significant differences between small firms and large firms. HDHPs (high-deductible health plans) have a deductible of at least $1,000 for single coverage and at
least $2,000 for family coverage. HRAs (health reimbursement arrangements) are employer-sponsored accounts that provide financial assistance for out-of-pocket health care expenses,
and HSAs (health savings accounts) allow employers or employees (and their families) to contribute to a tax-advantaged account, which can be used to help pay for IRS-approved
health care expenses.
Source: California Employer Health Benefits Survey (2020), CHCF/NORC.

CALIFORNIA HEALTH CARE FOUNDATION 12
PPOHDHP/SOPOSHMO*All Plans*
■
California
■
United States
75%
38%
43%
13%
24%
67%
11%
72%
55%
Coverage
California Employer Health Benefits
Workers in Self-Insured Plans, by Plan Type
California vs. United States, 2020
Twenty-four percent of covered
workers in California were enrolled
in a partly or completely self-insured
plan in 2020, compared with 67%
nationally. The difference between
the state and national figures is likely
associated with California’s high HMO
enrollment, since HMOs are less likely
than other plans to be self-insured.
* Estimate is statistically different between California and US.
Notes: Self-insured plans are plans for which an employer assumes some or most of the responsibility for paying health care claims rather than buying coverage from an insurer. POS is
point-of-service plan. HDHP/SO is high-deductible plan with a savings option. HDHPs have a deductible of at least $1,000 for single coverage and at least $2,000 for family coverage.
POS was not reported for US due to small sample size.
Sources: California Employer Health Benefits Survey (2020), CHCF/NORC; and Employer Health Benefits Survey (2020), KFF.

CALIFORNIA HEALTH CARE FOUNDATION 13
PPO
POS
HMO
HDHP/SO
All Plans
PPO
POS
HMO
HDHP/SO
All Plans
Single
Family
$7,838
$7,935
$8,413*
$7,053*
$6,736*
$20,602
$18,010
$24,311*
$19,676
$22,696*
Cost of Health Insurance
California Employer Health Benefits
Average Annual Premiums, by Plan Type
Single vs. Family Coverage, California, 2020
In California, average annual
premiums were $7,838 for single
coverage and $20,602 for family
coverage. Annual PPO premiums were
the highest of all plan types.
* Estimate is statistically different from all-plans figure.
Notes: POS is point-of-service plan. HDHP/SO is high-deductible plan with savings option. HDHPs have a deductible of at least $1,000 for single coverage and at least $2,000 for family
coverage.
Source: California Employer Health Benefits Survey (2020), CHCF/NORC.

CALIFORNIA HEALTH CARE FOUNDATION 14
POSHDHP/SOPPOHMOAll Plans
3.5%
3.8%
1.4%
5.2%
5.9%
Cost of Health Insurance
California Employer Health Benefits
Average Increase in Annual Premiums, by Plan Type
California, 2020
In 2020, overall premiums increased
by 3.5% from the previous year.
PPO plans experienced the smallest
increase.
Notes: Tests found no significantly different estimates between All Plans and other plan types. POS is point-of-service plan. HDHP/SO is high-deductible plan with savings option. HDHPs
have a deductible of at least $1,000 for single coverage and at least $2,000 for family coverage.
Source: California Employer Health Benefits Survey (2020), CHCF/NORC.

CALIFORNIA HEALTH CARE FOUNDATION 15
HDHP/SO
POS
PPO
HMO
All Plans
HDHP/SO
POS
PPO
HMO
All Plans
■
California
■
United States
Single Coverage
Family Coverage
$623
$653
$607
$661
$657
$701
$624
$588
$574
$561
$1,779
$1,717
$1,734
$1,501
$1,854
$2,026
$1,706
$1,640
$1,697
$1,891
Cost of Health Insurance
California Employer Health Benefits
Average Monthly Premiums, by Plan Type
California vs. United States, 2020
Overall average monthly premiums
for single and family coverage were
similar in California and nationwide.
Notes: Tests found no statistically different estimates between California and the US. POS is point-of-service plan. HDHP/SO is high-deductible plan with savings option. HDHPs have a
deductible of at least $1,000 for single coverage and at least $2,000 for family coverage.
Sources: California Employer Health Benefits Survey (2020), CHCF/NORC; and Employer Health Benefits Survey (2020), KFF.

CALIFORNIA HEALTH CARE FOUNDATION 16
202020192018201720162015201420132012*2011*201020092008*2007*20062005*2004*2003*2002*2001*2000*
$607
California United States
$661
$187
$163
Cost of Health Insurance
California Employer Health Benefits
Average Monthly HMO Premiums, Single Coverage
California vs. United States, 2000 to 2020
From 2000 to 2010, California’s
average monthly HMO premium for
single coverage stayed below that
of the US, except in 2006. In 2011, it
exceeded the national rate and has
often done so since.
* Estimates are statistically different between California and US.
Notes: Annual rate of change for HMO single premiums should not be calculated by comparing dollar values from one year with the previous year, due to both the survey’s sampling
design and the way in which plan information is collected. Rates of change in family premiums are collected directly as a question in the survey (no change data for single premiums is
collected). The survey was not conducted in California in 2019.
Sources: California Employer Health Benefits Survey (2007–18 and 2020), CHCF/NORC; California Employer Health Benefits Survey (2005–6), CHCF/HSC; California Employer Health
Benefits Survey (2004), CHCF/HRET; California Employer Health Benefits Survey (2000–3), KFF/HRET; Employer Health Benefits Survey (2018–20), KFF; and Employer Health Benefits
Survey (2000–17), Kaiser/HRET.

CALIFORNIA HEALTH CARE FOUNDATION 17
US
CA
US
CA
■
Worker
■
Employer
Single Coverage
Family Coverage
$1,950*
$6,227*$1,243*
$5,888* $7,838*
$7,470*
$6,723*
$15,754*$5,588*
$13,880* $20,602*
$21,342*
Cost of Health Insurance
California Employer Health Benefits
Annual Worker and Employer Premium Contributions
California vs. United States, 2020
California workers contributed an
average of $1,950 annually for
single coverage and $6,723 for
family coverage in 2020. Worker
contributions to single and family
premiums were higher in California
than nationally.
* Estimates are statistically different between California and US within coverage type.
Note: Segments may not add to totals due to rounding.
Sources: California Employer Health Benefits Survey (2020), CHCF/NORC; and Employer Health Benefits Survey (2020), KFF.

CALIFORNIA HEALTH CARE FOUNDATION 18
2%
1%
US
CA
US
CA
■
No Contribution
■
1%–25%
■
26%–50%
■
>50%
Single Coverage
Family Coverage
<1%
4%
7%
11%
48%
69%
43%
20%
35%
54%
45%
32%
20%
11%
Cost of Health Insurance
California Employer Health Benefits
Workers’ Share of Premium
California vs. United States, 2020
Distribution of workers' share of
premium varied between California
and the nation. Twenty percent of
California workers paid more than half
of the premium for family coverage,
compared to 11% of workers
nationwide.
Notes: Tests found no statistically different estimates between California and the US. Segments may not add to 100% due to rounding.
Sources: California Employer Health Benefits Survey (2020), CHCF/NORC; and Employer Health Benefits Survey (2020), KFF.

CALIFORNIA HEALTH CARE FOUNDATION 19
<1%
2%
Large Firms*
(200+ workers)
Small Firms*
(3–199 workers)
All Firms
Single Coverage
Large Firms*
(200+ workers)
Small Firms*
(3–199 workers)
All Firms
Family Coverage
3%
1%
7%
9% 50% 40%
50%
5%43%
48% 43%
41%41%
23%
35%
19%
23%53%
45% 20%
■
No Contribution
■
1%–25%
■
26%–50%
■
>50%
Cost of Health Insurance
California Employer Health Benefits
Workers’ Share of Premium, by Firm Size
California, 2020
Workers’ share of premium vary by
firm size for both single and family
coverage, with those in small firms
generally paying more. For family
coverage, 23% of workers in small
firms paid more than half of the
premium, compared to 19% of
workers in large firms.
* Difference is statistically different between small and large firms within coverage type.
Note: Segments may not add to 100% due to rounding.
Source: California Employer Health Benefits Survey (2020), CHCF/NORC.

CALIFORNIA HEALTH CARE FOUNDATION 20
Single Family
12%
202020192018201720162015201420132012201120102009
13%
25%
15%
27%
17%
27%
16%*
26%*
22%*
33%*
17%
26%
17%
29%
16%
26%
14%
27%
27%
33%
20%
Cost of Health Insurance
California Employer Health Benefits
Workers’ Share of Premium, Single and Family Coverage
California, 2009 to 2020
California workers paid an average of
20% of the total premium for single
coverage and 33% for family coverage
in 2020. The corresponding annual
premium contributions were $1,950
and $6,723 for single and family (not
shown).
* Estimates are significantly different from previous year shown.
Note: The survey was not conducted in 2019.
Source: California Employer Health Benefits Survey (2009–18 and 2020), CHCF/NORC.

CALIFORNIA HEALTH CARE FOUNDATION 21
1%
<1%
<1%
1%
2020
2018
2016
2014
2012
■
$5
■
$10
■
$15
■
$20
■
$25
■
$30
■
Other
<1% 2%
18%
10%
8%
13%
12%
19%
20% 33%
42%
11%
10%
39% 15%
18%
11% 20%
41% 11%
10% 13%37%
14% 10%
8%9%
13% 6%
9%
15%
Benefits and Cost Sharing
California Employer Health Benefits
Workers with Primary Care Office Visit Copayments
California, 2012 to 2020, Selected Years
About 86% of workers in California
had a copay for primary care office
visits (not shown). A copay of $20
was the most common in 2020.
PER VISIT COPAY
Notes: Tests found no significantly different estimates between years shown. Segments may not add to 100% due to rounding.
Source: California Employer Health Benefits Survey (2012–18 and 2020), CHCF/NORC.

CALIFORNIA HEALTH CARE FOUNDATION 22
2020
2018
2016
2014
2012
■
$5
■
$10
■
$15
■
$20
■
$25
■
$30
■
Other
HMO
2020
2018
2016
2014
2012
PPO
(in-network)
2020
2018
2016
2014
2012
POS
(in-network)
8%
8%
9%
9%
9%
9%
13%
10%
8%
10%
19%
15%
10%
10%
51%
30%
42%
46%
30%
21%
13%
9%
20%
24%
20%
11%
1%
5%
23%
24%
16%
11%
10%
8%
15%
9%
12%
15%
19%
14%
21%
40% 9% 8%
22%
30%
34%
37%
15%
16%
22% 11%
10%
36%
9%
7%
13%
46%
20%
17%
9%
15%
22%
26%
6%
20%
23%
18% 16%
7%
24%
12%
9%
9%
14%
17% 33%
36%15%
57%7%
<1% 1%
1%
2%
1% 2%
7%
3%
3%
4%
3%
3%
4%
Benefits and Cost Sharing
California Employer Health Benefits
Workers with Primary Care Office Visit Copayments, by Plan Type
California, 2012 to 2020, Selected Years
Distribution of copayments for
primary care office visits for workers
with HMO or PPO coverage has shifted
since 2012, with a smaller percentage
of workers having copayments of $5
or $10.
Notes: Distributions are statistically similar from previous year shown. POS is point-of-service plan. Segments may not add to 100% due to rounding.
Source: California Employer Health Benefits Survey (2012–18 and 2020), CHCF/NORC.

CALIFORNIA HEALTH CARE FOUNDATION 23
HDHP/SOPPO
†
(in-network)
POS*
†
(in-network)
HMO*
†
All Plans
■
California
■
United States
47%
83%
15%
49%
63%
76%
79%
82%
100% 100%
$1,298
$1,644
$2,436
$1,201
$1,472
$1,714
$716
$1,204
$2,602 $2,303
Benefits and Cost Sharing
California Employer Health Benefits
Workers with Annual Deductible, Single Coverage
by Plan Type, California vs. United States, 2020
In 2020, 47% of workers with single
coverage had a deductible in California
compared to 83% in the nation as a
whole. Those enrolled in HMO and
POS plans in California were less likely
to have a deductible than enrollees
nationwide.
* Percentages are significantly different between California and US.
†
Average deductibles are significantly different between California and US.
Notes: POS is point-of-service plan. HDHP/SO is high-deductible plan with savings option. HDHPs have a deductible of at least $1,000 for single coverage. Dollar figures represent
average annual deductibles.
Sources: California Employer Health Benefits Survey (2020), CHCF/NORC; and Employer Health Benefits Survey (2020), KFF.

CALIFORNIA HEALTH CARE FOUNDATION 24
202020192018201720162015201420132012201120102009200820072006
California United States
57%
10%
6%
51%
25%
51%
25%
58%
31%
55%
46%
22%
41%
20%
38%
17%
34%
14%
31%
13%
27%*
14%
22%*
12%
18%*
9%
12%*
10%
54%
Benefits and Cost Sharing
California Employer Health Benefits
Workers with a Large Deductible ($1,000+), Single Coverage
California vs. United States, 2006 to 2020
About half of California workers
with single coverage had an annual
deductible of $1,000 or more,
compared to 57% nationwide. The
share of California workers with a
large deductible increased from 6% in
2006 to 54% in 2020.
* Estimate is statistically different from previous year shown.
Note: The survey was not conducted in California in 2019.
Sources: California Employer Health Benefits Survey (2007–18 and 2020), CHCF/NORC; California Employer Health Benefits Survey (2006), CHCF/HSC; Employer Health Benefits Survey
(2018–20), KFF; and Employer Health Benefits Survey (2006–17), Kaiser/HRET.

CALIFORNIA HEALTH CARE FOUNDATION 25
202020192018201720162015201420132012201120102009200820072006
All Firms Small Firms (3–199 workers) Large Firms (200+ workers)
7%
6%
25%
43%
15%
25%
41%
17%
22%
41%
11%
20%
32%
14%
31%
49%
21%
13%
27%
5%
14%
27%
5%
12%
21%*
6%
9%
14%
5%
11%
10%
10%
14%
26%
8%
17%
32%
9%
48%
54%
72%
5%
Benefits and Cost Sharing
California Employer Health Benefits
Workers with a Large Deductible ($1,000+), Single Coverage
by Firm Size, California, 2006 to 2020
Large-deductible ($1,000+) plans
were more common among workers
in smaller firms. The percentage of
workers in both small and large firms
with large-deductible plans was
much higher in 2020 than in 2018.
* Estimate is statistically different from previous year shown same-sized firms.
Note: The survey was not conducted in 2019.
Sources: California Employer Health Benefits Survey (2007–18 and 2020), CHCF/NORC; and California Employer Health Benefits Survey (2006), CHCF/HSC.

CALIFORNIA HEALTH CARE FOUNDATION 26
1%
2%
HDHP/SO*
POS
(in-network)
PPO*
(in-network)
HMO
All Plans
■
<$500
■
$500–$999
■
$1,000–$1,999
■
$2,000+
10%
58%
28%
87%
36%
39%
47%
49%
41%
35%12%25%
9%7%
6% 6%
Benefits and Cost Sharing
California Employer Health Benefits
Deductibles for Single Coverage, by Plan Type
California, 2020
Among the 47% of California workers
who faced a deductible for single
coverage (not shown), 28% had a
deductible of $2,000 or more.
* Distribution is statistically different from All Plans.
Notes: Data based on workers with a deductible. POS is point-of-service plan. HDHP/SO is high-deductible plan with savings option. HDHPs have a deductible of at least $1,000 for
single coverage. Segments may not add to 100% due to rounding.
Source: California Employer Health Benefits Survey (2020), CHCF/NORC.

CALIFORNIA HEALTH CARE FOUNDATION 27
2020
2018
2016
2014*
2012
■
<$500
■
$500–$999
■
$1,000–$1,999
■
$2,000+
38%
28%
13%
19%29%
26%
24%
24%
16%23%
25% 12% 35%
16%19%52%
20%31%
22% 30%
Benefits and Cost Sharing
California Employer Health Benefits
Deductibles for Single Coverage
All Plans, 2012 to 2020, Selected Years
The distribution of deductible amounts
has changed since 2012. Among
workers with single coverage and a
deductible, the percentage with a
deductible of $2,000 or more doubled
between 2012 and 2020. During the
same time, the percentage of workers
with a deductible of less than $500
decreased from 52% to 25%.
* Distribution is statistically different from previous year shown.
Notes: Data based on workers with a deductible. Includes in-network use only. Segments may not add to 100% due to rounding.
Source: California Employer Health Benefits Survey (2012–18 and 2020), CHCF/NORC.

CALIFORNIA HEALTH CARE FOUNDATION 28
3%
1% 3%
HDHP/SO
POS
PPO*
HMO
All Plans
■
<$500
■
$500–$999
■
$1,000–$1,999
■
$2,000+
14%13%
8%8%
14% 25% 43%18%
70%
70%
84%
100%
26%
Benefits and Cost Sharing
California Employer Health Benefits
Deductibles for Family Coverage, by Plan Type
California, 2020
Among California workers with a
family deductible in 2020, 70% faced
a deductible of $2,000 or more.
* Distribution is statistically different from All Plans.
Notes: Data based on workers with a deductible. POS is point-of-service plan. HDHP/SO is high-deductible plan with savings option. HDHPs have a deductible of at least $2,000 for
family coverage. No test was done comparing HDHP/SO with All Plans. Segments may not add to 100% due to rounding.
Source: California Employer Health Benefits Survey (2020), CHCF/NORC.

CALIFORNIA HEALTH CARE FOUNDATION 29
4%
3%
2020
2018
2016
2014*
2012
■
<$500
■
$500–$999
■
$1,000–$1,999
■
$2,000+
58%
70%
31%
18%12%
22%8%
16%20%5%
13% 14%
15%32%23%
66%
12% 58%
Benefits and Cost Sharing
California Employer Health Benefits
Deductibles for Family Coverage
All Plans, 2012 to 2020, Selected Years
In 2020, 7 in 10 workers with an
aggregate family deductible faced a
deductible of $2,000 or more.
* Distribution is statistically different from previous year shown.
Notes: Data based on workers with an aggregate family deductible. Workers who had a separate per-person deductible were not included. Includes in-network use only. Segments
may not add to 100% due to rounding.
Source: California Employer Health Benefits Survey (2012–18 and 2020), CHCF/NORC.

CALIFORNIA HEALTH CARE FOUNDATION 30
1% 2%
■
<$1,000
■
$1,000–$1,499
■
$1,500–$1,999
■
$2,000–$2,499
■
$2,500–$2,999
■
$3,000+
■
No Limit
1%
3%
3% 3%
<1% <1%
1%
7%18%
44% 5%
14%
60%39%
11%
30%8% 5%5%
58%
32%17%
10%
8%
60%
32% 7%
4%4%
4%
4%
HDHP/SO*
POS
PPO*
HMO
All Plans
Benefits and Cost Sharing
California Employer Health Benefits
Annual Out-of-Pocket Limits, Single Coverage
by Plan Type, California, 2020
Out-of-pocket limits help limit costs
for consumers and are capped by the
Affordable Care Act. While nearly all
covered workers with single coverage
had an out-of-pocket limit, 32% had
a limit of $3,000 or more.
* Distribution is statistically different from All Plans.
Notes: POS is point-of-service plan. HDHP/SO is high-deductible plan with savings option. HDHPs have a deductible of at least $1,000 for single coverage. Segments may not add to
100% due to rounding.
Source: California Employer Health Benefits Survey (2020), CHCF/NORC.
CALIFORNIA HEALTH CARE FOUNDATION 31
3%
2%
3% 4% 4%3%
3%
3%
3% 3%
<1%
1%
■
<$2,000
■
$2,000–$2,999
■
$3,000–$3,999
■
$4,000–$4,999
■
$5,000–$5,999
■
$6,000+
■
No Limit
HDHP/SO*
POS
(in-network)
PPO*
(in-network)
HMO
All Plans
31%33%8% 6%15%
15% 8%53%
44%35% 8%
13%9% 61% 8%5%
11%9%
8%9%
82%
Benefits and Cost Sharing
California Employer Health Benefits
Annual Out-of-Pocket Limits, Family Coverage
by Plan Type, California, 2020
Only 15% of California workers with
family coverage had an annual out-
of-pocket limit of less than $2,000,
while 31% had a limit of $6,000 or
more. Six percent of covered workers
with family coverage had no out-of-
pocket limit.
* Distribution is statistically different from All Plans.
Notes: POS is point-of-service plan. HDHP/SO is high-deductible plan with savings option. HDHPs have a deductible of $2,000 or more for family coverage. Segments may not add to
100% due to rounding.
Source: California Employer Health Benefits Survey (2020), CHCF/NORC.

CALIFORNIA HEALTH CARE FOUNDATION 32
■
One Tier
■
Two Tier
■
Three Tier
■
Four Tier
■
Other
1%
2%
3%
3%
2020
2018
2016
2014
2012
2%
California
4%
4%
37% 50%
15%
22%
18% 6%
8%20%
42%
45%
43%
33%
36%
25%
29%
5%
5%
7%
37%
2020
2018
2016
2014
2012
United States
10%
10%
5%7%
5% 5%
6%6%
4%
4%
4%
4%
51%
32%
20%
14%63%
60%
52%
37%
7% 6% 35% 48%
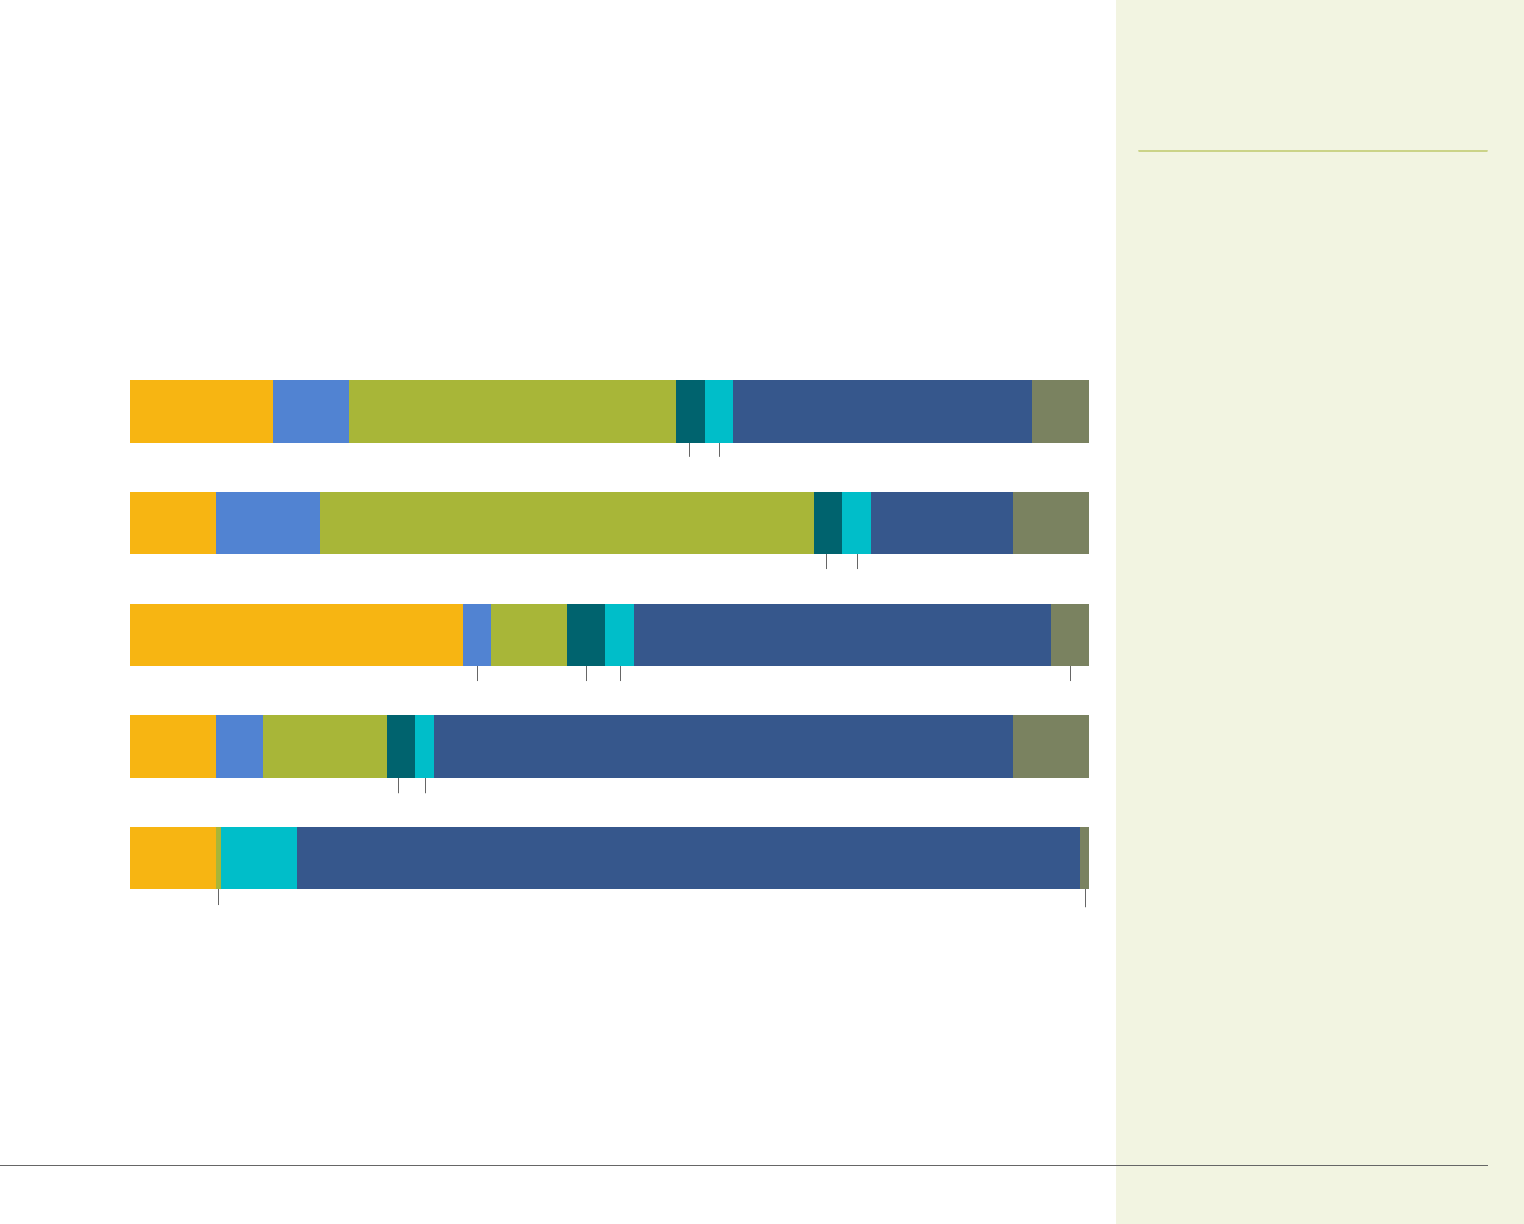
Benefits and Cost Sharing
California Employer Health Benefits
Workers' Cost Sharing for Prescription Drugs
California vs. United States, 2012 to 2020, Selected Years
In 2020, 53% of California workers
with coverage had a three- or four-tier
cost-sharing formula for prescription
drugs, compared to 83% nationally.
The share of California workers with
four tiers has increased substantially
over time, from 4% in 2012 to 20% in
2020.
Notes: Tests found no significantly different estimates between years shown. One tier is the same cost share regardless of drug type. Two tier is one payment for generic drugs and
one for brand name. Three tier is one payment for generic drugs, another for preferred drugs, and a third for nonpreferred drugs. Four tier is three-tier cost sharing plus a fourth tier for
lifestyle or other specified drugs. Other for California includes "no cost sharing" and "none of the above"; Other for US includes "other" and "no cost sharing after the deductible is met."
Preferred drugs are listed in a plan's formulary. Nonpreferred drugs are not listed in the formulary. Segments may not add to 100% due to rounding.
Sources: California Employer Health Benefits Survey (2012–18 and 2020), CHCF/NORC; author analysis of data from Employer Health Benefits Survey public use files (2018–20), KFF; and
Employer Health Benefits Survey public use files (2012–17), Kaiser/HRET.

CALIFORNIA HEALTH CARE FOUNDATION 33
Nonpreferred Drugs
Preferred Drugs
Generic Drugs
■
2012
■
2014
■
2016
■
2018
■
2020
$9.79
$12.11
$11.93
$10.64
$9.91
$25.80
$30.82
$32.05
$29.01
$29.73
$47.62
$45.67
$52.79
$47.94
$53.36
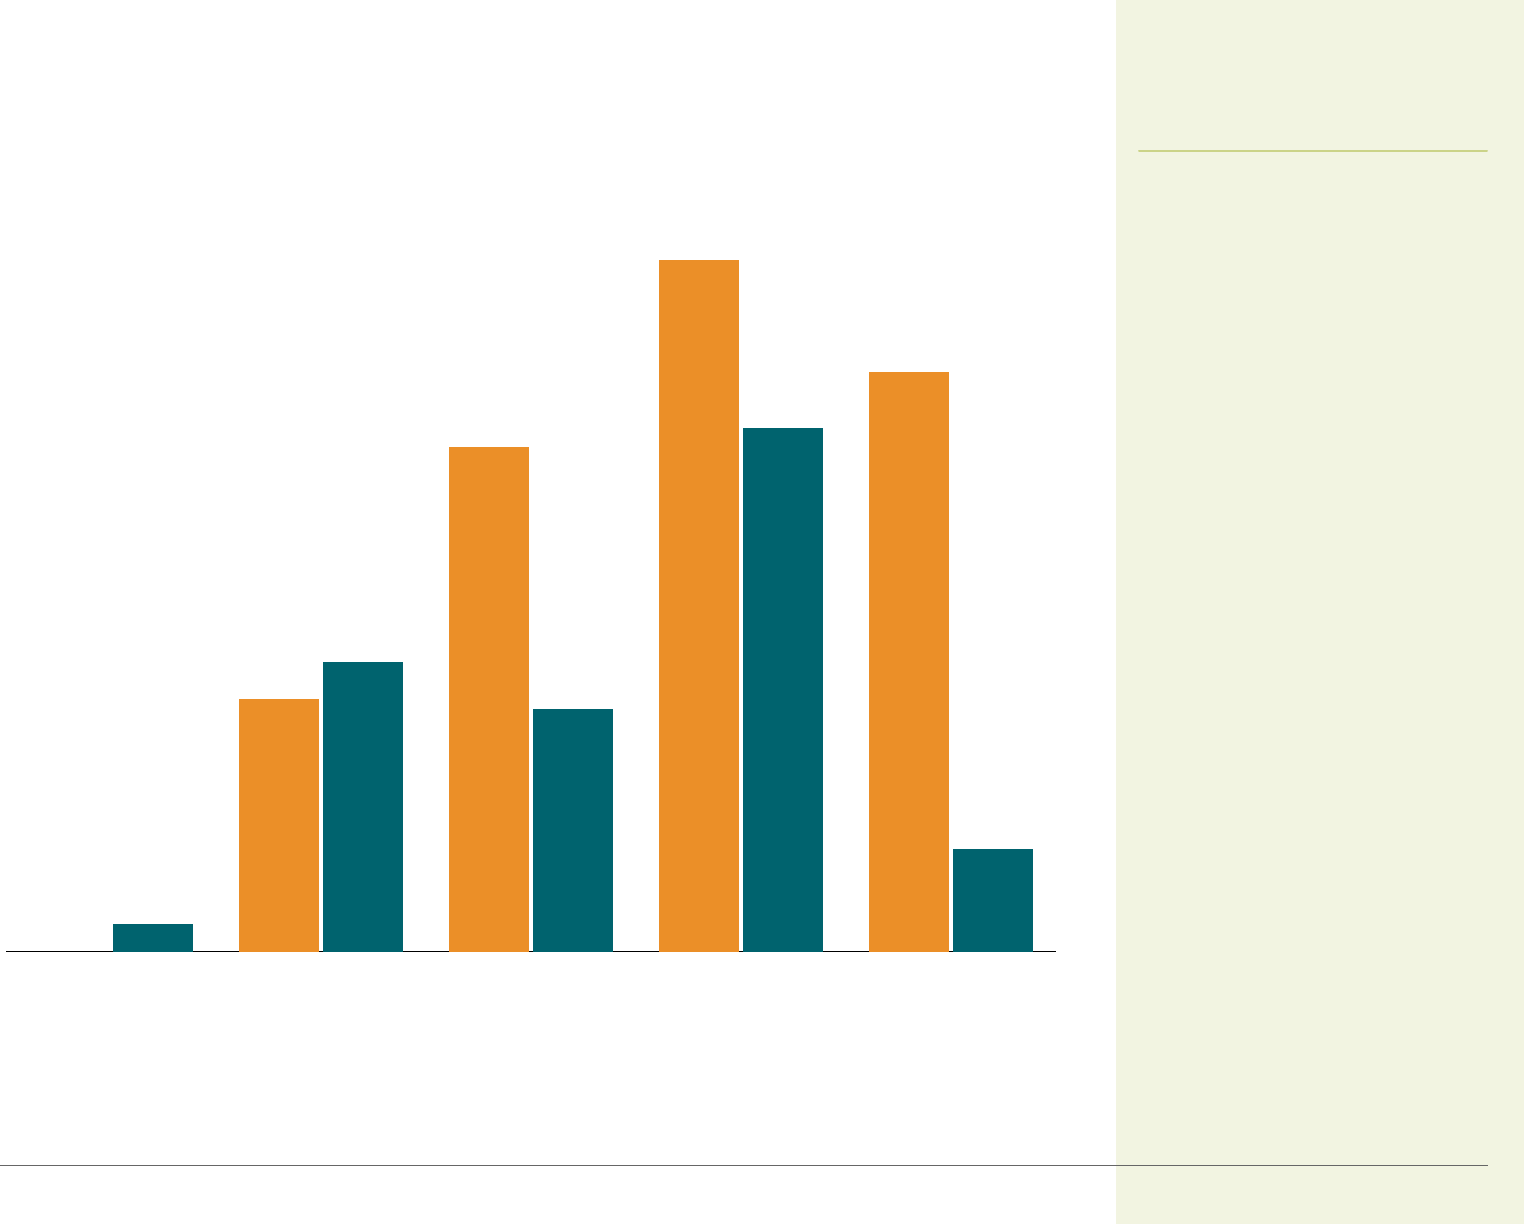
Benefits and Cost Sharing
California Employer Health Benefits
Average Prescription Drug Copayments, by Drug Type
California, 2012 to 2020, Selected Years
Among firms with four or more tiers
of prescription cost sharing, average
copayments for generic drugs were a
third of what they were for preferred
drugs, and a fifth of what they were
for nonpreferred drugs.
Notes: Tests found no significantly different estimates between years shown. Data are shown for firms with four or more tiers. Preferred drugs are listed in a plan's formulary. Nonpreferred
drugs are not listed in the formulary. Fourth-tier data are not shown due to small sample sizes.
Source: California Employer Health Benefits Survey (2012–18 and 2020), CHCF/NORC.

CALIFORNIA HEALTH CARE FOUNDATION 34
Retail ClinicTelemedicine
Telemedicine Includes Behavioral Health Visits
■
Small Firms (3–199 workers)
■
Large Firms (200+ workers)
■
All Firms
73%
74%
73%
48%
49%
49%
93%
80%
81%
Benefits and Cost Sharing
California Employer Health Benefits
Firms Covering Telemedicine and Retail Clinics
Plans with Largest Enrollment, by Firm Size, California, 2020
Nearly 95% of large firms reported
that their health plan with the largest
enrollment offered coverage for
telemedicine services, and nearly 75%
of these firms' plans with the largest
enrollment also included coverage for
behavioral health telemedicine visits.
About half of all firms reported that
their plan with the largest enrollment
covered care from a retail clinic.
COVERAGE INCLUDES...
Note: Tests found no significant differences between small and large firms.
Source: California Employer Health Benefits Survey (2020), CHCF/NORC.

CALIFORNIA HEALTH CARE FOUNDATION 35
Large Firms*
(200+ workers)
Small Firms*
(1–199 workers)
All Firms
■
Yes
■
No
■
Don’t Know
4%
77%16%
77%
7%
8%
16%
76%
20%
(200+ workers)
Employer Views and Practices
California Employer Health Benefits
Firms That Offered a Narrow Network Plan to Reduce Plan Costs
by Firm Size, California, 2020
Sixteen percent of small firms offered
a narrow network plan in 2020 to
reduce plan costs.
OFFERED A NARROW NETWORK PLAN
* Difference is statistically different between small and large firms.
Notes: A narrow network is one that limits the number of providers who can participate, or limits some services to certain facilities. These plans’ networks are more restrictive than a
standard HMO network.
Source: California Employer Health Benefits Survey (2020), CHCF/NORC.

CALIFORNIA HEALTH CARE FOUNDATION 36
3%
3%
2%
Large Firms
(200+ workers)
Small Firms
(1–199 workers)
All Firms
■
Yes
■
No
■
Don’t Know
90% 7%
90% 7%
6%
92%
Employer Views and Practices
California Employer Health Benefits
Firms That Eliminated Hospitals or Health Systems from
Provider Network to Reduce Plan Costs
by Firm Size, California, 2020
Three percent of firms eliminated
hospitals or health systems from
provider networks to reduce plan
costs.
ELIMINATED HOSPITALS OR HEALTH SYSTEMS
Source: California Employer Health Benefits Survey (2020), CHCF/NORC.

CALIFORNIA HEALTH CARE FOUNDATION 37
1%
1%
<1%
2%
Drop Coverage Entirely
Restrict Employee Eligibility for Coverage
Increase the Amount Employees Pay for Prescription Drugs
Increase the Amount Employees Pay for Copays or Coinsurance
Increase the Amount Employees Pay for Deductibles
Increase the Amount Employees Pay for Premiums
■
Very
■
Somewhat
■
Not Too
■
Not at All
■
Don’t Know
24%
14% 12%
48%
57%
60%
55% 7%
90%
91%
15%10%10%
12% 11% 15%
12%14%14%
4%
3%
3%5%
4% 3%
4%
Employer Views and Practices
California Employer Health Benefits
Likelihood of Firms Making Changes in the Next Year
by Type of Change, California, 2020
Thirty-eight percent of California firms
reported they are very or somewhat
likely to increase the amount that
workers pay for premiums in the next
year. Twenty-eight percent of firms
stated that they are very or somewhat
likely to increase employees’
deductibles, and 20% stated that
they are very or somewhat likely to
increase what employees pay for
copays or coinsurance.
Note: Segments may not add to 100% due to rounding.
Source: California Employer Health Benefits Survey (2020), CHCF/NORC.

CALIFORNIA HEALTH CARE FOUNDATION 38
3% 3%
4%
Large Firm*
(200+ workers)
Small Firm*
(3–199 workers)
Large Firm
(200+ workers)
Small Firm
(3–199 workers)
■
Very Likely
■
Somewhat Likely
■
Not Too Likely
■
Not at All Likely
■
Don’t Know
Increase Amount Employees Pay for Premiums
Increase Amount Employees Pay for Copays or Coinsurance
2%
1%
15% 12% 48%
37%13%11%38%
23%
10%
8%
10% 15% 60%
17% 70%
Employer Views and Practices
California Employer Health Benefits
Likelihood of Employers Making Selected Changes in the Next Year
by Firm Size, California, 2020
Compared to small firms, large firms
in California were more likely to report
that they are very likely to increase the
amount employees pay for insurance
premiums in the coming year.
* Estimate is statistically different between small and large firms.
Note: Segments may not add to 100% due to rounding.
Source: California Employer Health Benefits Survey (2020), CHCF/NORC.

CALIFORNIA HEALTH CARE FOUNDATION 39
INCREASED
COST SHARING
MOVED BENEFIT
OPTIONS TO
HRA OR HSA*
REDUCED SCOPE
OF COVERED
BENEFITS
INCREASED
INCENTIVES TO
USE LESS COSTLY
PROVIDERS
FIRM SIZE
Small Firms (3–199 workers) 14% 3% 3% 5%
Large Firms 16% <1% 1% 1%
•
200–999 workers 14% <1% 0% 1%
•
1,000+ workers 20% <1% 4% 0%
REGION
Los Angeles 19% 0% 1% 2%
San Francisco 22% 0% 9% 9%
Rest of State 8% 5% 1% 4%
All Firms 25% 39% 4% 7%
Employer Views and Practices
California Employer Health Benefits
Firms That Made Changes in the Past Year
by Firm Size and Region, California, 2020
In the past year, 14% of California
firms increased cost sharing for
workers, 5% increased incentives
to use less costly providers, and 3%
reduced covered benefits.
* Asked only of firms offering a HDHP/SO.
Notes: Tests found no significant difference between estimates shown. Los Angeles and San Francisco are defined as the metropolitan statistical area (MSA).
Source: California Employer Health Benefits Survey (2020), CHCF/NORC.

CALIFORNIA HEALTH CARE FOUNDATION 40
FOR MORE INFORMATION
California Health Care Foundation
1438 Webster Street, Suite 400
Oakland, CA 94612
510.238.1040
www.chcf.org
California Employer Health Benefits
ABOUT THIS SERIES
The California Health Care Almanac is an online
clearinghouse for data and analysis examining
the state’s health care system. It focuses on issues
of quality, affordability, insurance coverage and
the uninsured, and the financial health of the
system with the goal of supporting thoughtful
planning and effective decisionmaking. Learn
more at www.chcf.org/almanac.
AUTHORS
Heidi Whitmore, Principal Research Scientist
Jennifer Satorius, Senior Research Scientist
NORC at the University of Chicago
The California Employer Health Benefits Survey is a joint product of the California Health Care Foundation (CHCF) and NORC at the University of
Chicago. The survey was designed and analyzed by researchers at NORC, and administered by Davis Research (Davis). The findings are based on
a random sample of 454 interviews with employee benefit managers in private firms in California. Davis conducted interviews from August to
December 2020. The sample of firms was drawn from a Dynata database of private employers with three or more workers. Some exhibits do not sum
to 100% due to rounding effects.
KFF (Kaiser Family Foundation) sponsored this survey of California employers from 2000 to 2003. A similar employer survey was also conducted in
1999 in California, in conjunction with the Center for Health and Public Policy Studies at the University of California, Berkeley. The Health Research
and Educational Trust (HRET) collaborated on these surveys from 1999 to 2004. The Center for Studying Health System Change collaborated on these
surveys from 2005 to 2006.
This survey instrument is similar to a national employer survey conducted annually by KFF. The US results in this study are either from the published
reports or from author calculations from the surveys’ public use files. A full analysis of the US data set is available on KFF’s website at www.kff.org. Both
the California and US surveys asked questions about health maintenance organizations (HMOs), preferred provider organizations (PPOs), point-of-
service (POS) plans, and high-deductible health plans with a savings option (HDHP/SO). Conventional (fee-for-service) plans are generally excluded
from the plan type analyses because they compose such a small share of the California market.
Many variables with missing information were identified as needing complete information within the database. To control for item nonresponse bias,
missing values within these variables were imputed using a hot-deck approach. Calculation of the weights follows a common approach. First, the
basic weight is determined, followed by a survey nonresponse adjustment. Next, the weights are trimmed in order to reduce the influence of weight
outliers. Finally, a post-stratification adjustment is applied.
All statistical tests in this chart pack compare either changes over time, a plan-specific estimate with an overall estimate, or subcategories versus all
other firms (e.g., firms with three to nine workers vs. all other firms). Tests include t-tests and chi-square tests and significance was determined at p <
.05 level.
A important note about the methodology. Rates of change for total premiums, for worker or employer contributions to premiums, and other
variables calculated by comparing dollar values in this report to data reported in past CHCF or KFF publications should be used with caution, due to
both the survey’s sampling design and the way in which plan information is collected. Rates calculated in this fashion not only reflect a change in the
dollar values but also a change in enrollment distribution, thus creating a variable enrollment estimate. However, rates of change in premiums are
collected directly as a question in the California survey. This rate of change holds enrollment constant between the current year and the previous year
thus creating a fixed enrollment estimate. Because the survey does not collect information on the rate of change in other variables, additional rates
are not reported. The national survey conducted by Kaiser/HRET, however, stopped collecting directly rates of change in premiums in its 2008 survey.
Therefore, the rate of change in total premiums in the US provided in this report uses a variable enrollment estimate.
Please note that due to a change in the post-stratification methods applied in 2003, the survey data published in this chart book may vary slightly
from reports published prior to 2003.
Methods
