

2
Miami Association of REALTORS
®
(MIAMI)
Teresa King Kinney, CAE, RCE, CIPS, TRC, AHWD, RSPS, GRI, e-PRO®
Chief Executive Officer
Chris Umpierre, AHWD
VP of Communications
National Association of REALTORS
®
Lawrence Yun, Ph.D.
Chief Economist and Senior Vice President, Research
Matt Christopherson
Senior Research Analyst
©2022 Miami Association of REALTORS
®
and the National Association of REALTORS
®.
This Report may be cited
with the proper attribution.
December 2022

Objective
The 2022 survey provides information on the international
residential transactions of Miami Association of REALTORS
®
(MIAMI) members from August 2021–July 2022. In this report, the
year 2022 refers to this period, and previous years refer to the
prior 12-month periods.
Respondents
3
The association sent the online survey to its
approximately 55,000 members, of which 2,051
responded during the survey period from August
15–September 19, 2022. Among these
respondents, 605 reported they had a foreign
buyer.
Among respondents who provided information:
• 68% of the respondents were from Miami-
Dade County
• 6% reported a CIPS designation (among 1,065
respondents)
• 85% have been in business for over one year
(among 1,127 respondents)
About the 2022 Miami Association of REALTORS® (MIAMI)
Survey
64.9%
29.7%
4.9%
0.1%
0.4%
69.6%
28.2%
1.8%
0.4%
0.1%
67.8%
29.8%
1.8%
0.3%
0.3%
MIAMI- DADE BROWARD PALM BEACH MARTIN OTHER*
DISTRIBUTION OF RESPONDENTS'
PRIMARY BUSINESS AREA
BY COUNTY
2020 2021 2022

$6.8 billion
Dollar volume of foreign buyer residential purchases during August 2021‒July 2022
(34% increase from 2021 volume; nationally, the dollar volume of foreign buyer purchases rose by 8.5%)
17%
Foreign buyer share to MIAMI dollar sales volume
(higher than the 14% share in 2021 and the 3% share nationally)
72%
Fraction of MIAMI foreign buyers who primarily resided abroad
(higher than 43% nationally)
$500,000
MIAMI foreign buyer median purchase price
(higher than $420,200 MIAMI median sales price)
2022 Profile of International Homebuyer Transactions of
Miami Association of REALTORS
®
Members

66%
Share of all-cash purchases
(compared to 44% nationally)
Top Foreign Buyers
Argentina (16%), Colombia (13%), Canada (8%), Peru (8%), Chile (6%), Mexico (6%), Venezuela (6%),
Brazil (6%). Foreign buyers came from 54 countries
Destination of Foreign Buyers
Miami-Dade County (67%), Broward County (27%), Palm Beach County (2%), and Other counties (4%)
73%
Fraction of MIAMI foreign buyers who purchased for vacation and/or rental use
(compared to 44% nationally)
2022 Profile of International Homebuyer Transactions of
Miami Association of REALTORS
®
Members

58%
Fraction of MIAMI foreign buyers who purchased condominiums
(compared to 16% nationally)
94%
Fraction of MIAMI foreign buyers who visited Florida at least once before buying a property
56%
Fraction of respondents who had an international customer
(higher share than the 50% share in 2021 and the national share of 12%)
78%
Fraction of leads/referrals/customers from personal/business contacts or former customers
79%
Fraction of respondents who are fluent in a language other than English
2022 Profile of International Homebuyer Transactions of
Miami Association of REALTORS
®
Members

ECONOMIC ENVIRONMENT
• Economic Conditions
• Florida Real Estate Home Prices

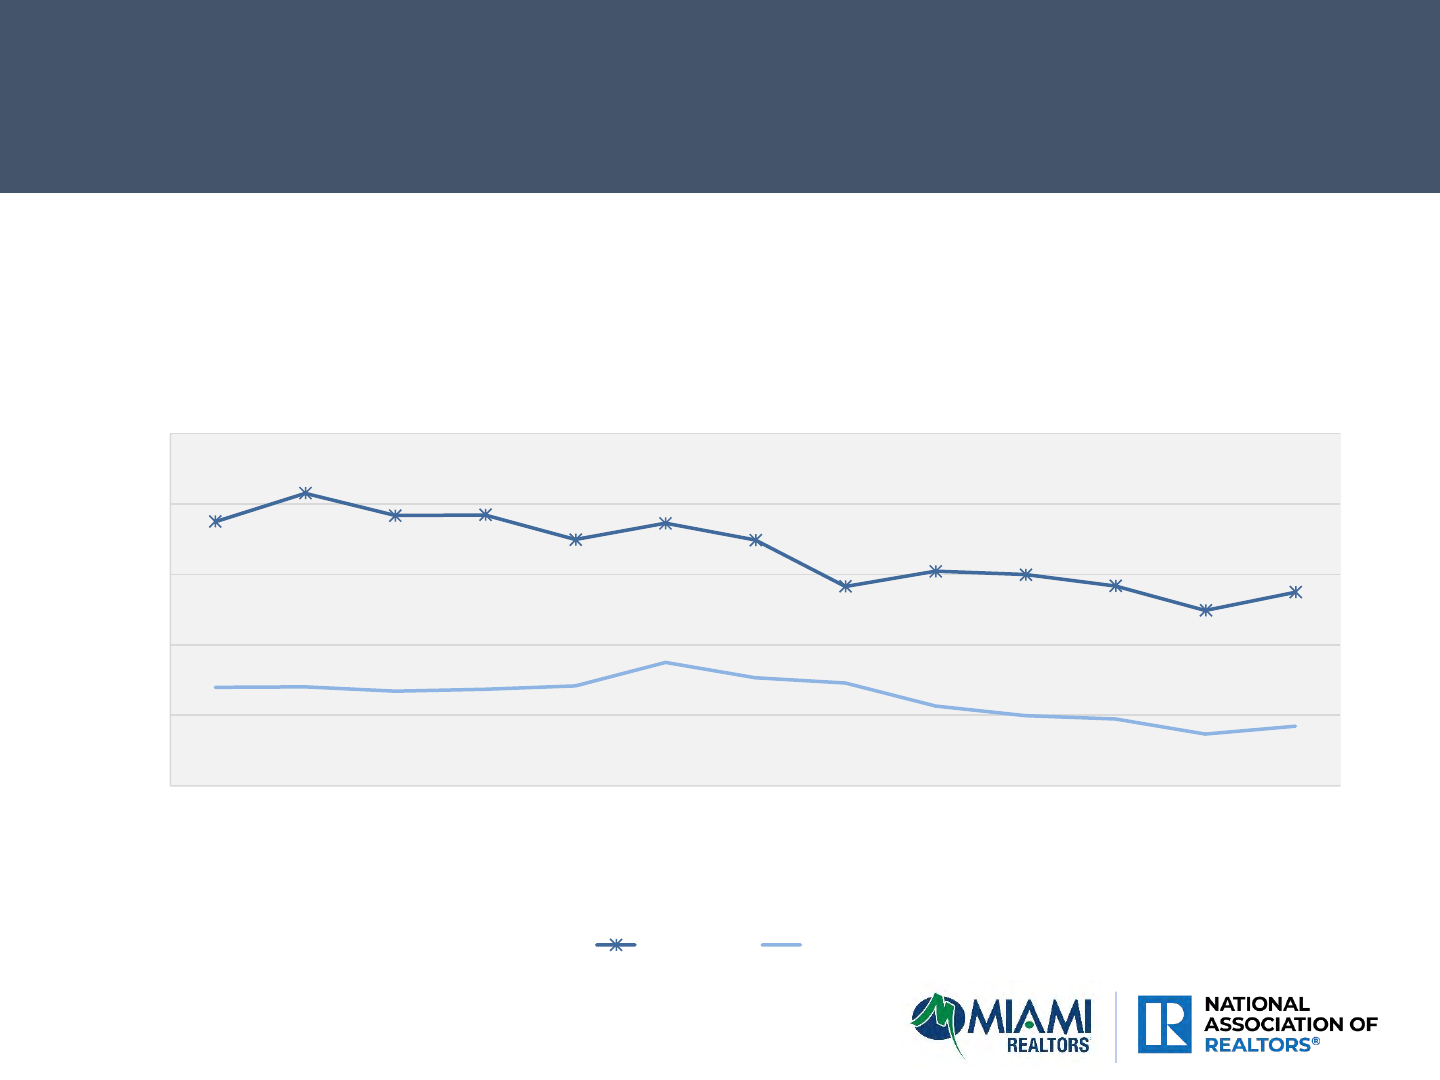
Tourist Arrivals: Continuing to Recover
5.8
0.2
5.2
0.0
1.0
2.0
3.0
4.0
5.0
6.0
7.0
JAN/2020
FEB/2020
MAR/2020
APR/2020
MAY/2020
JUN/2020
JUL/2020
AUG/2020
SEP/2020
OCT/2020
NOV/2020
DEC/2020
JAN/2021
FEB/2021
MAR/2021
APR/2021
MAY/2021
JUN/2021
JUL/2021
AUG/2021
SEP/2021
OCT/2021
NOV/2021
DEC/2021
JAN/2022
FEB/2022
MAR/2022
APR/2022
MAY/2022
JUN/2022
JUL/2022
MILLIONS
MONTHLY TOURIST ARRIVALS TO THE UNITED
STATES (MILLIONS)
Source: National Travel and Tourism Office

Tourist Arrivals to the United States by Region of Origin
Tourist Arrivals to the United States
August 2019-
July 2020
August 2020 -
July 2021
August 2021-July
2022
% Chg,
2020-2022
From all countries 49,781,687 13,796,420 38,387,213 -23%
From Asia and Oceania 8,082,099 674,903 3,125,502 -61%
From Canada 13,241,539 963,619 8,693,767 -34%
From Latin America 4,257,966 2,705,388 5,027,446 18%
From Argentina 480,743 184,073 456,329 -5%
From Brazil 1,274,496 72,756 809,210 -37%
From Colombia 541,941 730,946 1,019,742 88%
From Venezuela 227,834 144,159 226,123 -1%
From Europe 9,196,637 593,883 7,182,969 -22%
Source: NTTO

10% of MIAMI Realtors® Reported an International
Transaction Did Not Close Due to the Travel Ban
19%
81%
14%
86%
10%
90%
YES NO
PERCENT OF RESPONDENTS WHO REPORTED
THEY HAD AN INTERNATIONAL TRANSACTION
THAT DID NOT CLOSE DUE TO THE
CORONAVIRUS-RELATED TRAVEL BAN
2020 2021 2022

9% Increase in U.S. Foreign Buyer Purchases During April
2021-March 2022* to $59.0 Billion
$33.2
$41.2
$34.8
$46.7
$54.5
$43.5
$74.9
$53.0
$33.2
$33.0
$22.0
$24.9
$33.2
$41.2
$33.4
$45.5
$49.4
$59.1
$78.1
$67.9
$44.7
$41.0
$32.4
$34.1
$66.4
$82.5
$68.2
$92.2
$103.9
$102.6
$153.0
$121.0
$77.9
$74.0
$54.4
$59.0
2011 2012 2013 2014 2015 2016 2017 2018 2019 2020 2021 2022
DOLLAR VOLUME OF EXISTING-HOME PURCHASES BY
FOREIGN BUYERS IN THE UNITED STATES
(BILLION DOLLARS)
Non-resident (Type A) Resident (Type B)
*Based on transactions in the 12 months ending March of each year.

Florida #1 U.S. Destination for Foreign Buyers for Last 14
Years
FL CA TX AZ NY NC NJ IL SC VA
2009 23% 13% 11% 7% 2% 3% 1% 4% 2% 3%
2010 22% 12% 8% 11% 4% 2% 2% 1% 2% 2%
2011 31% 12% 9% 6% 3% 2% 3% 3% 1% 2%
2012 26% 11% 7% 7% 4% 2% 1% 3% 1% 1%
2013
23% 17% 9% 9% 3%
1% 2% 2% 1% 3%
2014 23% 14% 12% 6% 3% 2% 3% 3% 1% 2%
2015 21% 16% 8% 5% 3% 2% 3% 3% 1% 2%
2016 22% 15% 10% 4% 4% 3% 4% 4% 1% 1%
2017 22% 12% 12% 4% 3% 3% 4% 3% 1% 2%
2018 19% 14% 9% 5% 5% 3% 4% 3% 1% 3%
2019 20% 12% 10% 5% 3% 3% 4% 3% 2% 2%
2020 22% 15% 9% 3% 5% 3% 4% 3% 1% 3%
2021 21% 16% 9% 5% 4% 3% 4% 3% 1% 2%
2022 24% 11% 8% 7% 4% 4% 3% 3% 2% 2%
Top 10 list is based on the most recent year.
Share of Top 10 States to Total Foreign Buyer Purchases

More Out-of-State Buyers in MIAMI Area in 2022*
*Survey reference periods are from August of the prior year to July of current year
12%
43%
46%
9%
45%
46%
9%
43%
48%
LIVED ABROAD FLORIDA OUT-OF-STATE
WHERE BUYERS (DOMESTIC OR FOREIGN) LIVED IN
2020 2021 2022

New York, California, and New Jersey: 51% of Out-of-State
Buyers in MIAMI Area in 2022*
*NY, CA, NJ accounted for 52% of out-of-state buyers in 2021 survey
28%
15%
8%
5%
5%
4%
3%
3%
3%
29%
15%
9%
5%
4%
4%
3%
3%
2%
28%
10%
10%
4%
4%
3%
4%
4%
3%
New York
California
New Jersey
Texas
Georgia
Illinois
Connecticut
Massachusetts
Michigan
DISTRIBUTION OF TOP OUT-OF-STATE BUYERS
2022
2021
2020

Metropolitan Statistical Area
August 2020-July 2021 August 2021-July 2022 % Change
Punta Gorda, FL $270,000 $350,995 30%
Ocala, FL $200,745 $260,000 30%
Naples-Immokalee-Marco Island, FL $436,000 $560,000 28%
Lakeland-Winter Haven, FL $242,000 $309,900 28%
Cape Coral-Fort Myers, FL $294,950 $376,000 27%
Homosassa Springs, FL $205,000 $260,000 27%
North Port-Sarasota-Bradenton, FL $340,000 $430,000 26%
Sebring, FL $180,000 $226,000 26%
Tampa-St. Petersburg-Clearwater, FL $280,000 $350,000 25%
Port St. Lucie, FL $289,000 $360,000 25%
Deltona-Daytona Beach-Ormond Beach, FL $266,000 $330,000 24%
The Villages, FL $279,900 $347,083 24%
Palm Bay-Melbourne-Titusville, FL $272,000 $330,000 21%
Orlando-Kissimmee-Sanford, FL $301,000 $365,000 21%
Jacksonville, FL $285,000 $345,000 21%
Panama City, FL $290,000 $351,000 21%
Pensacola-Ferry Pass-Brent, FL $263,275 $315,900 20%
Sebastian-Vero Beach, FL $285,000 $339,000 19%
Gainesville, FL $245,200 $285,000 16%
Miami-Fort Lauderdale-West Palm Beach, FL $350,000 $404,100 15%
Crestview-Fort Walton Beach-Destin, FL $381,000 $431,900 13%
Tallahassee, FL $235,000 $258,623 10%
Source: Florida Realtors®
All counties
Strong Price Growth in Florida’s Metro Areas

Slightly Stronger Dollar Aided by Price Appreciation
33%
32%
19%
19%
18%
Euro/US$
Pound/US$
Yuan/US$
Canadian$/US$
New Peso/US$
Year-over-Year Percent Change in the Value of the
Dollar as of July 2022 Against Other Currency
As of July 2022, 1 US Dollar equals:
0.98 Euro; 0.83 Pound; 6.73 Yuan; 1.29 Canadian Dollar; 20.49 New Peso

FOREIGN BUYER PURCHASES
• Dollar Volume
• Origin and Destination
• Foreign Buyer Preferences

34% Increase in Dollar Volume of MIAMI Foreign Buyer
Residential Purchases in 2022*― More than 9% Increase
Nationally
$6.2 $6.2
$7.1
$8.7
$6.9
$5.6
$5.1
$6.8
2015 2016 2017 2018 2019 2020 2021 2022
MIAMI FOREIGN BUYER DOLLAR VOLUME
(IN BILLION DOLLARS)
*Survey reference periods are from August of the prior year to July of current year

25% Year-over-Year Increase in MIAMI Foreign Buyer
Residential Purchases in 2022*― 8% Decline Nationally
10,800
10,900
15,300
14,300
11,500
9,200
7,500
9,400
2015
2016
2017
2018
2019
2020
2021
2022
MIAMI FOREIGN BUYER PURCHASES
*Survey reference periods are from August of the prior year to July of current year

MIAMI Foreign Buyer Market Share Increased in 2022
22%
24%
35%
33%
26%
23%
13%
16%
37%
39%
44%
50%
38%
32%
14%
17%
2015 2016 2017 2018 2019 2020 2021 2022
FOREIGN BUYERS AS A PERCENT OF MIAMI
CLOSED SALES
Foreign Buyer Purchases as a Percent of MIAMI Closed Sales
Foreign Buyer Dollar Volume as a Percent of MIAMI Sales Dollar Volume

Higher Foreign Buyer Market Share in MIAMI Market
Compared to Nationally
37%
39%
44%
50%
38%
32%
14%
17%
8%
7%
10%
8%
5%
4%
3%
3%
0%
10%
20%
30%
40%
50%
60%
2015 2016 2017 2018 2019 2020 2021 2022
FOREIGN BUYER RESIDENTIAL PURCHASES AS A
PERCENT OF CLOSED SALES
MIAMI U.S.

72% of MIAMI Foreign Buyers Primarily Resided Abroad―
A Higher Share Compared to Nationally
67%
69%
63%
72%
74%
74%
72%
41%
42%
39%
40%
39%
42%
43%
2016 2017 2018 2019 2020 2021 2022
SHARE OF NON-RESIDENT FOREIGN BUYERS
MIAMI U.S.

62% of Foreign Buyers Held B1-B2 Visas
42%
23%
11%
7%
5%
4%
8%
41%
26%
9%
5%
8%
3%
9%
38%
24%
9%
5%
7%
5%
12%
B2 B1 EB5 F AND J E1-E2 L OTHER
VISAS
VISAS HELD BY INTERNATIONAL CUSTOMERS
2020 2021 2022

MIAMI Foreign Buyers Came from 54 Countries

Top Tier Countries of Origin:
Primarily from Latin America
16%
13%
8% 8%
6% 6% 6% 6%
3% 3%
0%
2%
4%
6%
8%
10%
12%
14%
16%
18%
ARGENTINA
COLOMBIA
PERU
CANADA
VENEZUELA
MEXICO
CHILE
BRAZIL
FRANCE
ITALY
MIAMI TOP FOREIGN BUYERS

Miami-Dade County: 67% of MIAMI Foreign Buyers
*Remaining 4% of MIAMI foreign buyers purchased properties in other Florida counties
63%
25%
4%
65%
31%
4%
77%
19%
2%
70%
26%
2%
65%
27%
3%
67%
27%
2%
MIAMI-DADE COUNTY BROWARD COUNTY PALM BEACH COUNTY
DESTINATION OF FOREIGN BUYERS
2017 2018 2019 2020 2021 2022

Foreign Buyers Share by County 2018-2022
34%
31%
29%
33%
16%
12%
26%
18%
12%
13%
11%
10%
14%
12%
7%
MIAMI-DADE BROWARD PALM BEACH
FOREIGN BUYERS AS A PERCENT OF MIAMI
MEMBERS' CLOSED SALES* PER COUNTY
2018 2019 2020 2021 2022
*Single-family homes, townhouses, condominiums

Miami-Dade County:
Latin Americans Were Major Buyers
Other buyers were from Italy, France, Costa Rica, Dominican Republic, Ecuador, China, Spain,
Bolivia, Honduras, Panama, Germany, Russia, and Sweden.
13%
12%
8%
8%
7%
7%
7%
5%
Argentina
Colombia
Mexico
Peru
Chile
Canada
Venezuela
Brazil
MAJOR FOREIGN BUYERS IN MIAMI-DADE
COUNTY

Broward County:
Latin Americans Were Major Buyers
Other buyers were Israel, Bahamas, Dominican Republic, Ecuador, Mexico, France, Romania,
Russa, and the United Kingdom of Great Britain and Northern Ireland.
21%
16%
11%
8%
6%
6%
4%
Argentina
Colombia
Canada
Peru
Brazil
Venezuela
Chile
MAJOR FOREIGN BUYERS IN BROWARD
COUNTY

Palm Beach County:
Latin Americans Were Major Buyers
38%
25%
25%
13%
Colombia
Canada
United Kingdom of Great
Britain and Northern…
South Africa
MAJOR FOREIGN BUYERS IN PALM BEACH
COUNTY

Destinations of Argentine Buyers
Miami-Dade,
60%
Broward, 37%
Lee, 3%
DESTINATIONS OF ARGENTINE BUYERS

Destinations of Colombian Buyers
Miami-Dade,
61%
Broward, 30%
Palm Beach, 5%
Osceola, 2%
Indian River, 2%
DESTINATIONS OF COLOMBIAN BUYERS

Destinations of Peruvian Buyers
Miami-Dade,
68%
Broward, 29%
Collier, 3%
DESTINATIONS OF PERUVIAN BUYERS

Destinations of Canadian Buyers
Miami-Dade,
54%
Broward, 34%
Palm Beach, 6%
Brevard, 3%
Lee, 3%
DESTINATIONS OF CANADIAN BUYERS

Foreign Buyer Median Purchase Price: $500,000―
Higher than Median Price in MIAMI Area
$337,100
$339,200
$339,300
$373,000
$375,600
$357,100
$386,200
$500,000
$359,600
$404,100
$200,000
$250,000
$300,000
$350,000
$400,000
$450,000
$500,000
$550,000
2015 2016 2017 2018 2019 2020 2021 2022
MEDIAN PURCHASE PRICE AMONG FOREIGN AND
ALL BUYERS
Foreign Buyers All Buyers

Chileans and Mexicans Typically Purchased More Expensive
Properties
$718,800
$701,900
$611,100
$516,700
$494,400
$469,200
$450,000
$333,300
CHILE
MEXICO
CANADA
COLOMBIA
BRAZIL
VENEZUELA
PERU
ARGENTINA
MEDIAN PURCHASE PRICE

66% of Foreign Buyers Paid All Cash―
Higher than 44% of Foreign Buyers Nationally
All Cash
66%
U.S.Mortgage
30%
Home Country
Mortgage
2%
Other
2%
Don't Know
1%
SOURCE OF PAYMENT

Peruvian Buyers ―
Highest Fraction Among Top Foreign Buyers Who Paid Cash
78%
74%
67%
62%
57%
55%
50%
43%
PERU
ARGENTINA
CANADA
MEXICO
COLOMBIA
BRAZIL
VENEZUELA
CHILE
ALL-CASH PURCHASES

72% of Foreign Buyers Purchased for Vacation and/or Rental
―A Higher Fraction than Among U.S. Foreign Buyers*
*44% of all U.S. foreign buyers intended to use the property for vacation and/or rental
2%
4%
2%
16%
17%
20%
39%
Don't Know
Other
Student Use
Vacation and Rental
Vacation Home
Primary Residence
Residential Rental
INTENDED USE

Argentina and Chile ―
Highest Fraction Who Intend to Rent Out Property
17%
13%
36%
26%
26%
22%
4%
14%
51%
48%
9%
48%
57%
26%
54%
27%
11%
17%
24%
13%
13%
4%
14%
10%
15%
24%
6%
13%
30%
33%
41%
5%
6%
6%
ARGENTINA
COLOMBIA
CANADA
PERU
CHILE
MEXICO
VENEZUELA
BRAZIL
USE FOR VACATION OR INVESTMENT RENTAL
Other Student use
Primary residence Both of the above
Residential rental property for investment Vacation home for family and friends

58% of Foreign Buyers Purchased Condominiums ―
A Higher Fraction than Among U.S. Foreign Buyers*
2%
1%
14%
25%
58%
OTHER
RESIDENTIAL LAND
TOWNHOUSE/ROWHOUSE
SINGLE-FAMILY, DETACHED
CONDOMINIUM
TYPE OF PROPERTY
*16% of all U.S. foreign buyers purchased condominiums

Argentina and Mexico―Highest Fraction Among Top Foreign
Buyers Who Purchased Condominiums
12%
23%
24%
19%
26%
22%
29%
27%
8%
23%
9%
25%
9%
4%
29%
9%
73%
52%
67%
56%
65%
70%
42%
64%
ARGENTINA
COLOMBIA
CANADA
PERU
CHILE
MEXICO
VENEZUELA
BRAZIL
TYPE OF PROPERTY
Detached single-family Townhouse/row house/duplex
Condominium or Cooperative Land

64% Purchased in Central City/Urban Area―
Increase in Suburbs Compared to 2021
64%
25%
3%
8%
0%
10%
20%
30%
40%
50%
60%
70%
80%
2017 2018 2019 2020 2021 2022
TYPE OF AREA
Central City/Urban Area Suburban Area
Small Town/Rural Area Resort Area

Mexicans― Highest Fraction Among Top Foreign Buyers
Who Purchased Property in a City/Urban Area
57%
59%
39%
63%
74%
91%
79%
59%
29%
31%
33%
22%
13%
9%
17%
27%
0%
11%
8%
21%
13%
9% 9%
ARGENTINA
COLOMBIA
CANADA
PERU
CHILE
MEXICO
VENEZUELA
BRAZIL
AREA WHERE MAJOR FOREIGN BUYERS
PURCHASED PROPERTY
Central city/urban area Suburban area
Small town Rural area
Resort area

61% of Foreign Buyers Visited Florida Only 2 Times
or Less Before Purchasing a Property
6%
28%
27%
17%
5%
10%
5%
1%
0%
5%
10%
15%
20%
25%
30%
35%
0 1 2 3 4 5 TO 7 8 TO 10 MORE
THAN
10
NUMBER OF TIMES BUYER VISITED FLORIDA
BEFORE MAKING A PURCHASE
2018 2019 2020 2021 2022

WORKING WITH
INTERNATIONAL CUSTOMERS
• International Business Trends
• Factors Affecting the Decision
to Purchase Property
• Leads and Referrals
• Customer Interaction
55% of MIAMI REALTORS
®
Had an International Customer*―
Significantly Higher than National Share of 17%
*Whether customer purchased property or not
75%
83%
77%
77%
70%
75%
70%
57%
61%
60%
57%
50%
55%
17%
0%
20%
40%
60%
80%
100%
2010
2011
2012
2013
2014
2015
2016
2017
2018
2019
2020
2021
2022
PERCENT OF REALTORS® WHO WORKED WITH AN
INTERNATIONAL CUSTOMER
IN THE PAST 12 MONTHS
MIAMI U.S.

35% of MIAMI REALTORS
®
Reported an Increase in
International Business in the Past Year
43%
37%
20%
27%
29%
45%
24%
42%
35%
DECREASED STAYED ABOUT THE
SAME
INCREASED
CHANGE IN INTERNATIONAL BUSINESS IN
THE PAST YEAR
2020 2021 2022
*Among respondents who worked with an international customer

48% of MIAMI REALTORS
®
Reported an Increase in
International Business Over the Past 5 Years
* Among respondents who worked with an international customer
35%
33%
33%
20%
28%
52%
18%
34%
48%
DECREASED STAYED ABOUT THE
SAME
INCREASED
CHANGE IN PERCENTAGE OF INTERNATIONAL
CUSTOMERS IN THE PAST 5 YEARS
2020 2021 2022

58% of MIAMI REALTORS
®
Expect an Increase in
International Business in Next 12 Months
* Among respondents who worked with an international customer
24%
17%
42%
17%
10%
17%
65%
8%
12%
22%
58%
8%
DECREASE REMAIN THE
SAME
INCREASE DON'T KNOW
OUTLOOK ON INTERNATIONAL BUSINESS IN
THE NEXT 12 MONTHS
2020 2021 2022

Investment Security and Desirable Location: Main Reasons
Foreign Buyers Purchase Property in MIAMI Area
Secure
Investment, 35%
Profitable
Investment, 27%
Desirable
Location, 34%
Don't Know, 2%
Other, 3%
WHY FOREIGN BUYERS PURCHASE PROPERTY IN
MIAMI

Major Reasons Customers Did Not Purchase Property:
Cost, Could Not find Property, Condo Fees
2%
7%
0%
3%
3%
5%
7%
8%
5%
9%
12%
16%
22%
3%
6%
1%
3%
5%
5%
5%
5%
7%
7%
11%
17%
26%
DON'T KNOW
OTHER
LOSS OF HOME COUNTRY BENEFITS
EXPOSURE TO U.S. TAX LAWS
INSURANCE COSTS
COULD NOT OBTAIN FINANCING
PROPERTY TAXES
IMMIGRATION LAWS
EXCHANGE RATE
CANNOT MOVE MONEY
CONDO FEES
COULD NOT FIND A PROPERTY
COST OF PROPERTY
REASONS CUSTOMERS DECIDED NOT TO PURCHASE
PROPERTY
2022 2021

71% of MIAMI REALTORS
®
Reported Customers Found U.S.
Prices to be More Expensive than in Home Country ―
An Increase from the Past Year*
*Among respondents who worked with an international customer
15%
14%
43%
43%
52%
56%
54%
68%
71%
0%
20%
40%
60%
80%
100%
2016 2017 2018 2019 2020 2021 2022
HOW INTERNATIONAL CUSTOMERS VIEWED U.S.
HOME PRICES
Less expensive than prices in home country
About the same as prices in home country
More expensive than prices in home country

78% of Foreign Buyer Leads/Referrals Were
Personal/Business Contacts and Previous Customers
1%
1%
1%
2%
1%
6%
15%
25%
41%
1%
2%
3%
3%
5%
8%
16%
19%
38%
SIGNS/ADS ON BOARDS/YARDS
WALK-IN/OPEN HOUSE/PHONE CALL
OUTSIDE U.S. BUSINESS CONTACT
U.S. BUSINESS CONTACT
WEBSITE/INTERNET (PAID AD)
WEBSITE/INTERNET ORGANIC SEARCH
FORMER CUSTOMER
PREVIOUS CUSTOMER REFERRAL
PERSONAL CONTACT REFERRAL
SOURCE OF LEAD OR REFERRAL
2022
2021

82% of MIAMI REALTORS
®
Reported No Problem Working
with International Customers ―An Increase from Past Years*
* Among respondents who worked with an international customer
67%
77%
71%
69%
77%
80%
80%
82%
25%
21%
27%
29%
19%
16%
17%
16%
2015 2016 2017 2018 2019 2020 2021 2022
CULTURAL OR LANGUAGE BARRIERS WORKING
WITH FOREIGN CUSTOMERS
No Problems Few Problems Significant Problems

79% of MIAMI REALTORS
®
are Fluent in Another Language
73%
76%
66%
69%
82%
81%
83%
79%
2015
2016
2017
2018
2019
2020
2021
2022
PERCENT OF REALTORS® WHO
ARE FLUENT IN ANOTHER
LANGUAGE
62%
49%
55%
66%
66%
71%
65%
2016
2017
2018
2019
2020
2021
2022
PERCENT OF RESPONDENTS
WHO ARE FOREIGN-BORN

MIAMI Association of REALTORS® - More than A Century of Excellence
The MIAMI Association of Realtors (MIAMI) is the largest local Realtor® association in the U.S. and the second largest in the
world, serving nearly 60,000 real estate professionals across South Florida.
MIAMI is celebrating 102 years of excellent training, outstanding service, and exceptional member support. MIAMI is
comprised of six organizations: MIAMI RESIDENTIAL, MIAMI COMMERCIAL; BROWARD-MIAMI, a division of MIAMI
Realtors; JTHS-MIAMI, a division of MIAMI Realtors in the Jupiter-Tequesta-Hobe Sound area; MIAMI YPN, our Young
Professionals Network Council; and the award-winning MIAMI Global Council.
MIAMI has official partnerships with 230 international organizations worldwide, the most of any Realtor® association in the
U.S. These alliances create business opportunities for MIAMI members, enhance Miami’s global position and strengthen the
local real estate market and economy.
MIAMI is home to one of the most successful international councils in the world. MIAMI hosts the award-winning MIAMI
Global Real Estate Congress each fall with many of our distinguished partners participating in the three-day event. MIAMI is
the first National Association of Realtors Diamond Global Council. MIAMI’s Global Property Exchange (GlobalPropX) features
MIAMI Partner Property Searches worldwide, all on one platform and provides even more global exposure for MIAMI member
listings.
MIAMI offers members the best tools and resources available to successfully do global business, including global property
portals, websites with automatic translation in 19 languages, B2B platforms for networking and referrals, global designations
and certifications, and access to agents and consumers worldwide. MIAMI also generates worldwide exposure for members
and the South Florida market through events, outreach, media relations and other highly effective initiatives.
MIAMI properties are linked to more than 2 million professionals worldwide, and MIAMI properties are featured on global
property portals Proxio Pro, Juwaii, Realtor.com, International MLS and more. Learn about our local Global Referral Network,
foreign partners, global market research and more: www.MiamiRealtors.com/global

The National Association of REALTORS® is America’s largest trade association, representing more than 1.5 million
members, including NAR’s institutes, societies and councils, involved in all aspects of the real estate industry. NAR
membership includes brokers, salespeople, property managers, appraisers, counselors and others engaged in both
residential and commercial real estate.
The term REALTOR® is a registered collective membership mark that identifies a real estate professional who is a
member of the National Association of REALTORS® and subscribes to its strict Code of Ethics.
Working for America’s property owners, the National Association provides a facility for professional development,
research and exchange of information among its members and to the public and government for the purpose of
preserving the free enterprise system and the right to own real property.
NATIONAL ASSOCIATION OF REALTORS®
RESEARCH GROUP
The Mission of the NATIONAL ASSOCIATION OF REALTORS® Research Group is to produce timely, data-driven
market analysis and authoritative business intelligence to serve members, and inform consumers, policymakers and the
media in a professional and accessible manner.
To find out about other products from NAR’s Research Group, visit https://www.nar.realtor/research-and-statistics
NATIONAL ASSOCIATION OF REALTORS®
Research Group
500 New Jersey Avenue, NW
Washington, DC 20001
202-383-1000
data@nar.realtor

2022 Profile of International Homebuyer Transactions of Miami Association of REALTORS® Members
©2022 All rights reserved.
Miami Association of REALTORS®
National Association of REALTORS®
This Report may be cited with the proper attribution: See https://www.nar.realtor/research-and-statistics/citation-guidelines-for-nar-
research-statistics
