NEW JERSEY TRAFFIC AND
REVENUE STUDY
New Jersey Turnpike & Route 440 Asset
Appraisal
Final Report
January 2008
Prepared for: Prepared by:
State of New Jersey
Department of Treasury
State House
125 West State Street
Trenton, NJ 08625
Steer Davies Gleave in association with CRA
International and EDR Group
28-32 Upper Ground
London
SE1 9PD
+44 (0)20 7919 8500
www.steerdaviesgleave.com

New Jersey Turnpike & Route 440 Asset Appraisal
Contents
Contents Page
1. INTRODUCTION 1
Statement of Objectives 1
Approach and Analysis Undertaken 1
Report Contents 2
2. THE NEW JERSEY TURNPIKE 3
Project Overview 3
2006 Traffic Levels 11
Behavioral Research 26
Summary 28
3. ROUTE 440 30
Project Overview 30
Tolling Regimes 32
Traffic Trends 32
4. THE FORECASTING METHODOLOGY 35
Introduction 35
Impact of Toll Changes and Congestion 37
Existing and Future Capacity Constraints 38
5. TRAFFIC GROWTH 39
Introduction 39
Economic Development 39
Trip Rates 41
WSA Forecasts 47
Steer Davies Gleave Forecasts 48
6. FORECASTS 56
Introduction 56
Toll Scenarios 58
NJTP Traffic and Revenue Forecasts 60
Route 440 Traffic and Revenue Forecasts 65
Review of Responses in Demand to Toll Changes 71

New Jersey Turnpike & Route 440 Asset Appraisal
Contents
A
PPENDICES
A: MAPS
B: FORECASTS
C: LANE EXPANSIONS

New Jersey Turnpike & Route 440 Asset Appraisal
Glossary
GLOSSARY OF DEFINED TERMS:
• Annual Average Weekday Traffic (AADTw)
• Atlantic City Expressway (ACE)
• Annual Average Daily Traffic (AADT)
• CRA International (CRAI)
• EDR Group (EDRG)
• Electronic Toll Collection (ETC)
• Federal Highway Administration (FHWA)
• Garden State Parkway (GSP)
• Gross Domestic Product (GDP)
• Gross Regional Product (GRP)
• Level of Service (LOS)
• Michael Baker Jr., Inc. (Baker)
• New Jersey Department of Transportation (NJDOT)
• North Jersey Regional Model (NJTPA)
• New Jersey Turnpike (NJTP)
• New Jersey Turnpike Authority (NJTA)
• Origin-Destination (O-D)
• Rutgers State University of New Jersey’s Economic Advisory Service (RECON)
• South Jersey Regional Model (SJTPO)
• US Highway 1/9 (US-1/9)
• U.S. Highway Capacity Manual (HCM)
• Vehicle Miles Traveled (VMT)
• Wilbur Smith and Associates (WSA)

New Jersey Turnpike & Route 440 Asset Appraisal
Disclaimer
DISCLAIMER
This report has been prepared for the State of New Jersey as an initial overview of issues relevant to
traffic and revenue projections to assist in the preparation of the possibility of monetizing a number
of the transport assets at present owned and operated by the State (or its agents). This report is
intended to provide an overview of relevant issues and does not provide investment grade analysis.
The analysis and projections of traffic and revenue contained within this document represent the
best estimates of Steer Davies Gleave at this stage. While the forecasts are not precise forecasts,
they do represent, in our view, a reasonable expectation for the future, based on the information
available as of the date of this report.
However, the estimates contained within this document rely on numerous assumptions and
judgments and are influenced by external circumstances that are subject to changes that may
materially affect the conclusions drawn.
In addition, the view and projections contained within this report rely on data collected by third
parties. Steer Davies Gleave has conducted independent checks of this data where possible, but
does not guarantee the accuracy of this data.
No parties other than the State of New Jersey can place reliance on it.

New Jersey Turnpike & Route 440 Asset Appraisal
1
1. INTRODUCTION
Statement of Objectives
1.1 The State of New Jersey is considering the possibility of monetizing a number of the
transport assets at present owned and operated by the State or certain authorities in, but
not of, the State. These include the New Jersey Turnpike (NJTP), the Atlantic City
Expressway (ACE), the Garden State Parkway (GSP) and Route 440 (between the New
Jersey Turnpike and the Outer Bridge Crossing).
1.2 The State has appointed a financial advisor to help it understand how such a process might
be carried out – and it has appointed Steer Davies Gleave, together with CRA
International (CRAI) and the EDR Group (EDRG), as traffic and revenue advisors. Our
brief is to provide assistance in the estimation of the traffic that might be carried on the
assets, and the toll revenue that might be generated.
1.3 Our overall work for this assignment consisted of two phases:
• Phase 1: Scoping; and
• Phase 2: Asset by Asset Appraisal of Future Traffic and Revenue streams.
1.4 The objective of the Phase 1 work was to prepare an initial review of the likely levels of
traffic and revenue on the target roads across the likely duration of the forecast period.
This work comprised the collection and collation of existing traffic data for each road, an
initial review of the key drivers of future traffic growth and a literature review of elasticity
parameters (a key determinant of traffic responsiveness to changes in tolls).
1.5 In Phase 2 work we have built on the analysis carried out for Phase 1 and developed a
modeling framework that can explore the base assignment to the target facility under a
range of scenarios – and for different traffic types. It has been built to allow sensitivity
testing of a range of factors including values of time – and allows for rapid testing of
different tolling scenarios. We have adopted a number of existing modeling tools to act as
focused network models and have developed separate spreadsheet based revenue models
to focus on the important traffic categories and the choices that road users would face.
Approach and Analysis Undertaken
1.6 In conjunction with our partners at CRAI and EDRG, we have undertaken the following
key tasks as part of both work phases:
• Developed an overview of traffic and revenue on the road assets to understand the
composition of traffic volumes by time of day and location;
• Reviewed the key economic issues and the likely impact on traffic of estimated
growth in key economic parameters;
• Developed a modeling framework to explore the base assignment to the target facility
under a range of scenarios – and for different traffic types;

New Jersey Turnpike & Route 440 Asset Appraisal
2
• Undertaken a number of travel time surveys to assist in the model validation process,
in particular to check that modeled travel times are representative of observed
journey times;
• Undertaken an internet based attitudinal surveys with New Jersey residents to support
our forecasting assumptions; and
• Reviewed relevant North American ‘price elasticity of demand’ studies to assess the
likely impact of toll changes on traffic volumes.
1.7 In carrying out this work we reviewed and relied on third party reports and data without
independent verification. However, in most instances we used recent data collected by
recognized experts or firms with nationally recognized credentials.
Report Contents
1.8 The purpose of this document is to present our traffic and revenue forecasts for the New
Jersey Turnpike and Route 440 and to provide an overview of the key assumptions made
as part of the process to develop these forecasts. A separate report describes the
background to our work and methodology in more detail.
1.9 This document is structured as follows:
• Chapters 2 and 3 provide an overview of the NJTP and Route 440 and present 2006
traffic and revenues for these facilities;
• Chapter 4 presents an overview of our forecasting methodology, discusses key
forecasting issues and summarizes key forecasting assumptions;
• Chapter 5 discusses how future traffic growth rates have been derived and defined;
and
• Chapter 6 presents traffic and revenue forecasts for the facilities.
1.10 Supporting documentation is included in a number of appendices.

New Jersey Turnpike & Route 440 Asset Appraisal
3
2. THE NEW JERSEY TURNPIKE
Project Overview
2.1 As shown in Figure 2.1, NJTP is a 148 mile tolled facility that runs from the south-west to
the north-east of New Jersey. The road opened in 1951 and has been managed and
operated ever since by the New Jersey Turnpike Authority (NJTA). The road forms a key
part of the I-95 corridor which connects the major economic centers along the eastern
seaboard of the United States including Washington D.C, Philadelphia and New York.
2.2 The NJTP commences in the south-west of New Jersey at the Delaware Memorial Bridge
and extends north-east to form part of an orbital route bypassing the city of Philadelphia.
The route then progresses northwards to serve the Newark and New York metropolitan
areas before terminating at the George Washington Bridge, where the I-95 route continues
north through Connecticut.
FIGURE 2.1 NJTP OVERVIEW

New Jersey Turnpike & Route 440 Asset Appraisal
4
2.3 The NJTP has two extensions, the Newark Bay Extension (8.3 miles), which connects into
the Holland Tunnel, providing a connection with Lower Manhattan and the Pennsylvania
Turnpike Extension leading into the Pennsylvania Turnpike from Exit 6 (6.6 miles). The
NJTP has interchanges with nearly all of the major highway routes and major access
points throughout New Jersey, including:
• ACE (Exit 3);
• GSP (Exit 11);
• Newark Liberty International Airport (Exit 13A);
• Holland Tunnel, providing access to New York City/Lower Manhattan (Exit 14); and
• Lincoln Tunnel, providing access to New York City (Exit 16E).
2.4 The NJTP forms part of the major I-95 corridor along the East coast of the United States.
As such, it serves North-South through traffic for commercial and personal vehicles. Its
links with the Port and Airport of Newark make it a major link along the northeast
corridor.
2.5 Within New Jersey, the NJTP links the metropolitan areas surrounding Philadelphia and
New York City. It also serves local commuters traveling into these employment locations.
2.6 Figure 2.2 shows the area served by the northern section of the NJTP in more detail.
Detailed maps showing the location of all entries and exits are included in Appendix A.
FIGURE 2.2 NJTP - OVERVIEW (NORTHERN SECTIONS)
New Jersey Turnpike & Route 440 Asset Appraisal
5
Road Configuration
2.7 The NJTP is a grade-separated limited access freeway with a speed limit of 65 mph in
rural sections (south of Exit 13) and 55 mph in urban sections (north of Exit 13). A
schematic summary of the lane geometry of the NJTP is shown in Figure 2.3.
F
IGURE 2.3 NJTP - LANE GEOMETRY
• South of Exit 4 the facility operates as a 4-lane (2 lanes per direction) highway;
• Between Exits 4 and 8A, NJTP operates as a 6-lane highway (3 lanes per direction)
to cater for the distribution of traffic to and from Philadelphia – traveling on the
NJTP by the Pennsylvania Turnpike Extension (3 lanes per direction) at Exit 6;
• Between Exits 8A and 14, the geometry of the facility widens considerably to allow
for between 10 and 14 lanes of traffic (5-7 lanes in each direction). In this section,
truck traffic is restricted to using the outer lanes (typically 2-3 lanes in each
direction), while the inner lanes (typically 3-4 lanes per direction) are exclusively
available to cars;
• At Exit 14, the Newark Bay Extension diverges from the mainline, providing a 4-lane
highway (2 lanes per direction) serving the Newark/Jersey City area; and
• From Exit 14, the NJTP splits into two spurs. The eastern spur, which serves Newark
Liberty International Airport and Manhattan, provides 6 lanes (3 lanes per direction)
of capacity. The western spur which acts as a bypass around the Jersey City/New
York metropolitan areas is also a 6-lane (3 lanes per direction) highway reducing to 4
lanes (2 lanes per direction) after Exit 18W.
Competing Routes
2.8 Across the length of the NJTP there are a number of competing routes. In the southern
section of the NJTP (between Exits 1 and 7) the I-295 and I-95 compete with the NJTP, as
can be seen in Figure 2.4.
2.9 I-295 runs almost parallel to NJTP between the Delaware Memorial Bridge and Trenton.
The route offers an un-tolled alternative to NJTP for journeys to and from the major
centers of Philadelphia and Trenton. The route has a 60 mph speed limit but does suffer
from considerable peak-hour congestion. Journey time savings carried out by Steer Davies
Gleave show that peak hour average speeds can be as low as 12 mph between Exit 34 and
the Pennsylvania Turnpike. However in the off-peak period, average speeds are much
higher and thus the I-295 provides a much more viable alternative.

New Jersey Turnpike & Route 440 Asset Appraisal
6
2.10 To the south, the I-95 route runs parallel to the NJTP and passes through the city of
Philadelphia. It provides direct access to and from Philadelphia and extends northwards to
form part of an orbital route to the north of Trenton. The predominant speed limit on the
route is 55 mph. Again this route has considerable peak-hour congestion relative to the
NJTP but offers a viable alternative in off-peak periods. Over time this route might
become more attractive with the completion of the interchange between the I-
95/Pennsylvania Turnpike Extension.
FIGURE 2.4 NJTP - COMPETING ROUTES (CENTRAL & SOUTHERN SECTIONS)
2.11 In the central section (between Exits 7 and 11) the only competing route is US Highway 1
(US-1) (see Figure 2.5), which runs parallel to the NJTP through Mercer and Middlesex
counties. US-1 is predominately an ‘at-grade’ facility with a speed limit of 50 mph and
therefore only an attractive alternative to the NJTP for shorter distance and local journeys.
Indeed our travel time survey shows average off-peak period speeds of just 36 mph.
2.12 In the northern section (between Exits 11 and 18E/W) the GSP and US Highway 1/9 (US-
1/9) compete with the NJTP. The GSP runs parallel to the NJTP between Exit 11 and 18E
and can act as an alternative for a number of destinations in the Newark area including
Newark Liberty International Airport. However, the GSP does not provide access to New
York City as does the NJTP.
New Jersey Turnpike & Route 440 Asset Appraisal
7
2.13 US-1/9 runs parallel to the NJTP between Exits 11 and 14. As shown in Figure 2.5, this
un-tolled alternative route competes with the NJTP for key destinations in the Newark
area including Newark International Airport, Elizabeth and Linden. The route provides
predominately ‘at-grade’ access and has a speed limit of 50 mph. Travel time surveys
carried out by Steer Davies Gleave show that even in off peak periods, average speeds are
typically less than 40 mph.
FIGURE 2.5 NJTP - COMPETING ROUTES (NORTHERN SECTION)
2.14 Table 2.1 summarizes the competing routes.
TABLE 2.1 NJTP - SUMMARY OF COMPETING ROUTES
Section Route Lane Geometry Speed Limit (mph)
I-295 3x3 60
Southern Section
(Exits 1 – 7)
I-95 4x4 60
Central Section
(Exits 7 – 11)
US-1 2x2 50
US-1/9 3x3/4x4 50
Northern Section
(Exits 11 – 18E/W)
GSP 5x5 55
Source: NJTA / SDG Analysis

New Jersey Turnpike & Route 440 Asset Appraisal
8
Planned Infrastructure Improvements
2.15 The NJTA plans to expand 20 miles of the NJTP from Exit 6 (Pennsylvania Turnpike)
north to Exit 8A (NJ 32), most likely in a ten-lane (2-3-3-2) configuration. This project
will provide for the construction of an extension to the NJTP’s dual roadway from the
existing merge at Exit 8A to the interconnection of the mainline roadway with the
Pennsylvania Turnpike Extension at Exit 6. This project is scheduled to be completed in
2010. Further widening projects are planned for by the NJTA but have not been
committed to and scheduled. These include the widening between Exits 8A and 11,
between Exits 13 and 13A, and a widening from four to six lanes between Exit 1
(Delaware Memorial Bridge) and Exit 4 (New Jersey Route 73). Figure 2.6 shows
Planned Infrastructure Improvements in New Jersey.
2.16 A connection between the Pennsylvania Turnpike (I-276) and I-95 is planned by the
Pennsylvania Turnpike Commission. After completion of the project, a portion of I-276
will be renamed as I-95, assuring its continuity. As part of this project, I-276 will be
widened from two to three lanes in each direction from the Delaware River to US-1. A
bridge toll will be levied on westbound I-276 traffic after crossing the Delaware River
Bridge, allowing eastbound NJTP traffic to move unimpeded on the new I-95 northbound
into New Jersey. The Pennsylvania Turnpike Commission has indicated that they will
establish a mainline toll collection facility east of the new I-276/I-95 interchange, with E-
ZPass and conventional toll collection lanes. This part of the project is to be completed by
2008. Later phases of the project include the construction of an additional bridge over the
Delaware River to provide three lanes in each direction.

New Jersey Turnpike & Route 440 Asset Appraisal
9
F
IGURE 2.6 PLANNED INFRASTRUCTURE IMPROVEMENTS IN NEW JERSEY

New Jersey Turnpike & Route 440 Asset Appraisal
10
Tolling Regime
2.17 The NJTP operates as a ‘closed’ tolling system where users collect a ticket once entering
the NJTP and then surrender this ticket along with payment when exiting the facility.
Every exit point along the route has an operational toll plaza, making it theoretically
impossible for travelers to use any section of the NJTP without payment.
2.18 Since 2000, an Electronic Toll Collection (ETC) system called E-ZPass has been in
operation on NJTP. The system is governed by the E-ZPass Interagency Group which
oversees the ETC operation across various states and facilities helping to promote free-
flow tolling between collaborating states. Within this structure, NJTA manages its own
billing and customer service center.
2.19 E-ZPass allows vehicles equipped with an E-ZPass tag to drive through designated toll
lanes without the need to stop and manually pay a toll. Currently E-ZPass users have
dedicated lanes prohibited to cash payment but work is under way to incorporate the E-
ZPass technology into all toll lanes so that E-ZPass users are not just restricted to the
designated lanes.
2.20 Tolls are distance based, with the tolling ‘ticket’ system recognizing the entry and exit
point of each vehicle. Tolls are charged differentially according to vehicle size with the
toll classification based on the number of axles. Passenger cars, 2-axle, 3-axle, 4-axle, 5-
axle and 6-axle trucks make up Classes 1-6 respectively.
2.21 On a per mile basis tolls are not uniform across the length of the road with tolls for
movements at the northern end of the road being charged at a higher rate than those at the
southern end.
2.22 Users of the E-ZPass system benefit from an off-peak toll discount of 25%.
2.23 Table 2.2 below provides a matrix of tolls for journeys between some of the key
interchanges on the NJTP. The tolls presented are for Class 1 vehicles (passenger cars)
and for cash paying customers only.
TABLE 2.2 NJTP - 2006 TOLLS FOR SELECTED KEY MOVEMENTS (CLASS 1, CASH
PAYMENT)
Exit 1 Exit 6 Exit 7A Exit 14 Exit 18E
Exit 1 (South Termini) $2.55 $2.15 $5.75 $6.45
Exit 6 (Philadelphia) $2.55 $1.00 $3.75 $5.50
Exit 7A (Trenton) $2.15 $1.00 $2.85 $4.45
Exit 14 (New York) $5.75 $3.75 $2.85 $1.70
Exit 18E (North Termini/New York) $6.45 $5.50 $4.45 $1.70
Source: NJTA

New Jersey Turnpike & Route 440 Asset Appraisal
11
2.24 As mentioned, heavy vehicles are charged more, according to the number of axles on each
truck. A 6-axle truck will typically pay a toll 4.5 times greater than the Class 1 toll
whereas a 2-axle truck will pay a toll twice as much as the car toll.
2.25 There is currently no annual indexation of toll rates to price inflation. Instead toll rates
have only historically increased on an ad-hoc basis. Since 1970, there have only been five
increases with the most recent toll increases occurring in 2000 and 2003.
2.26 In Table 2.3 below we compare average toll rates per mile on NJTP to US average and
maximum toll rates, based on an analysis by WSA of most US toll facilities. Toll rates for
cars on NJTP are below average by US standards. Truck toll rates are roughly in line with
US averages.
TABLE 2.3 NJTP - 2006 AVERAGE TOLL PER VEHICLE MILE, US AVERAGE AND
MINIMUM
Vehicle Type
NJTP Average Toll
($/Mile)
US Average Toll ($/Mile)
US Maximum Toll
($/Mile)
Cars 0.055 0.09 to 0.14 1.00
Trucks 0.22 0.22 1.75
Source: NJTA / SDG Analysis
2006 Traffic Levels
2.27 Wilbur Smith and Associates (WSA) has worked for NJTA for many years, monitoring
the development of traffic and revenue. From their most recent work (which has been
provided to us as part of this study) we have a significant volume of past and present data
on the road. Furthermore NJTA has provided us directly with up-to-date 2006 Transaction
and Revenue Data for the NJTP. Based on this data and our own analysis of the
characteristics of the road, we have established an overview of the following:
• General traffic volumes and characteristics;
• Transactions and revenue by vehicle type;
• Time of day transactions profiles;
• Analysis and observations of traffic patterns on different sections of each road;
• Capacity constraints.
2.28 Data from the North Jersey and South Jersey regional models (NJTPA and SJTPO) and
New Jersey State-wide assignment model enabled us to establish traffic composition by
vehicle type and also enabled us to build up a picture of trip purposes on the NJTP.
Transactions
2.29 In 2006 over 250 million vehicles used the NJTP, equivalent to just over 690,000 vehicles
per day on average. Cars accounted for 85% of transactions, with trucks and buses
accounting for 15% of transactions.

New Jersey Turnpike & Route 440 Asset Appraisal
12
2.30 Figure 2.7 below shows the number of vehicles using the NJTP for the period 1970-2006.
As can be seen, traffic using the NJTP grew steadily from 1970 to 1990 except during the
mid-70s when traffic growth stagnated following the global oil crises of 1973 and 1976.
Traffic growth was rapid in the 1980s until the early 1990s when traffic growth slowed
due to the combination of economic recession and a NJTP toll increase. Since the 1990s,
traffic has continued to grow steadily with the only exception being 2003 when annual
traffic fell following another periodic toll increase.
FIGURE 2.7 NJTP - TRANSACTIONS: 1970-2006
0
50
100
150
200
2
50
300
1970
1971
1972
1973
1974
1975
1976
1977
1978
1979
1980
1981
1982
1983
1984
1985
1986
1987
1988
1989
1990
1991
1992
1993
1994
1995
1996
1997
1998
1999
2000
2001
2002
2003
2004
2005
2006
Year
Transactions (M)
Light Vehicles Heavy Vehicles Total
Source: NJTA / SDG Analysis
2.31 Since 1970, traffic on the NJTP has grown 2.9% per annum on average. Over the same
period light vehicles have grown at an average of 3% per year, while heavy vehicles have
grown by 2.3% per annum. In recent years traffic growth has slowed slightly.
2.32 Table 2.4 overleaf shows that between 1996 and 2006, annual total traffic growth has
slowed to an average of 2.6% per annum, while over the last five years, traffic growth has
slowed to just 1.9% per annum.
2.33 Traffic growth in heavy vehicles has slowed to just 1.3% per annum over the last five
years. However the slow down in traffic growth over the last five years must be placed in
the context of the toll rate increases in late 2000 and 2003 and other events such as 9/11
and the rise in fuel prices.

New Jersey Turnpike & Route 440 Asset Appraisal
13
T
ABLE 2.4 NJTP - ANNUAL AVERAGE TRAFFIC GROWTH (TRANSACTIONS)
Period Light Vehicles Heavy Vehicles Total Vehicles
1970 – 2006 3.01% 2.29% 2.90%
1996 – 2006 2.52% 3.00% 2.58%
2001 - 2006 1.96% 1.29% 1.87%
Source: NJTA / SDG Analysis
2.34 Over time, traffic has not grown uniformly across the length of the NJTP. Figure 2.8
below shows an index of traffic growth by section for the period 1990-2006.
FIGURE 2.8 NJTP - TRAFFIC GROWTH BY SECTION: 1990-2006 (1990 = 100)
90
100
110
120
1
30
140
150
1
990 1991 1992 1993 1994 1995 1996 1997 1998 1999 2000 2001 2002 2003 2004 2005 2006
Year
Index of Daily Transactions
North Central South
Source: NJTA / WSA / SDG Analysis
2.35 As can be seen, traffic growth has been the highest in the southern section of the NJTP,
with traffic growing at 2.3% per annum between 1990 and 2006. In contrast, the more
heavily utilized northern section has grown at a slower rate of 1.4% per annum over the
same period.
2.36 In the southern section traffic has grown most rapidly at the exits offering access and
egress to the Philadelphia conurbation. Exit 3 which intersects I-76 and is the main
arterial access point to the east of Philadelphia has grown at an average of 4.3% per
annum over the past 16 years.
2.37 Exit 6 which intersects with the Pennsylvania Turnpike has witnessed growth of 2.6% per
annum. The exit with the lowest observed growth over the period is Exit 1, which has
seen growth of 1.8% per annum.

New Jersey Turnpike & Route 440 Asset Appraisal
14
Revenue
2.38 2006 revenue totaled nearly $540 million. Light vehicles accounted for 65% of revenue
whereas trucks accounted for 35% of revenue. Figure 2.9 below shows the development
of toll revenue for the period 1970-2006, both in current and 2006 price levels.
F
IGURE 2.9 NJTP - TOLL REVENUE: 1970-2006 ($M)
0
100
200
300
400
500
600
1970
1971
1972
1973
1974
1975
1976
1977
1978
1979
1980
1981
1982
1983
1984
1985
1986
1987
1988
1989
1990
1991
1992
1993
1994
1995
1996
1997
1998
1999
2000
2001
2002
2003
2004
2005
2006
Year
Toll Revenue (Nominal $M)
Toll Revenue (Nominal) Toll Revenue (2006 prices) Year of Toll Increase
Source: NJTA / SDG Analysis
2.39 It can be seen that between 1970 and 1990, real toll revenues stagnated as toll rates failed
to increase at the same rate as price inflation. Only when toll rates were effectively
doubled in March 1991 was there a large surge in real toll revenues and a subsequent fall
in traffic. However since 1991 toll increases have still only remained periodic and as a
result toll revenues through the 1990s remained largely unchanged in real terms. In late
2000 and in 2003 tolls were further increased and this contributed to the increase in real
toll revenues witnessed in these years.
2.40 Thus with no specific indexation of tolls, the cost of using the turnpike has actually fallen
in real terms for users. Figure 2.10 overleaf shows the average real toll (2006 prices)
since 1970. As can be seen the average toll has fallen from $3.68 in 1970 to just $2.13 in
2006 when we express tolls in 2006 prices.

New Jersey Turnpike & Route 440 Asset Appraisal
15
F
IGURE 2.10 NJTP - AVERAGE TOLL PER TRANSACTION: 1970-2006 ($, 2006 PRICES)
0
.00
0.50
1.00
1.50
2.00
2
.50
3
.00
3
.50
4.00
1970
1971
1972
1973
1974
1975
1976
1977
1978
1979
1980
1981
1982
1983
1984
1985
1986
1987
1988
1989
1990
1991
1992
1993
1994
1995
1996
1997
1998
1999
2000
2001
2002
2003
2004
2005
2006
Year
Average Toll ($ - 2006 Prices)
Average Toll (2006 prices) Year of Toll Increase
Source: NJTA / SDG Analysis
2.41 Table 2.5 summarizes traffic and revenue by payment method. The table shows that E-
ZPass transactions currently account for 67% of all transactions on NJTP and nearly 65%
of toll revenue. Over 30% of all transactions are made by vehicles taking advantage of the
E-ZPass toll discount in the off-peak period. Penalty tolls collected following violations
account for 2% of all transactions.
TABLE 2.5 NJTP - 2006 TRAFFIC AND REVENUE BY PAYMENT METHOD
Payment Method Vehicles (M) Revenue ($M)
% of Total
Vehicles
% of Total
Revenue
Cash 79.5 181.7 31% 34%
E-ZPass (Peak) 92.3 193.6 37% 36%
E-ZPass (Off-Peak) 76.6 153.0 30% 28%
Violations 4.2 10.6 2% 2%
Total 252.6 538.9 100% 100%
Source: NJTA / SDG Analysis

New Jersey Turnpike & Route 440 Asset Appraisal
16
Traffic Patterns
2.42 The busiest sections of the turnpike are, as expected, to the north of Exit 11 as the route
approaches the New York and Newark metropolitan areas. The highest observed flow on
the route is the section between Exits 13 and 13A where Average Annual Daily Traffic
(AADT) flows in 2006 were in excess of 250,000 vehicles per day.
2.43 Traffic flows on the Eastern and Western spurs beyond Exit 15 are also very high, with
over 100,000 vehicles per day reported on all sections of both spurs, indicating significant
capacity constraints on what are only 3-lane sections of the Turnpike.
2.44 Figure 2.11 below shows observed 2006 AADT for all sections of the NJTP. Usage
increases on the approaches to Newark and New York are clearly visible.
FIGURE 2.11 NJTP - 2006 AADT BY SECTION
0
50,000
100,000
150,000
2
00,000
2
50,000
3
00,000
1-2
2-3
3-4
4-5
5-6
6-7
7-7A
7A-8
8-8A
8A-9
9-10
10-11
11-12
12-13
13-13A
13A-14
14-SMB
14-14A
14A-14B
14B-14C
SMB-15E E
15E-15W E
15W-15X E
15X-16E E
16E-NMB E
SMB-15E W
15E-15W W
15W-16W W
16W-18W W
18-NMB
Section
AADT
Cars Trucks and Buses
Source: NJTA / SDG Analysis
2.45 Journeys using the full length of the NJTP, that is, ‘through’ journeys entering the system
at Exit 1 and leaving at Exit 18W account for just 1% of total recorded transactions (just
over 7,100 transactions per day on average).
2.46 However, Figure 2.12 shows that through traffic as a proportion of total traffic is
significantly higher at the southern end of the NJTP.

New Jersey Turnpike & Route 440 Asset Appraisal
17
F
IGURE 2.12 NJTP - 2006 THROUGH-TRAFFIC BY SECTION (% OF AADT)
0%
2%
4%
6%
8%
10%
12%
14%
1
6%
1
8%
1-2
2-3
3-4
4-5
5-6
6-7
7-7A
7A-8
8-8A
8A-9
9-10
10-11
11-12
12-13
13-13A
13A-14
14-SMB
SMB-15E W
15E-15W W
15W-16W W
16W-18W W
18W-NMB
Sections
Proportion of Through Traffic
Source: NJTA / SDG Analysis
Trip Length Distribution
2.47 Figure 2.13 shows the cumulative trip length distributions for cars and trucks and buses
combined. The average trip length for cars is 22.9 miles, for trucks and buses it is 26.6
miles. These are very low compared to the length of the road and are due to a large
volume of relatively short distance trips in the northern part of the road and a relatively
low percentage of through trips.

New Jersey Turnpike & Route 440 Asset Appraisal
18
F
IGURE 2.13 NJTP - 2006 CUMULATIVE TRIP LENGTH DISTRIBUTION
Source: NJTA / SDG Analysis

New Jersey Turnpike & Route 440 Asset Appraisal
19
Trip Purpose Distribution
2.48 We used the NJTPA to extract trip patterns by journey purpose. Figure 2.14 shows the
proportion of commuting trips into New York and Philadelphia for each section on the
NJTP. It can be seen that commuting flows into Philadelphia are important between Exits
5 and 11 only, but influence traffic levels elsewhere on the NJTP to a lesser extent.
Commuting flows into NY on the other hand are much more stable across the length of
the road, suggesting a much larger area from which people commute.
FIGURE 2.14 NJTP - ESTIMATED COMMUTING TRIPS BY SECTION (% AADT)
0%
2%
4%
6%
8%
10%
12%
14%
16%
1
8%
1-2
2-3
3-4
4-5
5-6
6-7
7-7A
7A-8
8-8A
8A-9
9-10
10-11
11-12
12-13
13-13A
13A-14
14-SMB
SMB-15E W
15E-15W W
15W-16W W
16W-18W W
18W-NMB
Sections
Proportion of Commuters
To/From New York To/From Philadelphia
Source: NJTA / SDG Analysis
Hourly Traffic Profiles
2.49 The high density of traffic in the northern section of NJTP naturally affects the profile of
traffic throughout the day. Figure 2.15 shows the hourly traffic profile for vehicles using
Exit 14C (heading into New York). With an urban intersection such as Exit 14C, there are
clearly defined peak periods in the morning and evening. However it is apparent that
these peak periods are relatively wide in the sense that peak traffic flows are maintained
over several hours. This is a common observation for congested links in urban areas and
particular affects the evening peak where in this instance peak conditions appear to
commence as early as 4:00 PM and finish as late as 7:00 PM.

New Jersey Turnpike & Route 440 Asset Appraisal
20
F
IGURE 2.15 NJTP - 2006 HOURLY TRAFFIC PROFILE EXIT 14C
0
500
1
,000
1
,500
2,000
2,500
3
,000
00:30
01:00
01:30
02:00
02:30
03:00
03:30
04:00
04:30
05:00
05:30
06:00
06:30
07:00
07:30
08:00
08:30
09:00
09:30
10:00
10:30
11:00
11:30
12:00
12:30
13:00
13:30
14:00
14:30
15:00
15:30
16:00
16:30
17:00
17:30
18:00
18:30
19:00
19:30
20:00
20:30
21:00
21:30
22:00
22:30
23:00
23:30
24:00
P
eriod End Time
Average Daily Traffic
Total Car Truck
Source: NJTA / SDG Analysis
2.50 In the southern sections of the NJTP, smaller peak periods are observed because of the
lower incidences of congestion. Figure 2.16 shows the hourly profile of traffic using Exit
8A. As can be seen, the peak periods are no less defined but clearly take place over a
much more narrow time period. For example, the PM peak period commences at 4:30 PM
and finishes at 6:30 PM, an hour less of peak conditions than that seen at Exit 14C.
FIGURE 2.16 NJTP - HOURLY TRAFFIC PROFILE EXIT 8A
0
500
1,000
1,500
2,000
2,500
00:30
01:00
01:30
02:00
02:30
03:00
03:30
04:00
04:30
05:00
05:30
06:00
06:30
07:00
07:30
08:00
08:30
09:00
09:30
10:00
10:30
11:00
11:30
12:00
12:30
13:00
13:30
14:00
14:30
15:00
15:30
16:00
16:30
17:00
17:30
18:00
18:30
19:00
19:30
20:00
20:30
21:00
21:30
22:00
22:30
23:00
23:30
24:00
Period End Time
Average Daily Traffic
Total Car Truck
Source: NJTA / SDG Analysis

New Jersey Turnpike & Route 440 Asset Appraisal
21
2.51 In contrast, on certain sections of NJTP, traffic is relatively more stable across the day
with less well defined peak periods. An example of this is Exit 18W where traffic
movements will tend to be relatively longer-distance trips traveling beyond the Newark
and New York metropolitan area with relatively fewer commuter trips. Figure 2.17 shows
how this is reflected in the profile of traffic over the day. As can be seen, at Exit 18W,
there is clearly not the same significant decrease in flow in the period between the AM
and PM peaks. Instead, traffic flows remain relatively constant across the whole day.
FIGURE 2.17 NJTP - HOURLY TRAFFIC PROFILE EXIT 18W
0
500
1,000
1,500
2,000
2,500
3,000
3,500
00:30
01:00
01:30
02:00
02:30
03:00
03:30
04:00
04:30
05:00
05:30
06:00
06:30
07:00
07:30
08:00
08:30
09:00
09:30
10:00
10:30
11:00
11:30
12:00
12:30
13:00
13:30
14:00
14:30
15:00
15:30
16:00
16:30
17:00
17:30
18:00
18:30
19:00
19:30
20:00
20:30
21:00
21:30
22:00
22:30
23:00
23:30
24:00
Hour
Average Daily Traffic
Total Car Truck
Source: NJTA / SDG Analysis
Monthly Traffic Profiles
2.52 Traffic flows on the NJTP vary across the year and transaction activity at a number of
exits is shown in Figure 2.18. It can be seen that the monthly variations in traffic flow are
more profound away from urban areas where frequent commuter flows allow traffic levels
to remain relatively stable across the year.
2.53 This explains the relative flatness in the profile of Exit 16E which predominately serves
New York City. In contrast, less frequently used plazas in the South typically show more
seasonal variation, particularly during the winter months when discretionary trips like
those taken for leisure purposes normally fall. This appears to be the case for Exit 1,
although the difference is not as pronounced as that seen on the ACE and southern
sections of the GSP.

New Jersey Turnpike & Route 440 Asset Appraisal
22
F
IGURE 2.18 NJTP - MONTHLY TRAFFIC PROFILE EXIT1, EXIT 6 & EXIT 16E
0%
2%
4%
6%
8%
10%
12%
JAN FEB MAR APR MAY JUN JUL AUG SEP OCT NOV DEC
Month
Proportion of Annual Traffic
Exit 1 Exit 6 Exit 16E
Source: NJTA / SDG Analysis
Traffic Speeds and Congestion
2.54 As we have mentioned, in some sections of the NJTP, the route is typically serving in
excess of 200,000 vehicles per day. At such traffic flows, highway capacity constraints
will be binding and traffic speeds can be affected. The U.S. Highway Capacity Manual
(HCM) uses the concept of Level of Service (LOS) as a qualitative measure of describing
the extent of capacity problems on a section of highway. The HCM adopts a sliding scale
of LOS ranging from LOS A which represents almost entirely free-flow conditions to
LOS F which in contrast describes breakdowns in vehicular flow which result in
significant recurring congestion.
2.55 On a multi-lane grade-separated highway like NJTP, occurrences of LOS F are extremely
rare and instead a clearer understanding of the extent of capacity problems on NJTP can
be obtained by measuring if LOS D volumes are being observed. LOS D is believed to be
the point at which free-flow speeds begin to significantly decline and even minor incidents
can create queuing. Table 2.6 compares observed peak hour directional volumes on each
section of the NJTP to the equivalent service volumes at which LOS D typically occurs.
We adopted a link capacity of 2,250 vehicles/hour/lane to correspond to flow levels at
which HCM recommends a LOS D.

New Jersey Turnpike & Route 440 Asset Appraisal
23
T
ABLE 2.6 NJTP - 2006 PEAK HOUR SERVICE LEVELS
Section
Observed Peak
Hour Volumes
LOS D Service Volumes
Volume/LOS D Service
Volume (%)
1 – 2 1,563 4,500 35%
2 - 3 2,134 4,500 47%
3 - 4 2,318 4,500 52%
4 - 5 2,816 6,750 42%
5 - 6 2,856 6,750 42%
6 - 7 3,880 11,250 34%
7 – 7A 4,135 11,250 37%
7A - 8 5,045 11,250 45%
8 – 8A 5,513 11,250 49%
8A-9 6,786 11,250 60%
9 - 10 7,357 13,500 54%
10 – 11 7,115 13,500 53%
11 - 12 8,674 15,750 55%
12 - 13 8,868 15,750 56%
13 – 13A 8,773 15,750 56%
13A - 14 8,597 15,750 55%
14 - SMB 8,289 20,250 41%
SMB – 15E W 4,206 6,750 62%
15E – 15W W 4,498 6,750 67%
15W – 16W W 4,861 6,750 72%
16W – 18W W 2,677 6,750 40%
18 W - NMB 2,570 4,500 57%
Source: Highway Capacity Manual (TRB) / NJTA / SDG Analysis
2.56 In the northern sections of the road, it is apparent that peak hour volumes are close to the
LOS D threshold. Given that the volumes presented in the table above are average annual
peak hour volumes, it is likely that at various times of the year the northern section of the
route is experiencing LOS D or lower. In contrast, the southern sections of the road have
less capacity issues with the ratio of volume to LOS D service volume only ranging from
roughly 35% to 60%.
2.57 Analysis of the 2006 tolling system data provides further evidence of relatively less
capacity in the northern sections. Table 2.7 shows average traffic speeds in the AM Peak
over a range of sections on NJTP.

New Jersey Turnpike & Route 440 Asset Appraisal
24
T
ABLE 2.7 NJTP - AVERAGE AM PEAK TRAFFIC SPEED BY SECTION (MPH)
Section Northbound Speed (mph) Southbound Speed (mph)
1 - 3 60.0 69.0
3 - 7 65.4 68.1
7 - 9 65.2 70.9
9 - 11 54.4 54.8
11 - 14 45.1 61.3
14 – 18E 50.7 54.9
14 – 18W 49.6 58.0
14 – 14C 24.7 55.6
Source: NJTA / SDG Analysis
2.58 As can be seen, average peak time traffic speeds are typically below 55 mph in the
Newark/New York area. On the Newark Bay Extension between Exits 14 and 14 C,
average inbound traffic speeds are reported to be as low as 25 mph, these low speeds
through the Newark Bay Extension are believed to produce incidences of downstream
queuing on the main sections of NJTP, particularly in the event of traffic incidents such as
breakdowns and accidents. As expected, the effect of reduced capacity is mainly
restricted to the peak periods.
2.59 Figure 2.19 below shows a profile of average journey speeds over 30 minute periods
across the day for southbound journeys between Exit 16E and Exit 6. This data was made
available for 2 weeks in October 2006. As can be seen, there is clearly deterioration in
level of service in the evening peak period when the outbound flow from the New York
and Newark areas are at their highest. Speeds during the off-peak periods remain
relatively stable
FIGURE 2.19 NJTP - AVERAGE WEEKDAY TRAFFIC SPEEDS BETWEEN EXIT 16E AND
EXIT 6 FOR SOUTHBOUND JOURNEYS (MPH)
20
25
3
0
35
40
4
5
50
5
5
60
65
70
0:30
1:00
1:30
2:00
2:30
3:00
3:30
4:00
4:30
5:00
5:30
6:00
6:30
7:00
7:30
8:00
8:30
9:00
9:30
10:00
10:30
11:00
11:30
12:00
12:30
13:00
13:30
14:00
14:30
15:00
15:30
16:00
16:30
17:00
17:30
18:00
18:30
19:00
19:30
20:00
20:30
21:00
21:30
22:00
22:30
23:00
23:30
0:00
Time Period
AverageSpeed(mph)
Source: NJTA / SDG Analysis

New Jersey Turnpike & Route 440 Asset Appraisal
25
2.60 Figure 2.20 shows a similar chart for northbound journeys. Here speeds are plotted for
journeys from Exit 9 to Exit 16. As can be seen there is a clearly defined deterioration in
speeds in the AM period.
FIGURE 2.20 NJTP - AVERAGE WEEKDAY TRAFFIC SPEEDS BETWEEN EXIT 9 AND EXIT
16E FOR NORTHBOUND JOURNEYS (MPH)
20
2
5
30
35
40
4
5
5
0
5
5
60
65
0:00
0:30
1:00
1:30
2:00
2:30
3:00
3:30
4:00
4:30
5:00
5:30
6:00
6:30
7:00
7:30
8:00
8:30
9:00
9:30
10:00
10:30
11:00
11:30
12:00
12:30
13:00
13:30
14:00
14:30
15:00
15:30
16:00
16:30
17:00
17:30
18:00
18:30
19:00
19:30
20:00
20:30
21:00
21:30
22:00
22:30
23:00
23:30
Time Period
Average Speed(mph)
Source: NJTA / SDG Analysis

New Jersey Turnpike & Route 440 Asset Appraisal
26
Behavioral Research
2.61 As part of our literature review we concluded that it would be worthwhile undertaking
fieldwork to compare the markets served by the three roads of interest, and possibly also
to gather evidence on other key issues that the modeling process should address.
2.62 An online survey was undertaken to provide fresh evidence on certain key issues of
relevance to the study. As part of the survey, 333 NJTP users were interviewed between
Friday 16th March and Tuesday 20th March 2007. Further details of the survey
methodology and analysis can be found in Appendix C of the Background Report,
Behavioral Research.
2.63 Overall, the picture that emerges of NJTP users is that they are generally not deterred
from using it by the inconveniences of tolls, stress and congestion, and they are not very
sensitive to the price of the tolls at their present level. While NJTP users are undoubtedly
sensitive to the idea of the tolls going up, the survey presents an accumulation of findings
which show that currently many of them do not worry about the price of the tolls.
2.64 The NJTP users included a larger proportion of people with household income over
$100,000 pa, with more than a third of them classifying themselves in this category,
compared to about a quarter in the case of users of the GSP and the ACE. Of the NJTP
users, 43% lived in NJ, 41% in New York, and the remainder in the adjoining states of
Pennsylvania, Delaware and Connecticut.
2.65 While the NJTP users were more likely to complain of poor value for money, more likely
to experience congestion, and more likely to describe driving on the road as stressful,
compared to the users of the GSP and the ACE, these are all things that might have been
expected. The more significant findings were that most NJTP users (56%) described the
value for money of the tolls as being “average”, many of them do not think about how
much they spend on tolls, and congestion did not feature as a significant reason for using
the road less.
2.66 NJTP users were more likely to describe their recent trips on the road as important,
compared to users of the other roads, and they were also more likely to actually use the
NJTP and to reject alternative routes, compared to users of the GSP and the ACE. The
main alternative given to making a particular trip on the NJTP was to still use the NJTP,
but at a different time of day.
2.67 While the NJTP users tended to spend more on road tolls than users of the other toll roads
and tended to be more conscious of this spend, about half of NJTP users with E-ZPass do
not normally think about the cost of using the road (this proportion was even higher for
users of the other roads). The evidence on value of time showed that the proportion of
people with medium or high values of time was higher for the NJTP users than for the
users of the other roads, and the direct questions about toll price changes suggested that
the NJTP users may be less likely to change their behavior in response to toll price rises
than users of the other roads.

New Jersey Turnpike & Route 440 Asset Appraisal
27
2.68 Individuals did not report big changes in their usage of the toll roads, and the reasons
given for changes in usage were dominated by changes in personal circumstances. The
evidence suggests that there has been a slight worsening in congestion on the NJTP over
the last two years, but there is also evidence that the deterioration of conditions on
alternative routes has been at least as bad over the same time period.
2.69 When asked about changes to the tolls over the past two years (there have not been any
significant changes), only about 40% of the NJTP users correctly answered that the tolls
had not changed - most of the rest responded that the tolls had gone up, with 10% saying
that “tolls are now much higher” compared to two years ago. This adds to the impression
that many NJTP users do not have a clear idea of how much they are paying and whether
or not it has been changing.
2.70 The survey suggests that the gasoline price rises over the past two years have not had a big
impact on people’s use of the NJTP, and that many people would adapt to future gas price
increases by switching to vehicles with greater fuel-efficiency.

New Jersey Turnpike & Route 440 Asset Appraisal
28
Summary
• The NJTP is a 148 mile tolled facility which forms a crucial link through the state of
New Jersey and forms part of the I-95 corridor which connects the major centers on
the eastern seaboard of the USA;
• The facility intersects with the major highway routes within New Jersey including the
GSP and the Holland and Lincoln Tunnels providing access to New York City;
• NJTP is a limited access interstate-standard facility with a speed limit of 65 mph in
rural areas and 55 mph in urban areas. The number of lanes range from two per
direction in the south of the facility to seven lanes per direction in the northern
sections;
• NJTP has a number of alternative and competing routes. In the south, a network of
Interstate routes run parallel to the NJTP and serve the major centers of Philadelphia
and Trenton. In the north, less obvious alternatives are available, particularly for
access and egress to New York City. NJTP faces limited competition from the GSP
and US-1/9;
• NJTPA operates a ‘closed’ tolled system with toll plazas in operation on each NJTP
exit. Payment can be made in cash or by E-ZPass - the ETC system in place on the
facility. Vehicles with E-ZPass transponders receive a toll discount of roughly 25%
if they travel in the off peak period;
• The NJTP is an existing road and has been open for decades. As a result we have
precise knowledge about the amount of traffic that is currently carried by the road
and how much toll revenue is collected;
• Historic transaction data allows us to consider how traffic levels have changed over
time, how traffic has responded in the past to changes in toll rates and what the
relation between traffic on the NJTP and past economic growth has been;
• Traffic has grown steadily on NJTP since opening in 1951. Since 1970 annual traffic
growth has been 2.9% per annum. However in the last ten years traffic growth has
slowed slightly to 2.6% per annum, but it must be noted that this period has been
punctuated with two toll increases;
• The major traffic patterns observed on the NJTP are also understandably
concentrated in the north of the facility: with an average trip length of 22.9 miles for
cars and 26.6 for trucks and buses and the 10 most recorded entry and exit
movements all internal to the New York/Newark area accounting for 22% of all
transactions. Through traffic using the whole length of the facility accounts for just
1% of all movements;

New Jersey Turnpike & Route 440 Asset Appraisal
29
• Traffic growth has been most rapid in the central section of the route, while growth in
the north of the facility has stagnated – a possible cause of which is the growing
congestion and capacity problems in this section;
• Capacity constraints are evident as the route reaches the Newark/New York
metropolitan areas where traffic flows will typically reach in excess of 200,000
vehicles per day and average daily speeds can reach as low as 30 mph in peak
periods;
• The obvious congestion in the northern section of the facility appears to have
produced ‘peak spreading’ with peak conditions observed for several hours in the
morning and evening peaks;
• Toll increases have not been rigidly indexed to consumer prices and as a result NJTP
tariffs have failed to keep pace with inflation and the growth in real toll revenues has
been just 1.2% per annum since 1970 (2006 prices); and
• 65% of toll revenue is generated from car tolls with the remaining 35% generated
from truck tolls. E-ZPass usage accounts for 67% of all transactions and 65% of toll
revenue.
• A key issue is to understand how traffic levels will be changing over time and what
the impact of capacity constraints are. Important inputs into this process are
assumptions with regards to economic growth, population, and major developments
(mainly port and infrastructure) that are planned to take place in the study area or
surroundings and that may impact on traffic levels.

New Jersey Turnpike & Route 440 Asset Appraisal
30
3. ROUTE 440
Project Overview
3.1 Route 440 is a 13-mile un-tolled facility which extends from Exit 10 of the NJTP to
Hudson County, passing through Staten Island. It links I-287 to the area around Jersey
City where motorists can access New York City through Lincoln Tunnel.
3.2 The purpose of this section is to report on the 4 mile section between milepost 0 (MP 0) at
the intersection with the New Jersey Turnpike, to milepost 3.98 (MP 3.98) at the western
end of the presently tolled Outerbridge Crossing.
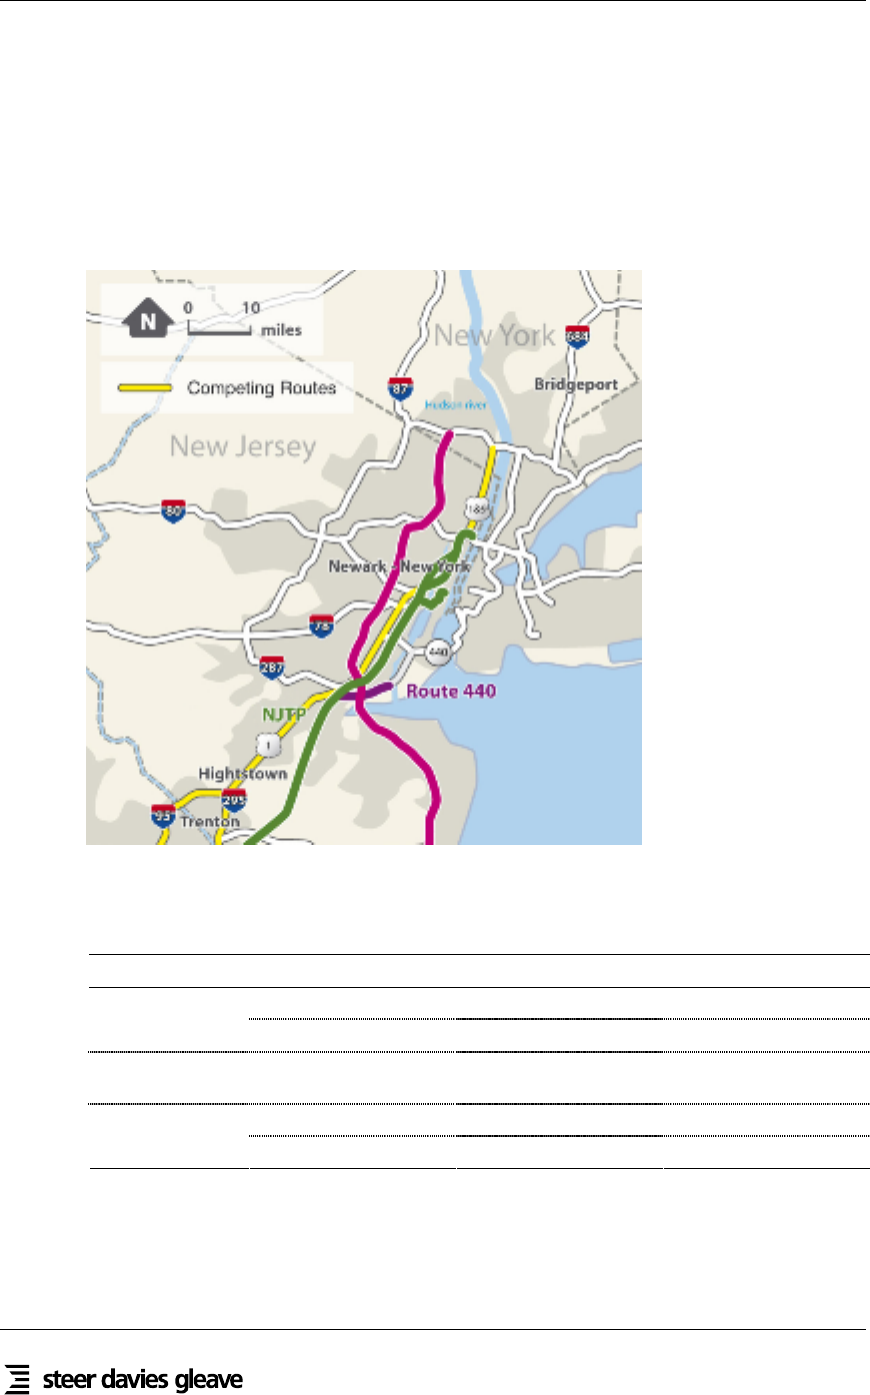
3.3 There are no major “free” alternatives to this section of Route 440. For journeys within
New Jersey, for instance for motorists traveling between Perth Amboy and Edison, the
only major alternative route is to drive along a combination of US-9 or GSP and the
NJTP. This is considerably longer than using Route 440 and presently incurs one, if not
two, toll charges. For vehicles traveling between Staten Island and New Jersey, the only
alternative is to divert north to Goethals Bridge which is also tolled.
FIGURE 3.1 ROUTE 440 – LOCATION AND COMPETING ROUTES

New Jersey Turnpike & Route 440 Asset Appraisal
31
3.4 The facility is a grade-separated freeway with a speed limit of 55 mph. The lane geometry
of Route 440 can be summarized as follows:
• From the intersection with the NJTP to the intersection with US-9 and the GSP,
Route 440 operates as a 7-lane highway (4 lanes westbound and 3 eastbound);
• Between the GSP intersection and State St, immediately before the Outerbridge
Crossing, the facility operates as a 6-lane highway (3 lanes per direction); and
• From State Street onto the Outerbridge Crossing into Staten Island, the facility
operates as a 4-lane highway (2 lanes per direction); and
• The rest of Route 440, from Staten Island to where it ends in Hudson County, is a 4-
lane highway (2 lanes per direction).
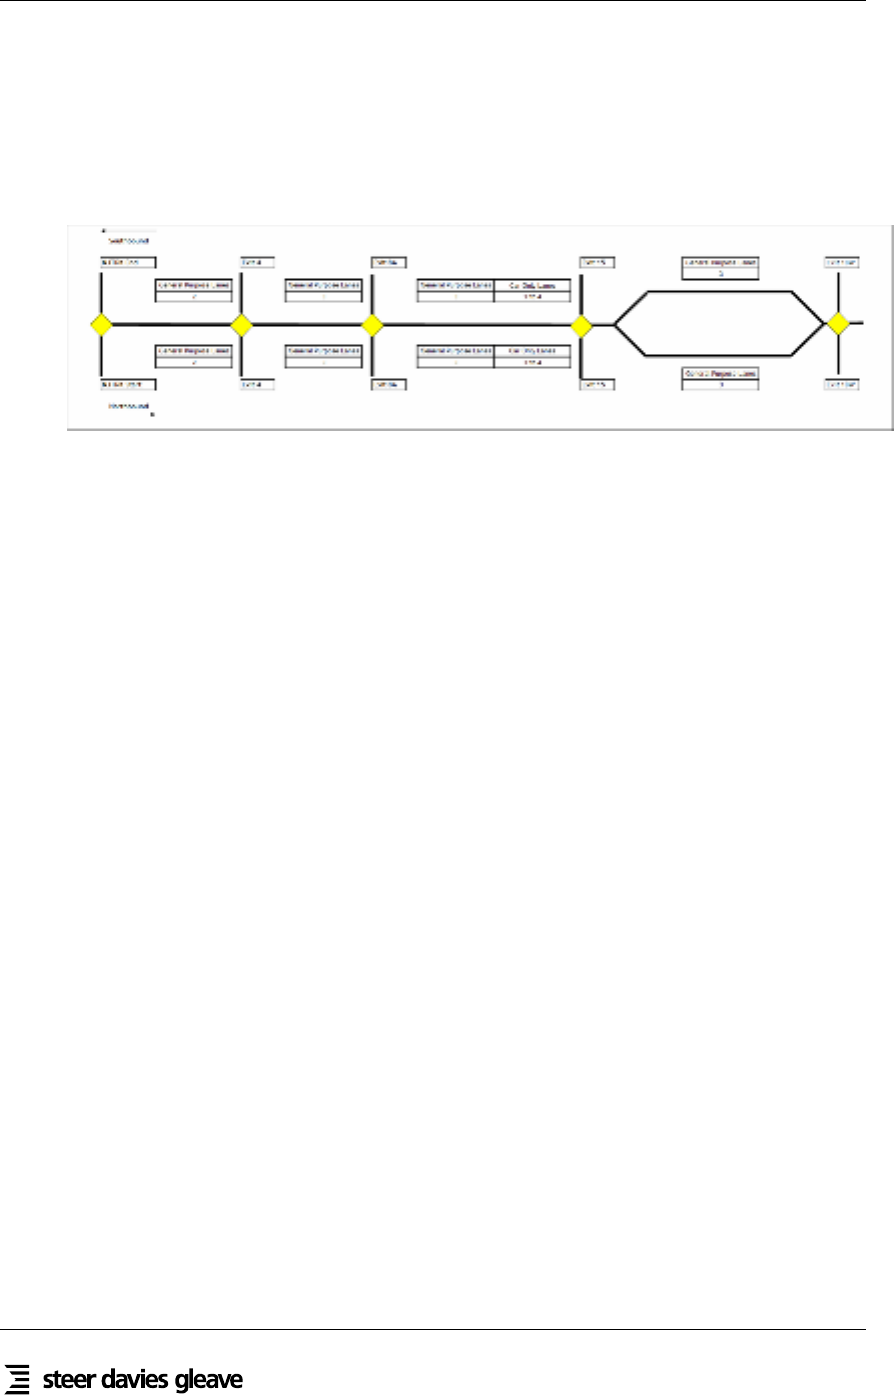
3.5 A schematic summary of the lane geometry of this part of Route 440 is shown in Figure
3.2 below.
FIGURE 3.2 ROUTE 440 - LANE GEOMETRY (MP 0 TO MP 5.2)
W
E
MP 0
Interchange
Interchange
MP 5.2
To western
New Jersey
General
Purpose Lanes
General
Purpose Lanes
General
Purpose Lanes
To Staten
Island
4
3
2
I-287
Outerbridge Crossing
General
Purpose Lanes
General
Purpose Lanes
General
Purpose Lanes
3
3
2
Rt. 440 Start
US-9 / GSP
State Street
3.6 The section of Route 440 studied provides motorists with a direct link from Exit 10 of the
NJTP to Staten Island, by way of the Outerbridge Crossing. Vehicles with two axles
traveling on this bridge pay a $6 toll when traveling eastbound during peak hours ($5 for
E-ZPass users). From Staten Island, motorists can drive on Route 440 into Brooklyn using
the Verrazano-Narrows Bridge. The majority of users of the facility are traveling to and
from the eastern or southern part of New Jersey and the New York City area.

New Jersey Turnpike & Route 440 Asset Appraisal
32
Tolling Regimes
3.7 Route 440 is currently an un-tolled highway, although vehicles do incur a charge to use
the Outerbridge Crossing. This bridge toll means that journeys between central New
Jersey and Staten Island are, in effect, already tolled. Other journeys not using the
Outerbridge Crossing are toll free.
3.8 Consultants Michael Baker Jr., Inc. (Baker) produced a report in 2006
1
that presents an
evaluation of toll collection options along Route 440 between the NJTP (MP 0) and the
Outerbridge Crossing (MP 5.2). Feasibility, right-of-way impact, environmental impact
and cost were examined for twelve different options.
3.9 The recommended solution in the Baker Report is an ETC option. This solution
simultaneously maximizes revenue and minimizes capital expenditure while also
minimizing right-of-way and environmental impacts.
3.10 We have assumed the following toll rates will apply, in line with those charged on the
NJTP (2006 prices).
• Cars: $0.12/mile
• Trucks: $0.45/mile
Traffic Trends
3.11 Figure 3.3 shows AADT for the period 1981-2005.
1
Engineering and Right of Way Assessment for New Jersey State Route 440 (M.P. 0.0 to M.P. 5.2), December 2006

New Jersey Turnpike & Route 440 Asset Appraisal
33
F
IGURE 3.3 ROUTE 440 - AADT OUTERBRIDGE CROSSING: 1981 - 2005
0
10,000
20,000
30,000
40,000
50,000
60,000
7
0,000
8
0,000
90,000
100,000
1981
1982
1983
1984
1985
1986
1987
1988
1989
1990
1991
1992
1993
1994
1995
1996
1997
1998
1999
2000
2001
2002
2003
2004
2005
Year
AADT
Source: NJDOT / SDG Analysis
3.12 As shown in Table 3.1 below, AADT at the Outerbridge Crossing on Route 440 has risen
from 44,000 in 1981 to 85,000 in 2005. This average annual increase of 2.7% is less than
the growth reported for the NJTP. Specifically, there are two periods when traffic
decreased. The toll increases on the Outerbridge Crossing (which for eastbound 2-axle
vehicles went from $3 to $4 in 1990, to $5 in 1991 and to $6 in 1993), explain that there
were fewer trips made across the tolled Outerbridge Crossing in the first half of the
nineties. The period following the 9/11 events also impacted the economy and the attitude
towards traveling, which explains the decrease in traffic during that time. In addition,
heavy maintenance work was carried out on the bridge’s deck on 2003, which also
explains the decrease during that time.
TABLE 3.1 ROUTE 440 - OUTERBRIDGE AADT AVERAGE ANNUAL GROWTH: 1981 -
2005
Year
AADT Beginning of
Period (thousands)
AADT End of Period
(thousands)
Average Annual
Growth
1981 – 1985 44 58 5.6%
1986 – 1990 61 70 2.9%
1991 – 1995 71 71 0.1%
1996 – 2000 74 83 2.2%
2001 - 2005 82 85 0.9%
1981 - 2005 44 85 2.7%
Source: NJDOT / SDG Analysis

New Jersey Turnpike & Route 440 Asset Appraisal
34
3.13 We have used the State-wide model to derive traffic flows for the section of route between
the GSP and the NJTP – Table 3.2 below provides a summary of our assumptions.
However, going forward, we would recommend undertaking traffic counts at this site to
verify our assumptions.
TABLE 3.2 ROUTE 440 - ASSUMED AADT BY SECTION AND VEHICLE TYPE
Section Cars Trucks Total
NJTP-GSP 76,897 6,870 83,767
GSP- Crossing 78,402 7,004 85,406
Source: State-wide model / SDG Analysis
3.14 Figure 3.4 presents the hourly traffic profile by direction for Route 440. The main peak in
the AM period represents users traveling northbound, into New York. In the PM period,
the main peak represents southbound commuters, traveling into northern New Jersey.
FIGURE 3.4 ROUTE 440 - BI-DIRECTIONAL HOURLY TRAFFIC PROFILE
0
500
1,000
1,500
2
,000
2,500
3,000
3
,500
4
,000
4,500
5
,000
01:00
02:00
03:00
04:00
05:00
06:00
07:00
08:00
09:00
10:00
11:00
12:00
13:00
14:00
15:00
16:00
17:00
18:00
19:00
20:00
21:00
22:00
23:00
24:00
Period End Time
Traffic
Northbound Southbound
Source: Baker / SDG Analysis

New Jersey Turnpike & Route 440 Asset Appraisal
35
4. THE FORECASTING METHODOLOGY
Introduction
4.1 We have developed a modeling framework that can explore the base assignment to the
target facility under a range of scenarios – and for different traffic types. The key issue for
the NJTP concession is to understand how traffic levels will be changing over time and
what the impact of capacity constraints are. Important inputs into this process are
assumptions with regards to economic growth, population, and major developments
(mainly port and infrastructure) that are planned to take place in the study area or
surroundings and that may impact on traffic levels.
4.2 The central component of the modeling framework is a spreadsheet based revenue model
– this has been built to allow testing of different tolling scenarios and to carry out a wide
range of sensitivity tests to explore the impact on demand and revenue of a range of
factors including growth rates, values of time, changes in trip distribution etc. Our
forecasting methodology is illustrated in Figure 4.1 below.
FIGURE 4.1 FORECASTING METHODOLOGY
STATEWIDE MODEL
Trip Distribution
Traffic Assignment
TRAFFIC FLOWS
(Scenario 1,2,3,…,n
REVENUE MODEL
Price Elasticity
Growth
WILLINGNESS TO PAY
FORECASTS
Scenario 1
O
RIGIN-DESTINATION
PATTERNS
(Car Matrices by trip
p
urpose - income and
truck matrices
GROWTH FACTORS
TOLL SCENARIOS
TOLL SCENARIOS 2
TOLL SCENARIOS 1
OBSERVED TRAFFIC
2006 transactions
Database
4.3 The model uses observed 2006 toll demand and revenue data as a basis from which future
year forecasts are derived. Within the model demand and revenue are segmented by:
• Geography (toll plazas and toll barriers);
• Time of day (AM Peak, PM Peak, Off-Peak);
• Day of Week (Weekday and Weekend);
• Vehicle Type (Cars and Trucks);
• Payment Method (Cash, E-ZPass); and
• Journey Purpose (Work and Other).

New Jersey Turnpike & Route 440 Asset Appraisal
36
4.4 We have adopted a number of existing modeling tools to inform the revenue model in
terms of:
• Impact of congestion;
• Changes in trip distribution;
• Diversion; and
• Traffic Growth.
4.5 The network models used are an updated version of the State-wide model, which was
initially developed over 10 years ago as an all day (24 hour) traffic assignment model.
For the purpose of our assignment, we have updated the trip tables, road network (base
and future) and assignment procedures.
4.6 The trip tables were updated with the information on trip patterns (Origin- Destination
and Journey Purpose split by time of the day) from the NJTPA and SJTPO. Car trips were
segmented into two journey purposes (home based work and other), with both journey
purposes split into four income groups. The four income groups are based on county-level
Census 2000 household income levels that fit into the income ranges of the four income
groups identified in the NJTPA (values grown to 2000). Commercial vehicles were
treated as one segment.
4.7 The road network for the area comprises the freeway, arterial and collector facilities.
Each road link contains information on the number of lanes, free flow speeds, capacity,
volume-delay relationships and toll charges at toll plazas. The link characteristics were
updated to reflect coding of the NJTPA and SJTPO networks for significant roads. Also a
future 2025 year network was built which incorporates those planned infrastructure
improvements in the New Jersey area that could have a significant impact on the road
network.
4.8 The link volume-delay relationships and factors to convert hourly capacity into each time
period were reviewed and updated using recent traffic count travel time data collected
specifically for the purpose of this assignment. The re-calibrated volume delay functions
provided a significantly improved fit to the observed travel time data.
4.9 The third component is the assignment process used to estimate how origin-destination
demand will route itself over the available network facilities. The vehicle (auto and truck)
assignments are based on a process that iterates until network or passenger travel times are
in equilibrium. The resulting outputs include vehicle (auto and truck) network volumes,
travel times and costs.

New Jersey Turnpike & Route 440 Asset Appraisal
37
Impact of Toll Changes and Congestion
4.10 There are several ways in which people can adapt to a change in toll levels and increased
levels of congestion, as follows:
• Time period - in the case of relative changes in the tolls applying to specific time
periods or congestion occurring at specific times;
• Route - in many cases, however, alternative routes offer considerably longer and
more uncertain journey times;
• Vehicle occupancy - ride sharing can reduce the trip costs per passenger / reduce
congestion;
• Mode - flying for long-distance through passenger traffic, rail for certain other
Origin-Destination (O-D) combinations (the NJ Transit rail network focuses on trips
to and from New York);
• Destination - in some cases people might consider going to a different city if there is
a big difference in the cost of the trip or congestion levels; and
• Activity - some people might offset the higher costs of travel by doing the activity
less often, or not at all.
4.11 Recent research by Ozbay et al
2
on the behavioral response to the time of day pricing
initiative on the NJTP showed that the most common responses to increased peak-hour
tolls and reduced off-peak tolls were to travel by alternative routes, to reduce use of the
NJTP, to increase ride sharing, and to increase travel in off-peak periods. However it is
important to note that approximately 93% of individuals did not change their travel
behavior at all in response to the changes to the toll schedule in the year 2000. The
research concluded that faced by a small differential between peak and off-peak tolls
being introduced, the demand was very inelastic.
4.12 Our modeling framework currently handles route choice and changes in travel times. Trip
suppression is due to changes in vehicle occupancy, mode-shifting, destination and
activity changes are not currently modeled explicitly, but we do allow for trip suppression
due to capacity constraints. However, we have checked the implied elasticities from the
model are reasonable compared to evidence from other roads.
2
Ozbay, K., J. Holguín-Veras, O. Yanmaz-Tuzel, S. Mudigonda, A. Lichtenstein, M. Robins, B. Bartin, M. Cetin, N. Xu,
J.C. Zorrilla, S. Xia, S. Wang, and M. Silas (2005). 'Evaluation Study of New Jersey Turnpike Authority's Time-
ofday Pricing Initiative'. Publication FHWA-NJ-2005-012.FHWA, U.S. Department of Transportation. Available
online at time of writing:
http://knowledge.fhwa.dot.gov/cops/hcx.nsf/All+Documents/BA2414CE1EAC182685256DC500674090/$FILE/njtpa_fin
al_report_may_31_2005.pdf

New Jersey Turnpike & Route 440 Asset Appraisal
38
Existing and Future Capacity Constraints
4.13 Initially a set of constrained traffic forecasts was developed. These were then used to
determine when lane expansions may be required over the life of the concessions of the
project facility. The basis for this was the requirement specified by the State that Service
Levels should not fall below “Level D”. Our method for estimating capacity constraints is
outlined below.
4.14 Firstly the 2006 transactions database was used to establish annual average weekday
traffic flows (AADTw) by section of road, time of day and direction of travel.
4.15 From this the number of vehicles per hour per lane for each road section for the AM Peak
period (defined as 6:00AM-9:00AM on weekdays) was derived. Traffic growth estimates
from the forecasting model were applied to derive this information for each of the
forecasting years.
4.16 Secondly on the basis of the HCM and speed/flow relationships calibrated on other inter-
urban highways, we adopted a link capacity of 2,250 vehicles/hour/lane to correspond to
flow levels at which HCM recommends a LOS D
3
.
4.17 When forecast traffic levels exceeded the LOS D definition capacity constrains are
believed to be binding and an expansion of one lane per direction has been assumed. The
triggered expansions are summarized in Appendix C. It can be seen that for certain road
sections a secondary expansion has been necessary due to further traffic growth. Finally
the traffic models were rerun to include the additional network capacities.
3
Our analysis is fully reliant on data supplied by NJDOT and its agencies, and is based on ‘average’ traffic conditions. It
is however apparent that at certain times of the year and on certain days, volumes will be considerably higher than
these averages. In addition unforeseen incidents may generate a severe breakdown in flow and these effects will be
‘smoothed’ by taking an average approach. However we feel this is the only method by which we can obtain an
accurate picture of the performance of a facility over an extended period of time and thus a fair assessment of
whether an expansion is genuinely required. The method applied is a ‘link-based’ assessment, i.e. it does not
explicitly consider the capacity of interchanges or the interaction of the facilities with the ‘secondary’ highway
network (from where downstream queuing often occurs because capacity is typically much less). By assessing
constraints purely on the basis of link volumes and capacities we are effectively isolating highway sections where
the provision of additional lane capacity will help solve prevailing congestion levels.

New Jersey Turnpike & Route 440 Asset Appraisal
39
5. TRAFFIC GROWTH
Introduction
5.1 To derive the extent to which traffic will grow in the future, we have undertaken the
following:
• Reviewed the extent of economic development in the region and derived appropriate
‘economic’ forecasts (e.g. we have used various recognized economic forecasting
sources to derive population and employment forecasts at a county level – based on
discussions with development agencies, we have also provided an ‘overlay’ to these
forecasts, depending on the extent new sites and developments will generate
additional population);
• Analyzed the extent to which travel-related parameters such as trip making by drivers
have changed over time (e.g. there is considerable evidence from official New Jersey
statistics that drivers are undertaking more mileage every year. For the appropriate
traffic categories, we have therefore adjusted the county-based economic forecasts
accordingly to reflect this); and
• So that the growth vectors can be incorporated into the traffic modeling framework,
we developed matrices containing vectors at the county level for each of the three
traffic categories. These reflect assumptions about growth to/from origins and
destinations. The growth vector matrices then form an input to the traffic models.
5.2 As discussed in this chapter, observed economic and traffic growth in New Jersey have
been extremely robust. Based on our review of all available data and forecasts, we believe
that these robust level of growth will continue into the future.
Economic Development
5.3 New Jersey is a key region of economic activity within the United States and is situated at
the centre of a metropolitan axis stretching from Washington, DC to Boston, MA. The
State is the most densely populated in the United States, at 1,174 residents per square
mile. According to the United States Census Bureau, it is also the second wealthiest state
per capita in the United States.
5.4 According to the US Bureau of Economic Analysis, the State’s median household income
is the highest in the nation, at $55,146 and it is ranked second in the nation by the number
of locations with per capita incomes above the national average of 76.4%. Nine of New
Jersey's counties are in the wealthiest 100 of the country.
5.5 New Jersey has an extensive industrial base that comprises the following:
• The Port Newark-Elizabeth Marine Terminal is one of the world's largest container
ports while Newark Liberty International Airport is ranked seventh among the
nation's busiest airports and among the top 20 busiest airports in the world;

New Jersey Turnpike & Route 440 Asset Appraisal
40
• New Jersey’s industrial outputs include pharmaceutical and chemical products, food
processing, electric equipment, printing and publishing, and tourism. Additionally,
New Jersey is home to the largest petroleum containment/storage system outside of
the Middle East;
• New Jersey hosts several business headquarters (fifty Fortune 500 companies have
headquarters in or conduct business from Morris County alone);
• New Jersey has several oil refineries and chemical plants;
• Its agricultural outputs are numerous and include nursery stock, horses, vegetables,
fruits and nuts, seafood and dairy products.
5.6 It is these types of activities that generate significant volumes of traffic on the toll roads in
New Jersey. In addition, considerable volumes of car journeys are generated from the
large number of residential developments throughout the States as well as the car trips
generated by the employment in major centers such as New York City.
5.7 Figure 5.1 is based on historical data collated by Woods & Poole, a firm that specializes in
long-term economic and demographic analyses. In the figure, the ‘Mid-Eastern’ region is
defined as that comprising Delaware, Washington DC, Maryland, New Jersey, New York
and Pennsylvania.
FIGURE 5.1 ANNUAL GRP, POPULATION & EMPLOYMENT GROWTH, 2000 - 2005
United States
Mid-Eastern
Region
New York
CMSA
Philadelphia
CMSA
New Jersey
State
Population
Employment
GRP
2.2%
2.1%
1.5%
3.0%
2.6%
0.7%
0.5%
0.4%
0.6%
0.8%
1.0%
0.4%
0.5%
0.5%
0.7%
0.0%
0.5%
1.0%
1.5%
2.0%
2.5%
3.0%
Source: Woods & Poole
5.8 The figure shows that economic growth between 2000 and 2005 (as measured by Gross
Regional Product, GRP), was higher than that observed nationally. Although there is
evidence that in the past years, New Jersey’s economic expansion has lagged behind that
in the country, long term forecasts by institutions such as Woods & Poole predict a return
to robust growth of approximately 2.5% per year over the period to 2030.

New Jersey Turnpike & Route 440 Asset Appraisal
41
5.9 The figure above also shows that over the period between 2000 and 2005, employment
growth in New Jersey has exceeded that observed nationally while population growth has
also been significant and has compared well with the national average.
5.10 Recent research by the Rutgers State University of New Jersey’s Economic Advisory
Service (RECON) supports the predictions of other forecasters, such as Woods & Poole,
by indicating that over the longer term (between 2005 and 2016), economic growth in the
State will continue to be robust.
5.11 The RECON forecasts of January 2007, for example, suggest that output in the State of
New Jersey will increase by 2.5% per year (similar to the growth indicated in the Woods
and Poole forecasts). This is an issue that has relevance to traffic growth forecasts and
these are discussed later.
Trip Rates
5.12 In addition to evaluating forecast economic and demographic growth at the county level,
we have also undertaken research into the following:
• The extent of any ‘decoupling’ between economic and traffic growth; and
• Investigating whether there is evidence of an increase in vehicle miles traveled
(VMT) per capita.
5.13 These are important parameters since they provide guidance as to whether the
demographic growth-based vectors should be adjusted to reflect observed changes in trip
making and vehicle mileage.
5.14 One of the key issues here is the evidence of any increase in annual vehicle mileage per
member of the population in New Jersey. If, for example, the number of miles each
person travels is increasing each year, this indicates that an allowance should be made for
this within any demographics-based growth vectors.

New Jersey Turnpike & Route 440 Asset Appraisal
42
Decoupling of Economic & Traffic Growth
5.15 Research undertaken in the United States (‘Decoupling Economic Growth & Transport
Demand: A Requirement for Sustainability’, R Gilbert & K Nadeau, May 2002) has
shown that there is some evidence of ‘decoupling’ of economic growth and traffic growth.
This is indicated in Figure 5.2 below (albeit with data only available up to 1998).
FIGURE 5.2 DECOUPLING OF ECONOMIC & TRAFFIC GROWTH 1960 – 1998 (USA)
0
50
100
150
200
250
300
350
400
1960
1961
1962
1963
1964
1965
1966
1967
1968
1969
1970
1971
1972
1973
1974
1975
1976
1977
1978
1979
1980
1981
1982
1983
1984
1985
1986
1987
1988
1989
1990
1991
1992
1993
1994
1995
1996
1997
1998
Year
Index (1960 = 100)
Passenger Kilometers Traveled Tonnes Kilometers Traveled Gross Domestic Product
Source: US Bureau of Transport Statistics (‘National Transport Statistics’) / US Bureau of Economic Analysis
(‘Current Account Data’)
5.16 As the figure indicates, although the motorized movement of people in the US has closely
matched the growth in the economy, there has been some decoupling of economic activity
and freight transport activity since the early/mid 1970s and of economic activity and
passenger transport since the early 1990s.
5.17 Private motoring data from the New Jersey Department of Labor and Workforce
Development and the Federal Transit Administration’s National Transit Database (for
1997 to 2004) shows that for every $1,000 of Gross State Product, total mileage driven
decreased by approximately 5% over the period. This is indicated in Figure 5.3.

New Jersey Turnpike & Route 440 Asset Appraisal
43
F
IGURE 5.3 PRIVATE VEHICLE MILES DRIVEN PER $1,000 GROSS STATE PRODUCT,
NEW JERSEY, 1997-2004
180
185
190
195
200
205
1997 1998 1999 2000 2001 2002 2003 2004
Year
Miles Driven - Private Vehicles
Source: NJ Dept of Labor & Workforce Development, FTA National Transit Database, 1997-2004
5.18 For passenger mileage, although this indicates some decoupling of economic activity from
transport activity, the annual extent of this (-0.7% per annum) is relatively small and may
reflect factors such as growth in transit use statewide as well as a 13.6% increase in
‘output per worker’ over the same period. This indicates that fewer workers (and fewer
drivers) are required to produce a larger Gross State Product.
5.19 Given this relatively small level of ‘decoupling’ each year, we have not adjusted the car
traffic growth vectors as there is considerably more evidence (see below) that on a per
capita basis, drivers in New Jersey have been traveling increasing vehicle mileages each
year.
5.20 For truck freight traffic in New Jersey, the outcome appears to be different as on average,
the number of miles driven per $1,000 of Gross State Product has increased over the
period by almost 18%. Figure 5.4 overleaf indicates this trend, including the two years
where the volume of mileage per Gross State Product decreased.

New Jersey Turnpike & Route 440 Asset Appraisal
44
F
IGURE 5.4 TRUCK VEHICLE MILES DRIVEN PER $1,000 GROSS STATE PRODUCT,
NEW JERSEY, 1997-2004
10
11
12
13
14
15
16
17
18
19
20
1997 1998 1999 2000 2001 2002 2003 2004
Year
Miles Driven - Truck Freight
Source: NJ Dept of Labor & Workforce Development, FTA National Transit Database, 1997-2004
5.21 For truck traffic, although we have not made a direct upward adjustment to reflect this
increased level of mileage per unit of economic activity, the growth vectors derived for
this traffic category are higher than those for other traffic types are due, in part, to this
phenomenon.
5.22 To demonstrate the high level of truck traffic observed in New Jersey between 1997 and
2004, data from NJDOT’s ‘Travel Activity by Vehicle Type’ shows that truck travel grew
by 44%, compared to 15% for all vehicles. Trucks traveled more than 6.3 billion miles in
2004, up nearly 2 billion miles from 1997. Trucks also made up a growing share of the
vehicles on New Jersey's roadways. In 2004, trucks comprised almost 9 percent of the
total miles traveled, up from 7 percent in 1997, an increase of 25%.
Evidence of Increases in VMT Per Capita over Time
5.23 Data collected for New Jersey indicates that there has been a steady increase in VMT per
capita over time. Using both FHWA and Census data from 1975 through to 2002, there
have been several trends over different periods in the VMT per capita relationship as
indicated in Figure 5.5.

New Jersey Turnpike & Route 440 Asset Appraisal
45
F
IGURE 5.5 SUMMARY OF VEHICLE MILES TRAVELED PER CAPITA, 1975 - 2002
6,000
6
,500
7,000
7,500
8,000
8
,500
1975
1976
1977
1978
1979
1980
1981
1982
1983
1984
1985
1986
1987
1988
1989
1990
1991
1992
1993
1994
1995
1996
1997
1998
1999
2000
2001
2002
Year
Miles per Year per Person
Source: NJDOT (figure produced in New Jersey Department of Environment Protection’s
‘Environmental Trends 2005’)
5.24 As the figure shows, there are several distinct ‘periods’ in which the relationship between
vehicle mileage per person changes and these are summarized below:
• 1975 – 1980: a period of comparatively strong growth (despite downturn in 1979);
• 1980 – 1985: VMT per capita remained broadly constant;
• 1985 – 1989: VMT per capita increased by just over 2% per annum;
• 1989 – 1995: VMT per capita fell;
• 1995 – 2005: VMT per capita increased by just over 1% per annum.
5.25 The most important conclusion to be drawn from the data in the figure is that there has
been a steady increase in miles per capita since the mid-1990s. Following the end of the
economic downturn of the early 1990s, drivers throughout New Jersey have been
undertaking more mileage each year as their need to travel increases.
5.26 Over the last five years (2001-2005), for example, the average increase has been
approximately 1.2% per annum. In other words, New Jersey residents are driving
approximately 1.2% more miles compared to the previous year.

New Jersey Turnpike & Route 440 Asset Appraisal
46
5.27 Figure 5.6 shows the absolute vehicle miles traveled per capita between 2000 and 2005.
The figure clearly indicates that although VMT per capita decreased between 2002 and
2003, this was more than made up in the following year. The decrease between these
years is most likely, however, to be attributed to the ‘one off’ economic shock associated
with the events of 9/11. We would thus conclude from the longer term average that
vehicles miles traveled per capita is likely to grow by at least 1% per annum.
FIGURE 5.6 VEHICLE MILES TRAVELED PER CAPITA, 2000 - 2005
7,700
7,800
7,900
8,000
8,100
8,200
8,300
8,400
8,500
8,600
2000 2001 2002 2003 2004 2005
Year
Miles per Year per Capita
Source: NJDOT / US Census Bureau
5.28 The observed increase in VMT per capita is a key finding since it suggests that for certain
traffic categories, forecast growth based on forecast changes in population and
employment will be supplemented by growth attributable to the increases in mileage per
capita.
5.29 To demonstrate this, the majority of official county-based demographic forecasts in New
Jersey (e.g. including those produced by Woods & Poole) indicate annual increases in
population of approximately 1%. To derive an overall growth vector that reflects these
and the increases in VMT per capita of 1% per year, the two growth rates are multiplied
together to produce a combined vector of over 2% per annum.
5.30 The derivation of vectors incorporating an allowance for increases in VMT per capita is
discussed in more detail under ‘Car – Other’ below.

New Jersey Turnpike & Route 440 Asset Appraisal
47
WSA Forecasts
5.31 WSA produced transactions projections in 2005 for the NJTP. These estimates were
based on historical data and covered the period 2006 – 2015. The results of this report are
summarized below and in Table 5.1.
5.32 The projections were based on a number of assumptions. The most significant are:
• No toll increase during the forecast period;
• No major competing highway construction during the forecast period;
• Population, employment and local development will follow the WSA report’s socio-
economic projections;
• No reduced growth initiatives will be introduced; and
• Fuel will remain available at stable prices
5.33 Employment in southern New Jersey was expected to grow, specifically in Camden and
Mercer counties, whereas slow employment growth was expected in the northern New
Jersey region. Population was forecast to grow across the state, with Somerset County
growing most rapidly. The report projected steady increases in the number of the region’s
residential building permits issued.
5.34 Major infrastructure and land developments were projected to add traffic onto the NJTP.
Among theses projects were Meadowland Xanadu, the Secaucus Interchange and the
Pennsylvania Turnpike/I-95 connection.
5.35 WSA projects total traffic to rise from 257 million in 2005 to just under 335 million by
2011. Revenue is projected to increase from $525 million in 2005 to $676 million in
2011, representing an average annual growth of 4.3 %.
TABLE 5.1 NJTP - WSA TRAFFIC PROJECTIONS (2005 - 2011)
Year Traffic (M)
Observed
Traffic
Revenue
(Nominal SM)
Observed
Revenue
(Nominal $M)
2005
257 241
525
508
2006
285 252
583
539
2007
297
603
2008
305
617
2009
311
629
2010
321
650
2011
335
676
Average Annual Growth 4.5% 4.6% 4.3% 6.1%
Source: WSA / SJTA / SDG Analysis

New Jersey Turnpike & Route 440 Asset Appraisal
48
Steer Davies Gleave Forecasts
5.36 The following paragraphs contain descriptions of the how the growth vectors for each
traffic category have been derived. In addition to using forecasts of demographic
parameters, the growth vectors also reflect ‘Trend Analyses’ of historical traffic growth on
the toll road. This has informed our view of the most appropriate growth factors to use for
the traffic forecasts.
Development of Growth Vector Matrices
5.37 Before discussing how the growth vectors by vehicle category have been derived, we
provide a summary of how the growth matrices are developed. These growth matrices
form a key input to the traffic forecasting process.
5.38 For traffic forecasting purposes, there are three different ‘growth’ matrices developed for
each traffic type. These represent:
• Car – work journeys;
• Car – ‘other’ journeys (including business & leisure journeys);
• Truck.
5.39 In each of these matrices, the ‘zoning’ system is based on the 21 counties within the State
of New Jersey as well as 28 ‘external’ counties that are located in neighboring States. The
28 external counties are shown below in Table 5.2.
TABLE 5.2 SUMMARY OF 'EXTERNAL ZONE' COUNTIES
New York Pennsylvania Delaware Maryland Connecticut
Bronx Berks Kent Cecil Fairfield
Dutchess Bucks New Castle
Kings Chester Sussex
Nassau Delaware
New York Lancaster
Orange Lehigh
Queens Monroe
Richmond Montgomery
Rockland Northampton
Sullivan Philadelphia
Ulster Pike
Westchester

New Jersey Turnpike & Route 440 Asset Appraisal
49
5.40 Within each matrix, the objective is to derive a series of annual growth rates to apply to
trips between each origin and destination. The derivation of these growth rates is
discussed below with each county-to-county vector reflecting forecasts in variables such
as employment and population growth as well as any adjustments made to reflect changes
in trip rates / trip making over time.
5.41 There is thus a three-step process used to derive the annual growth vectors for each traffic
type:
1) Derive ‘economic’ growth factors for each county-based zone (A full description of
how these population and employment-based growth vectors are derived is included
in the ‘Economic Analysis’ section of the Background Report of the Traffic and
Revenue study);
2) For each traffic type, evaluate how these growth vectors should be adjusted to reflect
changes in trip rates / trip making (e.g. for ‘Car – Other’ journeys, evidence of
increases in vehicle mileage per capita will warrant an appropriate adjustment to the
basic growth vectors);
3) Given the potential 99 year duration of the forecast period, appropriate changes to the
traffic growth vectors are made at key points in the concession timescale.
5.42 If appropriate, matrix Furnessing
4
is undertaken for those traffic types where origin
vectors (e.g. based on ‘population’ growth) are different to destination vectors (e.g. based
on ‘employment’ growth). This technique has been specifically applied to the ‘Car –
work’ category where origins are related to population growth and destinations based on
employment forecasts.
5.43 The format of the output from the traffic growth matrices is in a format suitable for direct
input to the traffic models.
Car - Work
5.44 For car-based journeys to work, we have used county employment growth vectors as a
basis for ‘destination’ trips. This is because growth in this traffic category will be very
closely linked to growth in at ‘employment destinations’. For the ‘origin’ trips, these are
based on forecast increases in population in each county as the relative growth in the
number of residents will also influence the rate of increase in work trips.
5.45 Given that there will be differing rates of growth at both origins and destinations within
the ‘Car – Work’ matrices, these are ‘balanced’ by use of an appropriate Furnessing
process. Through a series of iterations, this ensures that the resulting row totals of trips
matches the column totals of trips.
4
Furnessing: Process by which traffic volumes are adjusted using an iterative process in order to satisfy defined control
totals.

New Jersey Turnpike & Route 440 Asset Appraisal
50
5.46 The growth rates in the table are annual vectors applicable to the earlier years of the
concession period. Over time, it is necessary to adjust these vectors as it becomes
increasingly difficult to forecast changes in economic variables over the long term. The
profile indicated below applies to all growth vectors:
• 2007 – 2025: annual growth vectors are based on those indicated in the table above;
• 2026 – 2050: all growth vectors are reduced by 25%;
• 2051 – 2075: all growth vectors are reduced by 50%; and
• 2076 – 2107: all growth vectors are reduced to zero as there is considerable
uncertainty surrounding growth levels so far into the future.

New Jersey Turnpike & Route 440 Asset Appraisal
51
T
ABLE 5.3 CAR - WORK: SUMMARY OF ANNUAL GROWTH VECTORS
County Pop Emp
Atlantic, NJ 1.03% 1.00%
Bergen , NJ 0.54% 1.05%
Burlington , NJ 1.00% 1.24%
Camden , NJ 0.63% 0.93%
Cape May , NJ 0.23% 1.27%
Cumberland , NJ 0.67% 0.85%
Essex , NJ 0.51% 0.77%
Gloucester , NJ 1.25% 1.38%
Hudson , NJ 0.33% 0.92%
Hunterdon , NJ 1.19% 1.12%
Mercer , NJ 0.73% 1.19%
Middlesex , NJ 0.72% 0.87%
Monmouth , NJ 0.77% 0.96%
Morris , NJ 0.91% 1.25%
Ocean , NJ 1.20% 1.52%
Passaic , NJ 0.54% 0.76%
Salem , NJ 0.83% 0.75%
Somerset , NJ 1.00% 1.16%
Sussex , NJ 1.21% 1.61%
Union , NJ 0.54% 0.91%
Warren , NJ 1.21% 1.03%
Fairfield, CT 0.52% 1.35%
Kent, DE 1.09% 1.33%
New Castle, DE 0.97% 1.46%
Sussex, DE 1.53% 1.67%
Cecil, MD 1.82% 2.04%
Bronx, NY 0.78% 1.06%
Dutchess, NY 0.81% 0.98%
Kings, NY 0.35% 1.17%
Nassau, NY 0.14% 0.76%
New York, NY -0.17% 0.22%
Orange, NY 1.26% 1.32%
Queens, NY 0.58% 0.99%
Richmond, NY 1.53% 2.14%
Rockland, NY 0.81% 1.14%
Sullivan, NY 0.49% 0.91%
Ulster, NY 1.11% 1.16%
Westchester, NY 0.56% 0.93%
Berks, PA 0.57% 0.96%
Bucks, PA 1.21% 1.55%
Chester, PA 1.21% 1.76%
Delaware, PA 0.19% 0.90%
Lancaster, PA 0.86% 0.86%
Lehigh, PA 0.63% 1.36%
Monroe, PA 2.13% 1.94%
Montgomery, PA 0.55% 1.01%
Northampton, PA 1.00% 1.16%
Philadelphia, PA -0.30% 0.50%
Pike, PA 2.15% 1.93%

New Jersey Turnpike & Route 440 Asset Appraisal
52
Car - Other
5.47 For this traffic category, we have used an amalgam of county-based population and
employment growth vectors as a basis for both ‘origin’ and ‘destination’ trips. For the
employment vectors, these are based on forecast employment growth in different sectors
of the labor market. Forecast growth in total employment across all sectors is also taken
into account. A fuller explanation as to the selection of these variables is contained in the
‘Economic Analysis’ section in Report Set 2, ‘Background To Our Work’.
5.48 To demonstrate the use of different employment forecasts for the 21 New Jersey counties,
these represent employment growth in six different sectors of the labor market. Growth in
employment across all sectors is also taken into account.
5.49 The reason for using growth in different employment sectors is the ‘Car – Other’ category
covers an extremely wide range of trip purposes and is likely to be influenced by changes
in economic activity across several sectors. For the 28 ‘external’ county zones, the
employment forecasts represent both the ‘Retail’ and ‘Service’ sectors, as well as forecast
growth across all employment sectors.
5.50 By assigning appropriate ‘weights’ to each population and employment vector, a final
series of growth vectors are derived.
5.51 To reflect the phenomena of increases in VMT per capita, an adjustment is made to each
county-based growth vector. This is necessary as ‘Car – Other’ trips are those most likely
to be affected by increases in vehicle mileage as drivers make more leisure and business
trips. An uplift of 1% per annum was applied.
5.52 There is no requirement to ‘Furness’ these growth vectors as they are based on a synthesis
of population-based ‘origin’ movements and employment-based ‘destination’ movements.
5.53 The profile of adjustments in these growth vectors is identical to that indicated under the
‘Car – Work’ category above. The growth vectors used as inputs to the ‘Car - Other’
traffic matrices are given in Table 5.4.

New Jersey Turnpike & Route 440 Asset Appraisal
53
T
ABLE 5.4 CAR - OTHER: SUMMARY OF ANNUAL GROWTH VECTORS
County
Atlantic, NJ 2.39%
Bergen , NJ 2.27%
Burlington , NJ 2.56%
Camden , NJ 2.20%
Cape May , NJ 2.36%
Cumberland , NJ 2.16%
Essex , NJ 2.03%
Gloucester , NJ 2.75%
Hudson , NJ 2.11%
Hunterdon , NJ 2.53%
Mercer , NJ 2.44%
Middlesex , NJ 2.19%
Monmouth , NJ 2.28%
Morris , NJ 2.54%
Ocean , NJ 2.84%
Passaic , NJ 2.02%
Salem , NJ 2.11%
Somerset , NJ 2.50%
Sussex , NJ 2.92%
Union , NJ 2.17%
Warren , NJ 2.46%
Fairfield, CT 2.26%
Kent, DE 2.55%
New Castle, DE 2.32%
Sussex, DE 2.93%
Cecil, MD 3.38%
Bronx, NY 2.05%
Dutchess, NY 2.16%
Kings, NY 2.01%
Nassau, NY 1.66%
New York, NY 1.16%
Orange, NY 2.68%
Queens, NY 2.00%
Richmond, NY 3.04%
Rockland, NY 2.28%
Sullivan, NY 1.82%
Ulster, NY 2.32%
Westchester, NY 1.98%
Berks, PA 2.10%
Bucks, PA 2.72%
Chester, PA 2.77%
Delaware, PA 1.71%
Lancaster, PA 2.14%
Lehigh, PA 2.41%
Monroe, PA 3.23%
Montgomery, PA 2.03%
Northampton, PA 2.31%
Philadelphia, PA 1.47%
Pike, PA 3.15%

New Jersey Turnpike & Route 440 Asset Appraisal
54
Trucks
5.54 For truck traffic, extensive use was made of ‘Trend Analysis’ of past growth as well as
forecasts of truck movements made by organizations such as the Federal Highway
Administration’s (FHWA’s) Freight Analysis Framework (FAF). The latter comprises,
for example, forecasts of truck movements by county in New Jersey.
5.55 The findings from this analysis show that truck traffic growth in New Jersey, both
observed and forecast, is extremely robust with the key findings being:
• Based on data from the NJTA, observed truck traffic on the NJTP over the 15 year
period from 1991 to 2006 grew at an average of 2.5% per annum (with slightly
negative growth in the years following the events of 9/11), as shown in Figure 4.7;
• According to data from the Bureau of Transportation Statistics, total truck ton
mileage across New Jersey increased by just over 2.6% per annum between 1993 and
2002 (over the shorter period between 1997 and 2002, annual growth was just over
2.5%); and
• According to the FHWA’s Freight Analysis Framework, forecast annual growth in
truck traffic across all 21 New Jersey counties is predicted to be 2.7% per annum
between 1998 and 2020.
FIGURE 5.7 NJTP - YEAR ON YEAR TRUCK TRAFFIC GROWTH 1992-2005
-4.0%
-2.0%
0.0%
2.0%
4.0%
6.0%
8.0%
1992
1993
1994
1995
1996
1997
1998
1999
2000
2001
2002
2003
2004
2005
Source: NJTA / SDG Analysis
5.56 Although there have been fluctuations in truck traffic across different years, the 15-year
average growth of 2.5% per annum is consistent with that observed across the State since
1993. In addition, historic growth in the New Jersey’s Gross State Product is very similar,
at 2.5% on average between 1998 and 2005.
5.57 There thus appears to be a very close link between historic truck traffic and economic
activity in the State. This is reflected in our selection of truck growth vectors.

New Jersey Turnpike & Route 440 Asset Appraisal
55
5.58 We have based the selection of truck growth vectors on the basis of these findings and
have derived a growth vector of 2.5% per annum across all county-based zones;
5.59 The selection of a vector of 2.5% appears prudent given both observed truck traffic and
Gross State Product growth in the State as well as the forecasts for growth in these two
parameters. Woods & Poole, for example, forecast that Gross State Product growth in
New Jersey will be close to 2.5% per annum.
5.60 Similar to the ‘Car – Work’ and ‘Car – Other’ traffic categories, annual truck growth is
adjusted by the same profile of adjustments given in Paragraph 1.42 above.

New Jersey Turnpike & Route 440 Asset Appraisal
56
6. FORECASTS
Introduction
6.1 Traffic and Revenue forecasts have been developed, for a scenario which has been defined
as the most likely outcome, taking into account the balance of probabilities with all the
different risks and uncertainties in any forecasting process.
6.2 The revenues presented in the report are in real terms – the price base for the results is
2006. Table 6.1 below summarizes the main assumptions underlying the forecasts.
TABLE 6.1 SUMMARY OF FORECASTING ASSUMPTIONS
Item
Base Year Demand and
Revenue
2006 Transaction Databases for NJTP / GSP and ACE providing
transactions and revenues by location, day of year, payment type and
toll rate – provided by toll authorities
General assumption on exempted traffic and others: reflected in average
toll per vehicle taken from Transaction database
O/D Pattern and Journey
purpose split
Taken from Statewide Model. Matrices updated with NJTPA and SJTPO
(including DVRPC) data.
2 time periods: Peak (represented by AM flow direction) and Off Peak.
The factors applied to each period come from most recent NJTPA script
parameters adjusted using count data available for 24 hours period.
Segmentation by 2 journey purposes (home based work and other), both
journey purposes split into four income groups. The four income groups
are based on county-level Census 2000 household income levels fit into
the income ranges of the four income groups identified in the NJTPA
(values grown to 2000). Number of households in each income group
converted to trips using the income group trip levels in NJTPA
documentation.
Commercial vehicles treated as one segment.
Traffic Growth – Cars
(work journeys)
Based on economic growth variables for 21 New Jersey counties and 28
‘external’ counties
Key parameters are annual 2005 – 2025 employment & population and
forecasts (sources = Woods & Poole, DLWFD & Metropolitan Planning
Organizations)
For ‘origin’ trips, population growth vectors are used and for ‘destination’
trips, employment growth vectors are used
Origin-based & destination-based growth is then ‘balanced’ within the
matrix by using an appropriate Furnessing process

New Jersey Turnpike & Route 440 Asset Appraisal
57
Traffic Growth – Cars
(‘other’ journeys)
Based on economic growth variables for 21 New Jersey counties and 28
‘external’ counties
Key parameters are annual 2005 – 2025 population & employment
forecasts – the latter are based on forecasts across a variety of labor
market sectors (sources: Woods & Pool, DLWFD & Metropolitan
Planning Organizations)
The vectors from the different labor markets are then weighted according
to assumptions about what proportions form ‘total’ growth – the
population vectors are also ‘weighted’ as part of this process
Further adjustments to growth factors: for this traffic category, the annual
growth vectors are multiplied by 1% to reflect VMT, per capita.
Traffic Growth - Trucks Based on analysis of historical & forecast truck traffic trends throughout
New Jersey, Truck growth is based on forecast Statewide GDP growth.
Highway Model Network Taken from State-wide model and updated to reflect coding of NJTPA
and SJTPO networks for significant roads. Also updated to reflect other
key coding elements (e.g. Auto only section of New Jersey Turnpike).
Link speeds and capacities based on NJTPA values.
NJTP free flow speeds are set at 70 mph regardless of the area type.
Link volume-delay relationships follow the conventional BPR function
(a=0.15, b=4.0) for high-type roadways (tollways, freeways, expressways
and divided principal arterials), and follow a modified BPR function
(a=0.135, b=5.35) for lower-type roadways. The modified BPR function
was estimated from graphical presentations of the relationships used in
the NJTPA.
All significant toll plazas were coded for two-way collection to avoid
creating unrealistic differences in assigned traffic volumes in the O->D
and D->O directions.
Highway Model Network
Toll Rates
Taken from State-wide model and updated with current NJTP, GSP, and
ACE toll rates, as well as current toll rates of bridge crossings to/from
New Jersey to Delaware, New York, and Pennsylvania.
Year of dollar in Model
runs
All model runs include tolls, and values of time in 2006 dollars. VOT are
assumed to remain constant in real terms in the future.
Traffic Assignment
Principle
Equilibrated generalized cost, where generalized cost is travel time
adjusted for motorway bonus * VOT + travel distance * VOC + toll. In
each iteration, the equilibration procedure determined a minimum
generalized cost OD path for each distinct user class, reflecting the
class’s individual VOT and VOC.
Equilibrium Calculation
Tolerance
An assignment tolerance of 0.05 was used.

New Jersey Turnpike & Route 440 Asset Appraisal
58
Value of Time (VOT)
(2006 prices)
Based on Census 2000 Household income levels. Household income
levels were converted into average wage rate by dividing by 2080 hours;
commuter VOTs were calculated as 50% of the wage rate, and other
VOTs as 35% of the wage rate ($ / hr):
• Car Commute: 4.2 / 10.8 / 18.1 / 36.9
• Car Other: 2.9 / 7.6 / 12.7 / 25.9
Trucks: 54.25
Value of Time Growth Assumed constant in the future
Perceived Vehicle
Operating Cost (VOC)
(2006 prices)
Auto VOC ($/mile):0.01
Truck VOC was calculated as a 2 X multiple of auto VOC.
Motorway Bonus A 30%-35% bonus for time spent traveling on motorways was applied in
the generalized cost calculation. This bonus was computed on a link
basis, by reducing the travel time by 30-35% for motorway links.
Toll Road Time Savings
compared to other routes
Based on an equilibrium assignment model.
Journey time surveys undertaken for validation purposes.
Tolling Policy Scenarios as defined by New Jersey
E-ZPass Penetration Assumed constant in the future.
Lane Expansions Additional lanes as set out in Appendix C.
Toll Scenarios
6.3 For the Phase II traffic and revenue forecasts, a number of toll scenarios have been
defined by the State, as follows.
• Control Case - 2% annual inflationary increases levied in arrears 1/1/2010, 1/1/2014
and every 4th year thereafter. An annual inflationary increase of 2% has been
assumed, as defined by the State. (Scenario I);
• Control Case PLUS 25% real toll increases 1/1/2010, 1/1/2014 and 1/1/2018
(Scenario II);
• Control Case PLUS 50% real toll increases 1/1/2010 and 1/1/2014 (Scenario III);
• Control Case PLUS 50% real toll increases 1/1/2010, 1/1/2014 and 1/1/2018
(Scenario IV);
• Control Case PLUS 50% real toll increases 1/1/2010, 1/1/2014, 1/1/2018 and
1/1/2022 (Scenario V); and
• Control Case PLUS 75% real toll increases 1/1/2010, 1/1/2018 and 50% 1/1/2022 on
the NJTP, ACE and Rte 440 and a 75% real toll increase 1/1/2010 and 50% in 2018
on the GSP (Scenario VI).
6.4 The scenarios represent a range of toll policies. Scenario I (SCI) sees tolls kept constant
in real terms. Scenario V (SCV) implies toll rates by 2026 that are almost five times
higher in real terms than they are today.

New Jersey Turnpike & Route 440 Asset Appraisal
59
6.5 Figure 6.1 below shows the index of real NJTP and Rte 440 tolls for the scenarios
analyzed. The saw-tooth pattern is the result of the inflationary adjustments to toll levels
that are levied in arrears every 4
th
year.
FIGURE 6.1 NJTP AND RTE 440 TOLL SCENARIOS
0
100
200
300
400
500
6
00
2006
2010
2014
2018
2022
2026
2030
2034
2038
2042
2046
2050
2054
2058
2062
2066
2070
2074
2078
2082
2086
2090
2094
2098
2102
2106
Year
Toll Index (2006 = 100)
SC I SC II SC III SC IV SC V SC VI

New Jersey Turnpike & Route 440 Asset Appraisal
60
NJTP Traffic and Revenue Forecasts
6.6 Tables 6.2 and 6.3 present a summary of the traffic and revenue forecasts for a selection
of forecasting years, for each of the six toll scenarios.
TABLE 6.2 NJTP - REVENUE FORECAST SUMMARY ($M, 2006 PRICES)
Year SC I SC II SC III SC IV SC V SC VI
2008 545.7 544.5 544.5 547.0 547.2 545.3
2010 596.7 685.7 754.3 761.4 761.9 833.8
2014 654.5 846.6 1005.0 1023.2 1024.3 888.6
2018 712.4 1029.6 1105.5 1349.3 1349.4 1295.8
2022 770.2 1119.2 1206.9 1500.5 1881.7 1576.0
2026 828.0 1208.8 1308.9 1655.2 2081.1 1610.1
2036 908.0 1430.7 1547.3 1914.5 2467.7 1986.8
2046 1037.3 1691.3 1831.7 2232.3 3005.1 2367.7
2066 1159.1 1978.3 2174.8 2712.3 3663.6 3065.6
2086 1260.4 2198.0 2447.4 3213.6 4349.3 3859.7
2106 1358.8 2412.2 2708.8 3703.6 5020.0 4636.5
TABLE 6.3 NJTP - TRAFFIC FORECAST SUMMARY (2008 = 100)
Year SC I SC II SC III SC IV SC V SC VI
2008 100 100 100 100 100 100
2010 105.1 97.5 90.0 90.7 90.6 84.6
2014 115.4 97.3 80.1 81.7 81.6 98.2
2018 125.6 94.9 88.5 72.6 72.4 76.2
2022 135.9 103.5 97.0 81.2 67.7 60.9
2026 146.1 112.2 105.4 89.8 75.6 62.6
2036 161.4 131.5 123.9 103.5 89.8 78.2
2046 172.8 143.8 136.0 112.5 101.6 87.4
2066 190.4 164.7 157.9 132.7 120.9 110.5
2086 207.0 182.3 176.6 154.8 140.5 136.1
2106 223.2 199.2 194.2 176.1 159.6 161.0
6.7 Traffic growth over the life of the concession for the Control Case equals 0.8% per year
on average, although average growth in the early years (until 2022) is much higher at
2.2% per year.
6.8 After 2022, assumed traffic growth rates are lower and the effects of capacity constraints
are starting to slow down how much traffic can be accommodated by the road, resulting in
significantly lower average growth rates.

New Jersey Turnpike & Route 440 Asset Appraisal
61
6.9 The average growth over the life of the concession for the other toll scenarios equals 0.7%
per year for Scenario II, 0.7% for Scenario III, 0.6% for Scenario IV, 0.5% for Scenario V
and 0.5% for Scenario VI. These lower rates are due to the increases in toll rates which
diverts traffic away from the NJTP. As a result however capacity issues are not an issue
until much later in the forecasting period.
6.10 In 2022 traffic levels are predicted to be 24%, 29%, 40%, 50% and 55% lower than in the
Control Case.
6.11 Revenue growth for the Control Case equals 0.9% per year on average over the life of the
concession. This increases to 1.5%, 1.7%, 2.0%, 2.3% and 2.2% for the various toll
scenarios. The toll increases far outstrip the loss in demand, meaning revenues are
increased substantially as a result of the potential toll increases. 2022 revenue levels are
45%, 57%, 95%, 144% and 105% higher than in the Control Case.
6.12 Figures 6.2 and 6.3 present the traffic and revenue forecasts graphically. Again the saw-
tooth pattern results from the inflationary adjustments that have been assumed to be levied
every 4
th
year.
FIGURE 6.2 NJTP - REVENUE FORECASTS ($M, 2006 PRICES)
0
1,000
2,000
3,000
4,000
5,000
6,000
2008
2011
2014
2017
2020
2023
2026
2029
2032
2035
2038
2041
2044
2047
2050
2053
2056
2059
2062
2065
2068
2071
2074
2077
2080
2083
2086
2089
2092
2095
2098
2101
2104
2107
SC I SC II SC III SC IV SC V SC VI

New Jersey Turnpike & Route 440 Asset Appraisal
62
F
IGURE 6.3 NJTP - TRAFFIC FORECASTS (2008 = 100)
0
2
0
40
60
80
100
1
20
140
160
180
2
00
2
20
2
40
2008
2011
2014
2017
2020
2023
2026
2029
2032
2035
2038
2041
2044
2047
2050
2053
2056
2059
2062
2065
2068
2071
2074
2077
2080
2083
2086
2089
2092
2095
2098
2101
2104
2107
SC I SC II SC III SC IV SC V SC VI
6.13 Tables 6.4 – 6.8 provide a summary of demand and revenue forecasts for each toll
scenario, disaggregated by vehicle type.
TABLE 6.4 NJTP - TRAFFIC AND REVENUE FORECASTS – TOLL SCENARIO I
Cars Trucks
Year
Transactions
(2008=100)
Revenue
($M, 2006
prices)
Average
annual
growth (%)
Transactions
(2008=100)
Revenue
($M, 2006
prices)
Average
annual
growth (%)
2008 100 353.0 - 100 192.7 -
2010 105 384.1 4.3% 107 212.6 5.1%
2014 115 417.5 2.1% 120 237.0 2.7%
2018 124 451.0 1.9% 133 261.3 2.5%
2022 134 484.5 1.8% 146 285.7 2.3%
2026 144 518.0 1.7% 160 310.0 2.1%
2036 155 541.8 0.4% 196 366.2 1.7%
2046 164 598.3 1.0% 225 439.1 1.8%
2066 179 659.9 0.5% 255 499.2 0.6%
2086 196 723.2 0.5% 273 537.1 0.4%
2106 211 784.7 0.4% 291 574.2 0.3%

New Jersey Turnpike & Route 440 Asset Appraisal
63
T
ABLE 6.5 NJTP - TRAFFIC AND REVENUE FORECASTS – TOLL SCENARIO II
Cars Trucks
Year
Transactions
(2008=100)
Revenue
($M, 2006
prices)
Average
annual
growth (%)
Transactions
(2008=100)
Revenue
($M, 2006
prices)
Average
annual
growth (%)
2008 100 352.1 - 100 192.4 -
2010 98 446.2 12.6% 96 239.5 11.5%
2014 98 556.1 5.7% 94 290.5 4.9%
2018 95 674.4 4.9% 92 355.2 5.2%
2022 104 731.9 2.1% 101 387.2 2.2%
2026 113 789.5 1.9% 110 419.3 2.0%
2036 127 863.7 0.9% 156 567.1 3.1%
2046 135 959.2 1.1% 194 732.1 2.6%
2066 152 1089.3 0.6% 235 889.0 1.0%
2086 169 1214.7 0.5% 258 983.3 0.5%
2106 185 1335.6 0.5% 281 1076.6 0.5%
TABLE 6.6 NJTP - TRAFFIC AND REVENUE FORECASTS – TOLL SCENARIO III
Cars Trucks
Year
Transactions
(2008=100)
Revenue
($M, 2006
prices)
Average
annual
growth (%)
Transactions
(2008=100)
Revenue
($M, 2006
prices)
Average
annual
growth (%)
2008 100 352.1 - 100 192.4 -
2010 91 497.8 18.9% 86 256.5 15.5%
2014 81 660.7 7.3% 77 344.3 7.6%
2018 89 725.6 2.4% 85 379.9 2.5%
2022 97 790.5 2.2% 94 416.4 2.3%
2026 106 855.4 2.0% 103 453.5 2.2%
2036 120 939.9 0.9% 146 607.4 3.0%
2046 128 1051.1 1.1% 180 780.6 2.5%
2066 147 1206.3 0.7% 223 968.5 1.1%
2086 164 1356.1 0.6% 250 1091.3 0.6%
2106 180 1498.0 0.5% 275 1210.8 0.5%

New Jersey Turnpike & Route 440 Asset Appraisal
64
TABLE 6.7 NJTP - TRAFFIC AND REVENUE FORECASTS – TOLL SCENARIO IV
Cars Trucks
Year
Transactions
(2008=100)
Revenue
($M, 2006
prices)
Average
annual
growth (%)
Transactions
(2008=100)
Revenue
($M, 2006
prices)
Average
annual
growth (%)
2008 100 354.9 - 100 192.0 -
2010 91 505.7 19.4% 86 255.6 15.4%
2014 83 680.7 7.7% 77 342.6 7.6%
2018 74 906.7 7.4% 66 442.5 6.6%
2022 83 1010.3 2.7% 73 490.2 2.6%
2026 91 1113.9 2.5% 81 541.3 2.5%
2036 102 1208.2 0.8% 112 706.3 2.7%
2046 108 1345.4 1.1% 136 886.9 2.3%
2066 125 1564.6 0.8% 177 1147.7 1.3%
2086 144 1812.0 0.7% 216 1401.6 1.0%
2106 163 2051.1 0.6% 254 1652.5 0.8%
TABLE 6.8 NJTP - TRAFFIC AND REVENUE FORECASTS – TOLL SCENARIO V
Cars Trucks
Year
Transactions
(2008=100)
Revenue
($M, 2006
prices)
Average
annual
growth (%)
Transactions
(2008=100)
Revenue
($M, 2006
prices)
Average
annual
growth (%)
2008 100 354.9 - 100 192.3 -
2010 91 505.6 19.4% 86 256.2 15.4%
2014 82 680.4 7.7% 77 344.0 7.6%
2018 74 904.7 7.4% 66 444.7 6.6%
2022 69 1264.4 8.7% 61 617.3 8.5%
2026 77 1413.7 2.8% 66 667.4 2.0%
2036 90 1589.5 1.2% 91 878.3 2.8%
2046 99 1844.6 1.5% 116 1160.5 2.8%
2066 116 2175.5 0.8% 150 1488.1 1.3%
2086 133 2509.4 0.7% 184 1839.9 1.1%
2106 149 2834.6 0.6% 218 2185.4 0.9%

New Jersey Turnpike & Route 440 Asset Appraisal
65
TABLE 6.9 NJTP - TRAFFIC AND REVENUE FORECASTS – TOLL SCENARIO VI
Cars Trucks
Year
Transactions
(2008=100)
Revenue
($M, 2006
prices)
Average
annual
growth (%)
Transactions
(2008=100)
Revenue
($M, 2006
prices)
Average
annual
growth (%)
2008 100 354.6 - 100 190.8 -
2010 85 546.3 24.1% 84 287.5 22.8%
2014 98 582.3 1.6% 97 306.3 1.6%
2018 77 853.6 10.0% 74 442.1 9.6%
2022 61 1021.2 4.6% 60 554.7 5.8%
2026 63 1043.0 0.5% 62 567.1 0.6%
2036 77 1240.3 1.7% 86 746.5 2.8%
2046 84 1425.6 1.4% 105 942.1 2.4%
2066 105 1777.7 1.1% 145 1287.9 1.6%
2086 127 2160.4 1.0% 191 1699.3 1.4%
2106 148 2533.1 0.8% 236 2103.4 1.1%
Route 440 Traffic and Revenue Forecasts
6.14 Tables 6.10 and 6.11 present a summary of the traffic and revenue forecasts for a selection
of forecasting years, for each of the five toll scenarios.
TABLE 6.10 ROUTE 440 - SUMMARY OF REVENUE FORECASTS ($M, 2006 PRICES)
Year SC I SC II SC III SC IV SC V SC VI
2010
19.6 22.7 25.3 25.3 25.3 27.2
2014
20.9 27.5 33.0 33.2 33.1 28.1
2018
22.3 32.0 35.1 45.6 45.6 45.3
2022
23.7 33.9 37.2 48.7 54.1 62.8
2026
25.1 35.8 39.3 51.9 58.4 65.1
2036
26.9 39.4 42.4 55.4 67.3 70.5
2046
30.5 43.2 47.1 60.9 73.4 75.2
2066
34.2 48.9 53.3 68.1 83.7 84.0
2086
37.8 54.6 59.6 75.6 93.1 93.3
2106
41.3 60.2 65.7 82.9 102.4 102.5

New Jersey Turnpike & Route 440 Asset Appraisal
66
T
ABLE 6.11 ROUTE 440 - SUMMARY OF TRAFFIC FORECASTS (2008 = 100)
Year SC I SC II SC III SC IV SC V SC VI
2008 100.0 100.0 100.0 100.0 100.0 100.0
2010 104.5 98.9 93.7 93.9 93.9 88.6
2014 112.5 99.0 86.0 86.4 86.3 98.1
2018 120.5 95.8 91.7 79.3 79.2 82.5
2022 128.5 101.7 97.3 85.1 63.9 71.7
2026 136.5 107.6 103.0 91.0 69.1 77.2
2036 148.8 119.9 113.5 99.3 80.6 86.4
2046 159.2 125.5 119.7 103.6 84.2 89.5
2066 175.0 139.1 132.8 114.5 94.8 99.8
2086 190.0 152.9 146.2 126.2 104.7 110.7
2106 204.6 166.3 159.3 137.6 114.4 121.3
6.15 Traffic growth over the life of the concession for the Control Case equals 0.7% per year
on average, although average growth in the early years (until 2022) is much higher at
1.8% per year.
6.16 After 2022 assumed traffic growth rates are lower and the effects of capacity constraints
are starting to slow down how much traffic can be accommodated by the road, resulting in
significantly lower average growth rates.
6.17 The average growth over the life of the concession for the other toll scenarios equals 0.5%
per year for Scenario II, 0.5% for Scenario III, 0.3% for Scenario IV, 0.1% for Scenario V
and 0.2% for Scenario VI. These lower rates are due to the increases in toll rates which
diverts traffic away from the NJTP. As a result however capacity issues are not an issue
until much later in the forecasting period.
6.18 In 2022 traffic levels are predicted to be 21%, 24%, 34%, 50% and 44% lower than in the
Control Case.
6.19 Revenue growth for the Control Case equals 0.8% per year on average over the life of the
concession. This increases to 1.0%, 1.0%, 1.2%, 1.4% and 1.4% for the various toll
scenarios. The toll increases far outstrip the loss in demand, meaning revenues are
increased substantially as a result of the potential toll increases. 2022 revenue levels are
43%, 57%, 105%, 128% and 164% higher than in the Control Case.
6.20 Figure 6.4 and Figure 6.5 present the traffic and revenue forecasts graphically.

New Jersey Turnpike & Route 440 Asset Appraisal
67
F
IGURE 6.4 ROUTE 440 - REVENUE FORECASTS ($M, 2006 PRICES)
0
2
0
40
6
0
80
100
1
20
2008
2011
2014
2017
2020
2023
2026
2029
2032
2035
2038
2041
2044
2047
2050
2053
2056
2059
2062
2065
2068
2071
2074
2077
2080
2083
2086
2089
2092
2095
2098
2101
2104
2107
SC I SC II SC III SC IV SC V SC VI
FIGURE 6.5 ROUTE 440 - TRAFFIC FORECASTS (2008 = 100)
0
20
40
60
80
100
120
140
160
180
200
220
2008
2011
2014
2017
2020
2023
2026
2029
2032
2035
2038
2041
2044
2047
2050
2053
2056
2059
2062
2065
2068
2071
2074
2077
2080
2083
2086
2089
2092
2095
2098
2101
2104
2107
SC I SC II SC III SC IV SC V SC VI
6.21 Tables 6.11 – 6.15 provide a summary of demand and revenue forecasts for each toll
scenario, disaggregated by vehicle type.

New Jersey Turnpike & Route 440 Asset Appraisal
68
T
ABLE 6.12 ROUTE 440 - TRAFFIC AND REVENUE FORECASTS – TOLL SCENARIO I
Cars Trucks
Year
Transactions
(2008=100)
Revenue
($M, 2006
prices)
Average
annual
growth (%)
Transactions
(2008=100)
Revenue
($M, 2006
prices)
Average
annual
growth (%)
2008
100 0.0 - 100 0.0 -
2010
105 14.8 - 101 4.8 -
2014
113 15.9 1.9% 106 5.0 1.2%
2018
121 17.1 1.8% 111 5.2 1.1%
2022
130 18.3 1.7% 116 5.5 1.1%
2026
138 19.4 1.6% 121 5.7 1.0%
2036
149 20.2 0.4% 149 6.7 1.7%
2046
158 22.2 1.0% 175 8.2 2.0%
2066
172 24.2 0.4% 213 10.1 1.0%
2086
185 26.0 0.4% 250 11.8 0.8%
2106
197 27.8 0.3% 285 13.5 0.7%
TABLE 6.13 ROUTE 440 - TRAFFIC AND REVENUE FORECASTS – TOLL SCENARIO II
Cars Trucks
Year
Transactions
(2008=100)
Revenue
($M, 2006
prices)
Average
annual
growth (%)
Transactions
(2008=100)
Revenue
($M, 2006
prices)
Average
annual
growth (%)
2008
100 0.0 - 100 0.0 -
2010
100 17.6 - 86 5.1 -
2014
102 22.4 6.1% 70 5.2 0.5%
2018
100 27.6 5.4% 48 4.5 -3.7%
2022
106 29.3 1.5% 50 4.6 1.0%
2026
113 31.0 1.4% 52 4.8 1.0%
2036
124 32.8 0.6% 74 6.6 3.2%
2046
129 35.6 0.8% 82 7.6 1.4%
2066
142 39.1 0.5% 106 9.8 1.3%
2086
155 42.7 0.4% 130 12.0 1.0%
2106
168 46.1 0.4% 153 14.1 0.8%

New Jersey Turnpike & Route 440 Asset Appraisal
69
T
ABLE 6.14 ROUTE 440 - TRAFFIC AND REVENUE FORECASTS – TOLL SCENARIO III
Cars Trucks
Year
Transactions
(2008=100)
Revenue
($M, 2006
prices)
Average
annual
growth (%)
Transactions
(2008=100)
Revenue
($M, 2006
prices)
Average
annual
growth (%)
2008
100 0.0 - 100 0.0 -
2010
96 20.2 - 71 5.0 -
2014
90 28.5 9.0% 42 4.5 -2.7%
2018
96 30.4 1.6% 44 4.7 1.0%
2022
102 32.3 1.5% 46 4.9 0.9%
2026
108 34.2 1.4% 47 5.0 0.9%
2036
118 36.0 0.5% 63 6.4 2.4%
2046
124 39.2 0.9% 74 7.9 2.1%
2066
136 43.2 0.5% 95 10.1 1.3%
2086
149 47.2 0.4% 116 12.3 1.0%
2106
161 51.2 0.4% 137 14.5 0.8%
TABLE 6.15 ROUTE 440 - TRAFFIC AND REVENUE FORECASTS – TOLL SCENARIO IV
Cars Trucks
Year
Transactions
(2008=100)
Revenue
($M, 2006
prices)
Average
annual
growth (%)
Transactions
(2008=100)
Revenue
($M, 2006
prices)
Average
annual
growth (%)
2008
100 0.0 - 100 0.0 -
2010
96 20.3 - 71 5.1 -
2014
90 28.6 9.0% 43 4.5 -2.7%
2018
83 39.5 8.4% 39 6.1 7.8%
2022
89 42.4 1.8% 40 6.3 0.7%
2026
95 45.4 1.7% 41 6.5 0.7%
2036
103 47.3 0.4% 53 8.1 2.3%
2046
107 51.1 0.8% 62 9.8 2.0%
2066
118 56.1 0.5% 75 12.0 1.0%
2086
130 61.7 0.5% 87 13.9 0.7%
2106
141 67.1 0.4% 99 15.7 0.6%

New Jersey Turnpike & Route 440 Asset Appraisal
70
T
ABLE 6.16 ROUTE 440 - TRAFFIC AND REVENUE FORECASTS – TOLL SCENARIO V
Cars Trucks
Year
Transactions
(2008=100)
Revenue
($M, 2006
prices)
Average
annual
growth (%)
Transactions
(2008=100)
Revenue
($M, 2006
prices)
Average
annual
growth (%)
2008
100 0.0 - 100 0.0 -
2010
96 20.3 - 71 5.1 -
2014
90 28.6 9.0% 43 4.5 -2.7%
2018
83 39.4 8.3% 38 6.1 7.8%
2022
67 48.1 5.1% 25 6.0 -0.4%
2026
73 52.0 2.0% 27 6.4 1.6%
2036
84 57.6 1.0% 42 9.7 4.2%
2046
88 62.6 0.8% 45 10.9 1.2%
2066
98 70.0 0.6% 57 13.7 1.2%
2086
108 77.1 0.5% 67 16.0 0.8%
2106
118 84.0 0.4% 77 18.4 0.7%
TABLE 6.17 ROUTE 440 - TRAFFIC AND REVENUE FORECASTS – TOLL SCENARIO VI
Cars Trucks
Year
Transactions
(2008=100)
Revenue
($M, 2006
prices)
Average
annual
growth (%)
Transactions
(2008=100)
Revenue
($M, 2006
prices)
Average
annual
growth (%)
2008
100 0.0 - 100 0.0 -
2010
91 22.5 - 57 4.7 -
2014
101 23.0 0.5% 68 5.2 2.5%
2018
86 39.4 14.4% 39 5.9 3.4%
2022
75 54.7 8.6% 33 8.1 8.2%
2026
81 57.0 1.0% 34 8.1 0.2%
2036
90 61.0 0.7% 42 9.5 1.6%
2046
93 64.1 0.5% 48 11.1 1.5%
2066
103 70.4 0.5% 59 13.6 1.0%
2086
114 77.2 0.5% 71 16.1 0.8%
2106
125 84.0 0.4% 82 18.5 0.7%

New Jersey Turnpike & Route 440 Asset Appraisal
71
Review of Responses in Demand to Toll Changes
6.22 As part of our work we undertook a review of existing studies of how the level of demand
for a toll road might change in the face of changes in toll levels. We note that, in the
literature as elsewhere, this is commonly referred to as a toll elasticity – with a
concomitant perception that such an elasticity revealed on a particular project is in some
way general and thus can be transferred/ compared across different projects. This is, of
course, not the case: the response of toll road users to changes in toll levels is project
specific, reflecting the comparative attractions of the toll road and its competitors.
However, given that many projects have been constructed in congested areas, with
broadly similar comparative advantage for the tolled facility, it does remain interesting to
examine what has happened on other facilities across the United States.
6.23 It was found that there is a considerable body of existing evidence on so-called demand
elasticities, with several studies specific to New Jersey and others relating to other States.
6.24 The tolls on the New Jersey toll roads (NJTP, GSP and ACE) are currently low – in
comparison with most other facilities within the United States, and certainly with tolled
facilities in other advanced economies – while the advantage in using the toll road is high.
For most users, the level of toll is well below the indifference price: the toll can, for these
users, be raised very significantly before they will seriously consider using a free
alternative. At this point, we would expect the revealed demand elasticity to be very low.
However, if the tolls increase significantly the changes in behavior might themselves
become measurable, until a new equilibrium is achieved.
6.25 There are recent studies available for the NJTP and for the crossings between New Jersey
and New York, but not for the ACE or the GSP. The evidence from the recent research on
the NJTP Time of Day Pricing Initiative suggests that the demand for the road is relatively
inelastic to price. This is consistent with the available evidence from time-series data of
traffic and revenue for the NJTP, GSP and ACE, which again points to the demand being
relatively inelastic.
6.26 In the first phase of this study (the Scoping Study), our analysis was based on an elasticity
approach – relying on imported values derived from our experience elsewhere. Elasticity
estimates of -0.1 for the NJTP, -0.07 for the GSP and -0.12 for the ACE were adopted,
taking on board additional local evidence from time series of transaction and revenue for
the NJTP, the GSP and the ACE. In the Phase II analysis, however, we employed the
State-wide network assignment model to estimate directly the impact of toll increases on
NJTP usage; this analysis indicated elasticity estimates in a range from -0.2 to -0.3. We
have further reviewed the elasticity estimates by time of day, journey purpose and vehicle
type. We have found that the out-turn weekday peak elasticities are indeed in line with our
Phase I assumptions, but that off-peak elasticities are significantly higher than those
adopted earlier. The results obtained from the models are, on review, unsurprising. The
assignment models show traffic diverting onto the competing routes, when (as in the off-
peak) capacity is genuinely available.

New Jersey Turnpike & Route 440 Asset Appraisal
72
6.27 To provide further validation of our results, we reviewed modeled elasticities developed in
work carried out in the development of forecasts for the Indiana Toll Road. On the first 24
miles - close to Chicago with high volumes on the road and in the corridor in general -
there is a single toll barrier with a toll of c2.08/ mi and c7.29/ mi,. Here the elasticities
derived from the models were -0.23 (cars) and -0.07 (trucks). In the rest of the 125 miles
of the road, which runs across the rural areas in the north of Indiana and is lightly used,
the elasticities derived from the models were substantially higher, in the range -0.69 to -
0.34 for cars and -0.19 to -0.14 for trucks.
6.28 Similarly, work carried out by Maunsell Aecom on the Houston toll road system looking
at the response of demand to actual toll increases in 2004, suggested effective elasticities
ranging between -0.08 and -0.32. Further, the work showed that, on the predominantly
radial toll roads, the traffic levels were more responsive to toll changes – while the orbital
routes revealed lower elasticities.
6.29 The 2003 paper "Demand Elasticity on Tolled Motorways" by Anna Matas and José-Luis
Raymond for the Journal of Transportation and Statistics states that most demand
elasticities are within the -0.2 to -0.3 range, though an overall range of -0.03 to -0.5 was
found.
6.30 We concluded from this review that the elasticities we derived from the models developed
for the analysis in New Jersey were both realistic in terms of the network performance
across New Jersey and broadly in line with the behavior of travelers elsewhere.

New Jersey Turnpike & Route 440 Asset Appraisal
Appendix
APPENDIX A
MAPS

New Jersey Turnpike & Route 440 Asset Appraisal
Appendix
Detailed Overview Maps
FIGURE A.1 NJTP - NORTHERN SECTION

New Jersey Turnpike & Route 440 Asset Appraisal
Appendix
F
IGURE A.2 NJTP - CENTRAL SECTION

New Jersey Turnpike & Route 440 Asset Appraisal
Appendix
F
IGURE A.3 NJTP - SOUTHERN SECTION

New Jersey Turnpike & Route 440 Asset Appraisal
Appendix
APPENDIX B
FORECASTS

New Jersey Turnpike & Route 440 Asset Appraisal
Appendix
APPENDIX: TABLE B.1 NJTP - REVENUE FORECAST SUMMARY ($M, 2006 PRICES)
Year SC I SC II SC III SC IV SC V SC VI
2008
545.7 544.5 544.5 547.0 547.2 545.3
2009
548.7 546.9 546.9 550.5 550.8 548.0
2010
596.7 685.7 754.3 761.4 761.9 833.8
2011
599.2 694.0 766.2 774.8 775.5 847.9
2012
601.3 701.8 777.3 787.5 788.3 862.0
2013
603.2 709.0 787.8 799.5 800.4 875.5
2014
654.5 846.6 1005.0 1023.2 1024.3 888.6
2015
655.9 858.0 1021.1 1041.4 1042.6 901.1
2016
656.9 869.0 1035.9 1058.2 1059.6 912.6
2017
657.7 879.2 1049.7 1074.2 1075.6 923.4
2018
712.4 1029.6 1105.5 1349.3 1349.4 1295.8
2019
712.6 1042.1 1119.9 1369.5 1370.0 1315.6
2020
712.5 1053.7 1133.3 1389.5 1390.6 1346.3
2021
712.2 1064.7 1145.8 1409.5 1411.0 1375.5
2022
770.2 1119.2 1206.9 1500.5 1881.7 1576.0
2023
769.3 1130.3 1219.8 1520.7 1881.2 1573.1
2024
768.1 1140.7 1231.6 1539.6 1912.7 1571.4
2025
766.7 1151.2 1242.3 1557.4 1944.0 1569.1
2026
828.0 1208.8 1308.9 1655.2 2081.1 1610.1
2027
826.2 1221.5 1322.6 1672.6 2078.4 1623.3
2028
824.4 1237.7 1338.2 1687.9 2114.3 1661.5
2029
822.4 1256.9 1354.8 1702.2 2148.6 1709.6
2030
887.7 1325.8 1434.3 1808.0 2306.9 1775.6
2031
879.8 1335.2 1441.5 1811.0 2285.2 1804.1
2032
871.8 1343.5 1450.2 1812.8 2303.7 1837.4
2033
863.8 1351.6 1458.3 1813.7 2321.0 1872.0
2034
926.1 1415.4 1531.1 1913.3 2471.4 1911.5
2035
917.0 1423.6 1539.6 1914.4 2446.9 1947.1
2036
908.0 1430.7 1547.3 1914.5 2467.7 1986.8
2037
898.9 1436.4 1554.3 1913.7 2486.3 2026.1
2038
963.2 1507.1 1630.4 2019.4 2648.2 2058.1
2039
953.4 1513.2 1637.8 2018.5 2619.4 2097.9
2040
943.6 1517.9 1644.9 2016.5 2636.7 2143.2
2041
933.9 1521.3 1651.8 2013.7 2651.7 2187.9

New Jersey Turnpike & Route 440 Asset Appraisal
Appendix
2042
1000.3 1599.2 1730.2 2125.6 2826.6 2211.6
2043
989.8 1602.8 1737.7 2122.6 2792.0 2256.6
2044
979.3 1605.1 1744.3 2118.6 2805.6 2304.7
2045
968.8 1606.2 1750.1 2114.8 2817.0 2351.7
2046
1037.3 1691.3 1831.7 2232.3 3005.1 2367.7
2047
1026.1 1692.4 1838.1 2228.9 2964.7 2415.4
2048
1014.8 1692.3 1843.6 2224.8 2974.6 2466.2
2049
1003.7 1691.1 1848.4 2219.9 2982.3 2515.6
2050
1071.3 1775.7 1924.6 2334.1 3168.7 2510.8
2051
1056.3 1767.1 1921.7 2320.0 3108.6 2547.7
2052
1041.5 1757.7 1918.2 2305.5 3101.3 2587.3
2053
1026.9 1747.7 1914.0 2290.4 3093.1 2625.4
2054
1095.9 1837.0 1992.2 2408.6 3287.6 2614.9
2055
1079.6 1823.9 1986.7 2398.9 3222.1 2663.5
2056
1063.5 1810.3 1979.9 2388.4 3213.7 2715.6
2057
1047.6 1795.3 1972.1 2377.0 3206.3 2767.5
2058
1117.0 1886.5 2053.1 2506.7 3405.1 2758.8
2059
1100.3 1871.2 2045.8 2495.4 3339.0 2810.3
2060
1083.7 1855.2 2037.3 2484.3 3330.6 2867.9
2061
1067.4 1838.4 2027.7 2472.4 3320.5 2924.3
2062
1138.1 1933.6 2114.0 2608.9 3528.9 2906.7
2063
1120.9 1916.1 2104.8 2596.6 3459.4 2965.7
2064
1103.9 1898.1 2094.6 2583.4 3452.5 3028.2
2065
1087.1 1880.7 2082.7 2569.3 3445.9 3088.1
2066
1159.1 1978.3 2174.8 2712.3 3663.6 3065.6
2067
1141.5 1959.7 2163.9 2697.8 3593.8 3128.2
2068
1124.0 1941.5 2150.0 2682.4 3586.4 3194.6
2069
1106.8 1923.0 2134.6 2666.3 3577.2 3258.1
2070
1180.2 2023.2 2234.4 2815.8 3805.7 3229.1
2071
1162.1 2004.3 2219.6 2799.0 3731.2 3294.9
2072
1144.2 1985.0 2202.3 2781.5 3720.8 3364.1
2073
1126.6 1965.4 2184.4 2763.3 3708.6 3429.6
2074
1201.2 2069.0 2290.5 2919.2 3947.8 3394.2
2075
1182.3 2048.2 2271.8 2898.7 3866.5 3459.5
2076
1163.7 2027.1 2252.9 2877.5 3850.9 3528.4
2077
1145.4 2005.8 2233.3 2855.8 3833.8 3593.1
2078
1220.9 2112.0 2342.5 3016.1 4081.0 3548.9
2079
1201.6 2090.1 2322.8 2993.8 3995.5 3616.5

New Jersey Turnpike & Route 440 Asset Appraisal
Appendix
2080
1182.6 2067.9 2302.4 2971.6 3977.3 3687.6
2081
1163.9 2045.5 2281.5 2948.8 3957.6 3754.3
2082
1240.6 2155.0 2395.0 3114.5 4215.1 3704.3
2083
1220.9 2132.0 2373.7 3090.9 4125.2 3773.9
2084
1201.5 2108.7 2352.0 3066.6 4104.1 3847.2
2085
1182.4 2085.2 2329.7 3041.9 4081.6 3915.7
2086
1260.4 2198.0 2447.4 3213.6 4349.3 3859.7
2087
1240.2 2173.8 2424.7 3187.9 4255.0 3931.3
2088
1220.4 2149.4 2401.5 3161.6 4231.0 4006.8
2089
1200.9 2124.8 2377.9 3134.9 4205.6 4077.1
2090
1280.1 2240.9 2499.9 3312.6 4483.4 4015.0
2091
1259.6 2215.5 2475.7 3284.9 4384.7 4088.7
2092
1239.3 2190.0 2451.1 3256.6 4357.8 4166.3
2093
1219.4 2164.3 2426.0 3228.0 4329.6 4238.5
2094
1299.8 2283.7 2552.2 3411.7 4617.6 4170.4
2095
1278.9 2257.2 2526.5 3381.9 4514.5 4246.1
2096
1258.2 2230.6 2500.4 3351.6 4484.7 4325.9
2097
1237.9 2203.9 2473.9 3321.0 4453.6 4399.8
2098
1319.5 2326.5 2604.4 3510.7 4751.7 4325.8
2099
1298.1 2298.9 2577.3 3478.8 4644.3 4403.5
2100
1277.1 2271.2 2549.7 3446.6 4611.5 4485.5
2101
1256.3 2243.5 2521.9 3413.2 4577.6 4559.4
2102
1339.2 2369.3 2656.6 3609.7 4885.9 4481.1
2103
1317.4 2340.6 2628.0 3573.9 4774.0 4561.0
2104
1295.9 2311.8 2599.1 3537.9 4738.4 4642.0
2105
1274.8 2283.0 2569.9 3500.7 4701.6 4707.3
2106
1358.8 2412.2 2708.8 3703.6 5020.0 4636.5
2107
1336.6 2382.4 2678.8 3664.1 4903.8 4714.6

New Jersey Turnpike & Route 440 Asset Appraisal
Appendix
A
PPENDIX: TABLE B.2 ROUTE 440 - REVENUE FORECAST SUMMARY ($M, 2006 PRICES)
Year SC I SC II SC III SC IV SC V SC VI
2008
0.0 0.0 0.0 0.0 0.0 0.0
2009
0.0 0.0 0.0 0.0 0.0 0.0
2010
19.6 22.7 25.3 25.3 25.3 27.2
2011
19.5 22.8 25.4 25.5 25.5 27.5
2012
19.4 22.9 25.6 25.7 25.7 27.7
2013
19.4 22.9 25.7 25.8 25.8 27.9
2014
20.9 27.5 33.0 33.2 33.1 28.1
2015
20.9 27.7 33.1 33.2 33.2 28.3
2016
20.7 27.8 33.1 33.3 33.3 28.5
2017
20.6 28.0 33.1 33.3 33.3 28.6
2018
22.3 32.0 35.1 45.6 45.6 45.3
2019
22.2 32.3 35.1 45.8 45.8 45.4
2020
22.1 32.6 35.1 46.1 46.0 45.6
2021
21.9 32.8 35.1 46.2 46.2 45.8
2022
23.7 33.9 37.2 48.7 54.1 62.8
2023
23.6 34.2 37.2 48.9 57.7 62.6
2024
23.4 34.4 37.2 49.0 58.5 62.4
2025
23.2 34.7 37.1 49.1 59.4 62.2
2026
25.1 35.8 39.3 51.9 58.4 65.1
2027
24.9 36.1 39.2 51.9 61.5 65.0
2028
24.7 36.4 39.2 51.8 62.3 65.1
2029
24.6 36.6 39.2 51.7 62.9 65.5
2030
26.6 37.8 41.4 54.4 62.5 67.8
2031
26.3 37.9 41.2 54.1 64.7 67.9
2032
25.9 38.0 41.0 53.8 65.1 68.1
2033
25.6 38.1 40.7 53.5 65.4 68.4
2034
27.6 39.2 42.8 56.0 65.3 69.6
2035
27.2 39.3 42.6 55.7 67.0 70.0
2036
26.9 39.4 42.4 55.4 67.3 70.5
2037
26.6 39.5 42.1 55.1 67.5 71.1
2038
28.5 40.5 44.3 57.7 68.0 71.5
2039
28.2 40.6 44.0 57.3 69.4 72.2
2040
27.9 40.7 43.8 57.0 69.6 73.0
2041
27.6 40.8 43.5 56.7 69.7 73.8
2042
29.5 41.8 45.7 59.3 70.7 73.3
2043
29.2 42.0 45.4 59.0 71.7 74.3

New Jersey Turnpike & Route 440 Asset Appraisal
Appendix
2044
28.8 42.1 45.2 58.6 71.8 75.4
2045
28.5 42.1 44.9 58.3 71.9 76.4
2046
30.5 43.2 47.1 60.9 73.4 75.2
2047
30.1 43.3 46.8 60.6 74.0 76.5
2048
29.8 43.4 46.6 60.3 74.0 77.8
2049
29.5 43.5 46.3 59.9 74.0 79.1
2050
31.4 44.4 48.4 62.4 75.9 76.9
2051
30.9 44.4 48.0 61.9 75.9 78.3
2052
30.5 44.4 47.6 61.5 75.7 79.7
2053
30.1 44.4 47.2 61.0 75.5 80.9
2054
32.0 45.3 49.4 63.5 77.8 78.2
2055
31.6 45.4 49.0 63.1 77.6 80.0
2056
31.2 45.4 48.7 62.8 77.4 81.6
2057
30.8 45.5 48.4 62.4 77.3 83.1
2058
32.8 46.5 50.7 65.0 79.7 80.1
2059
32.3 46.6 50.3 64.6 79.5 82.0
2060
31.9 46.6 50.0 64.3 79.3 83.9
2061
31.5 46.6 49.6 63.9 79.2 85.4
2062
33.5 47.7 52.0 66.6 81.7 82.0
2063
33.1 47.7 51.6 66.2 81.4 84.1
2064
32.6 47.8 51.3 65.8 81.3 86.1
2065
32.2 47.7 50.9 65.3 81.1 87.7
2066
34.2 48.9 53.3 68.1 83.7 84.0
2067
33.8 48.9 52.9 67.7 83.3 86.2
2068
33.3 48.9 52.5 67.3 83.2 88.4
2069
32.9 48.9 52.1 66.8 83.0 90.1
2070
35.0 50.1 54.6 69.7 85.6 85.9
2071
34.5 50.1 54.2 69.2 85.2 88.3
2072
34.0 50.1 53.8 68.8 85.1 90.6
2073
33.6 50.0 53.4 68.3 84.9 92.4
2074
35.7 51.3 55.9 71.2 87.6 87.8
2075
35.2 51.2 55.5 70.7 87.1 90.4
2076
34.7 51.2 55.0 70.2 86.9 92.8
2077
34.2 51.1 54.6 69.7 86.7 94.6
2078
36.4 52.4 57.1 72.7 89.4 89.6
2079
35.9 52.3 56.7 72.2 88.9 92.3
2080
35.4 52.3 56.2 71.6 88.7 94.9
2081
34.9 52.2 55.8 71.1 88.5 96.8

New Jersey Turnpike & Route 440 Asset Appraisal
Appendix
2082
37.1 53.5 58.3 74.1 91.3 91.4
2083
36.6 53.5 57.9 73.6 90.7 94.3
2084
36.1 53.4 57.4 73.0 90.5 97.1
2085
35.5 53.3 57.0 72.5 90.3 99.0
2086
37.8 54.6 59.6 75.6 93.1 93.3
2087
37.3 54.6 59.1 75.0 92.5 96.3
2088
36.7 54.5 58.6 74.4 92.3 99.2
2089
36.2 54.3 58.1 73.8 92.1 101.1
2090
38.5 55.7 60.8 77.0 95.0 95.1
2091
37.9 55.7 60.3 76.5 94.3 98.3
2092
37.4 55.5 59.8 75.8 94.1 101.4
2093
36.8 55.4 59.3 75.2 93.9 103.3
2094
39.2 56.8 62.0 78.5 96.8 97.0
2095
38.6 56.8 61.5 77.9 96.1 100.3
2096
38.1 56.6 61.0 77.3 95.9 103.5
2097
37.5 56.5 60.5 76.6 95.7 105.5
2098
39.9 58.0 63.2 79.9 98.7 98.8
2099
39.3 57.9 62.7 79.3 97.9 102.3
2100
38.7 57.7 62.2 78.7 97.7 105.7
2101
38.2 57.6 61.7 78.0 97.5 107.7
2102
40.6 59.1 64.5 81.4 100.5 100.7
2103
40.0 59.0 63.9 80.7 99.7 104.3
2104
39.4 58.8 63.4 80.1 99.5 107.8
2105
38.8 58.6 62.9 79.4 99.3 109.8
2106
41.3 60.2 65.7 82.9 102.4 102.5
2107
40.7 60.1 65.1 82.2 101.5 106.4

New Jersey Turnpike & Route 440 Asset Appraisal
Appendix
APPENDIX C
ROAD EXPANSIONS

New Jersey Turnpike & Route 440 Asset Appraisal
Appendix
APPENDIX: TABLE.1 NJTP - ROAD EXPANSIONS
The Scenario I Scenario II Scenario III Scenario IV Scenario V Scenario VI
PRIMARY SECONDARY PRIMARY SECONDARY PRIMARY SECONDARY PRIMARY SECONDARY PRIMARY SECONDARY PRIMARY SECONDARY
1-2 No Expansion No Expansion No Expansion No Expansion No Expansion No Expansion No Expansion No Expansion No Expansion No Expansion No Expansion No Expansion
2-3 2073 No Expansion 2074 No Expansion 2076 No Expansion 2086 No Expansion 2089 No Expansion 2102 No Expansion
3-4 2105 No Expansion No Expansion No Expansion No Expansion No Expansion No Expansion No Expansion No Expansion No Expansion No Expansion No Expansion
4-5 No Expansion No Expansion No Expansion No Expansion No Expansion No Expansion No Expansion No Expansion No Expansion No Expansion No Expansion No Expansion
5-6 No Expansion No Expansion No Expansion No Expansion No Expansion No Expansion No Expansion No Expansion No Expansion No Expansion No Expansion No Expansion
6-7 No Expansion No Expansion No Expansion No Expansion No Expansion No Expansion No Expansion No Expansion No Expansion No Expansion No Expansion No Expansion
7-7A No Expansion No Expansion No Expansion No Expansion No Expansion No Expansion No Expansion No Expansion No Expansion No Expansion No Expansion No Expansion
7A-8 No Expansion No Expansion No Expansion No Expansion No Expansion No Expansion No Expansion No Expansion No Expansion No Expansion No Expansion No Expansion
8-8A No Expansion No Expansion No Expansion No Expansion No Expansion No Expansion No Expansion No Expansion No Expansion No Expansion No Expansion No Expansion
8A-9 2037 2080 2044 2092 2046 2095 2050 2102 2058 No Expansion 2065 No Expansion
9-10 No Expansion No Expansion No Expansion No Expansion No Expansion No Expansion No Expansion No Expansion No Expansion No Expansion No Expansion No Expansion
10-11 No Expansion No Expansion No Expansion No Expansion No Expansion No Expansion No Expansion No Expansion No Expansion No Expansion No Expansion No Expansion
11-12 2047 2075 2063 2090 2067 2095 2082 No Expansion 2092 No Expansion 2093 No Expansion
12-13 2035 2052 2046 2067 2048 2071 2064 2087 2079 2098 2081 2100
13-13A 2046 2080 2068 2100 2075 No Expansion 2095 No Expansion No Expansion No Expansion No Expansion No Expansion
13A-14 2054 2089 2076 No Expansion 2083 No Expansion 2100 No Expansion No Expansion No Expansion 2082 2102
14-SMB No Expansion No Expansion No Expansion No Expansion No Expansion No Expansion No Expansion No Expansion No Expansion No Expansion No Expansion No Expansion
14-14A 2056 No Expansion 2067 No Expansion 2075 No Expansion 2097 No Expansion 2097 No Expansion No Expansion No Expansion
14A-14B No Expansion No Expansion No Expansion No Expansion No Expansion No Expansion No Expansion No Expansion No Expansion No Expansion No Expansion No Expansion
14B-14C No Expansion No Expansion No Expansion No Expansion No Expansion No Expansion No Expansion No Expansion No Expansion No Expansion No Expansion No Expansion
SMB-15E E 2023 2092 2039 No Expansion 2047 No Expansion 2075 No Expansion 2092 No Expansion 2097 No Expansion
15E-15W E 2051 No Expansion 2075 No Expansion 2083 No Expansion No Expansion No Expansion No Expansion No Expansion No Expansion No Expansion
15W-15X E 2015 2022 2020 2027 2021 2031 2023 2058 2025 2067 2029 2073
15X-16E E 2015 2023 2020 2030 2021 2035 2023 2060 2026 2071 2032 2076
18E-NMB E No Expansion No Expansion No Expansion No Expansion No Expansion No Expansion No Expansion No Expansion No Expansion No Expansion No Expansion No Expansion
SMB-15E W 2075 No Expansion 2098 No Expansion 2106 No Expansion No Expansion No Expansion No Expansion No Expansion No Expansion No Expansion
15E-15W W 2074 No Expansion 2078 No Expansion 2082 No Expansion 2098 No Expansion No Expansion No Expansion No Expansion No Expansion
15W-16W W 2037 No Expansion 2042 No Expansion 2046 No Expansion 2062 No Expansion 2079 No Expansion 2088 No Expansion
16W-18W W No Expansion No Expansion No Expansion No Expansion No Expansion No Expansion No Expansion No Expansion No Expansion No Expansion No Expansion No Expansion
18W-NMB No Expansion No Expansion No Expansion No Expansion No Expansion No Expansion No Expansion No Expansion No Expansion No Expansion No Expansion No Expansion
