
Report Development
SL1 version 10.2.0

Table of Contents
Introduction 1
What is a Custom Report? 2
Report Input Forms 2
Gluecode 3
Report Output Templates 3
The Report Management Page 3
Creating a Report Template 4
Creating Queries for the Row Count Estimate Field 6
Types of Variables 9
Sample InputFilterArray 10
Query Example 1 10
Query Example 2 11
Best Practices 11
Running & Scheduling Reports 12
Quick Reports 13
Generating a Quick Report 13
Filling Out Input Forms 16
Scheduled Reports 16
Creating a Report Job 16
Running a Report Job 20
Scheduling a Report Job 21
Viewing Upcoming and Archived Scheduled Report Jobs 22
Viewing a Scheduled Report in the Inbox(Classic User Interface Only) 22
Input Forms 24
What is an Input Form? 26
Creating an Input Form 26
Adding and Configuring Input Form Components 27
Editing an Input Form 29
Deleting an Input Form 30
Static Layout Components 30
Text 31
Paragraph 31
Vertical Box 31
Horizontal Box 31
Field Set 32
Form Input Components 32
Checkbox 32
Dropdown Select 33
Hidden 33
Multiple Checkboxes 34
Multiple Select 34
Multiple Select with Category 35
Radio Buttons 36
Text Area 37
Text Field 37
Data Components 38
Concatenate 38
Correlate Lists 38
Filter List 39
Find In List 39

Formula 40
Predefined List 42
Select From List 42
Server Function 42
SQL Query 43
String Format 44
Switch Source 44
Custom Report Components 44
Developing Gluecode 46
What is Gluecode? 47
Processing Input Form Options 47
Available Resources 48
Output 48
Output Templates and Output Directives 48
Using the $output Array 49
Using the $em7_report object 53
Database Methods 56
autofetch_all 57
autofetch_all_assoc 59
autofetch_column 63
autofetch_column_multival 65
autofetch_columns 66
autofetch_row 67
autofetch_value 68
expunge_call 69
The Data Engine 70
What is the Data Engine? 71
Instantiating a Data Engine Object 71
Dynamic Application Data 72
Data Associated with Collection Labels 72
Availability Data 74
Web Content Monitoring Policy Data 74
Port Monitoring Policy Data 74
System Process Monitoring Policy Data 75
SOAP/XML Transaction Monitoring Policy Data 75
Domain Name Monitoring Policy Data 75
Email Round-Trip Monitoring Policy Data 75
Windows Service Monitoring Policy Data 76
File System Utilization Data 76
Interface Data - Percentage Utilization 76
Interface Data - Octets, Errors, and Discards 76
Bandwidth Billing Policy Data 77
ITService Data - Health, Availability, and Risk 77
ITService Data - Metrics 77
Time Range Methods 78
Normalized Data Methods 79
Return Normalized Data for a Specified Normalization Period 80
Return a Specified Number of Data Points of Normalized Data 80
Return a Specified Type of Normalized Data (Average, Minimum, Maximum, Standard Deviation, Sum) 80
Dynamic Application Methods 81
Return Information about a Dynamic Application 81
Return Information about a Presentation Object 82

Return Information about Indexes 83
Counter Processing Methods 84
Report Builder Methods 86
Other Methods 86
Data Retrieval Methods 87
Raw Data 87
Normalized Data 87
Data Series Object Retrieval Methods 88
Debugging Reports 89
Controlling Log Settings 90
Setting UI Developer Log Levels 90
Setting UI/REST MySQL Query Log Levels 90
Configuring Advanced Log Settings 91
Writing to the Log File 91
Report Output 92
What is an Output Template? 93
Output Methods 93
Array Binding Directives 94
Conditional Directives 95
Style Directives 95
Image and Chart Directives 95
Output Styles and Media 97
Using Theme Logos 98
Adding Global Styles 99
Report Output Media 100
Simple Tabular Report 102
Report Elements 103
Creating the Report Input Form 104
Creating the Report Output Template 105
Creating the Gluecode 110
Extracting Input Values 110
Processing Inputs and Building a WHERE Clause 111
Querying the Database 112
Populating the $output Array 114
Using $em7_report to Output Results 114
Populating the Date 115
Creating the Report Template 115
Full Code Listing for the $output Version 117
Full Code Listing for the $em7_report Version 118

Chapter
1
Introduction
Overview
In the Management section of the Reports page (Reports >Management), you can edit and create custom
reports. The reports you create will appear in the list of Quick Reports when running a quick report or Report
Definitions when creating a report job. You can edit an existing report to change the input options and the output
of the report.
Use the following menu options to navigate the SL1 user interface:
l
To view a pop-out list of menu options, click the menu icon( ).
l
To view a page containing all the menu options, click the Advanced menu icon ( ).
This chapter contains the following topics:
What is a Custom Report? 2
Report Input Forms 2
Gluecode 3
Report Output Templates 3
The Report Management Page 3
Creating a Report Template 4
1

2
What is a Custom Report?
A custom report in SL1 provides you with a collection of data from one or more tables in the SL1 database. This
information is populated and generated in different user-defined formats. You can select from default custom
reports provided by ScienceLogic, edit these default reports, or create your own reports. You can also schedule
reports, view a list of archived reports, and email reports to other users.
Custom reports include Quick Reports, which are custom report templates in SL1. Quick Reports are also called
"ad hoc reports". You can access Quick Reports on the Reports page, in the Run Report category (Reports> Run
Report).
A report includes three components:
l An input form where you select the options and data you want to include in the report.
l An .ods output template that specifies the format of the generated report.
l Gluecode, the code that specifies how to handle your input, which data to retrieve, and any processing that
needs to be performed on the data.
SL1 includes predefined reports, with defined forms, output templates, and the gluecode. These predefined
reports can be modified, and you can create your own custom reports.
Report Input Forms
An input form defines the user interface for a report. The user interface for a report allows the user to select
options and data to include in the report. The Report Input Forms page (Reports > Management > Report
Input Forms) displays a list of the input forms in your SL1 system. You can edit these input forms for your business
needs, or you can create your own input forms for your reports.
An input form includes one or more components. You can include the following types of input components in an
input form:
l Static Layout Component. Provides containers for laying out the user interface, labels, and text boxes. For
example, you can use these components to keep fields together in a horizontal group.
l Form Input Component. Allows the user to specify inputs when generating an instance of the report. For
example, checkboxes and drop-down fields.
l Data Component. Allows you to include dynamic elements in the user interface for a report. These
dynamic elements can retrieve data from the database and alter input items based on criteria, including
formulas and switch statements. For example, if you select the checkbox Select individual devices, the
Devices by Organization field displays a list of devices. This behavior is defined with Data Components.
What is a Custom Report?

Gluecode
l Custom Report Components. Allows you to define a common combination of input elements and then use
that combination of input elements in multiple report input forms, without having to construct each
combination of input elements in each input form. For example, the Organization Selector (a default
Custom Report Component included with SL1) provides options to select either the All Organization
checkbox or to select from the list of Organizations.
Gluecode
Gluecode is PHP code that is executed by the report engine when the report is generated. The gluecode must:
l Process the inputs from the Input Form.
l Make queries to the database or use other methods to gather the required data.
l Format the data so it can be populated into the Output Template.
You can add and edit gluecode on the Report Management page (Reports > Management > Report
Manager).
Report Output Templates
An Output Template is an Open Office Spreadsheet file (.ods file) that defines the formatting and table structure
for the generated report. When developing a report, you can includes output directives in the report template to
tell the report engine which data from the gluecode to include in the report and where to place each output in the
final report.
Each default custom report has an associated output template that can be edited. You can also create your own
output template and upload it to the Report Output Templates page (Reports > Management > Report Output
Templates).
CAUTION: When creating or editing a report output template, do not use spaces in the template name.
The Report Management Page
The Report Management page (Reports > Management > Report Manager) lists all custom reports that have
been created or installed on your SL1 system:
3

4
The Report Management page displays the following columns:
TIP: To sort the list of reports, click on a column heading. The list will be sorted by the column value, in
ascending order. To sort the list by descending order, click the column heading again.
l ReportTitle. The title of the report.
l Version. The version number of the report.
l Author. The author of the report.
l ID. The numeric IDassigned to the report by this SL1 system.
l PowerPack.Indicates whether the report is included in a PowerPack.
l Last Edited By. The user that last edited or installed this report.
l Last Edited On. The date and time that this report was last edited or installed.
Creating a Report Template
If you are developing a new report, you must create a report template. A report template allows you to define all
the parts of a report. A report template specifies identifying information about a report, and the Report Input
Form, Report Output Template, and gluecode that will be used to generate instances of a report.
To create a report template:
1.
On the Reports page ( ), expand the Management section and select Report Manager (Reports >
Management > Report Manager). The Report Management page appears.
Creating a Report Template

Creating a Report Template
2. Click the [Create] button. The Report Template Editor page appears:
3. Complete the following fields:
l Template Name. Type a name for the report. Do not use spaces in the template name. This name
will appear in the left NavBar on the Reports page and in drop-down lists that display reports.
l Version. Type a version number for the report. ScienceLogic recommends changing the version
number every time you edit a report.
l Author. Type the name of the person or company that developed the report. This field is
automatically populated with the first and last name from your user account.
l DeliveryMethod. This option allows you to limit the options that are available when a user
schedules this report. Select the methods by which scheduled instances of this report can be
delivered.
l Input Form. Select the input form for the report. For information about input forms, see the Input
Forms section.
l Output Template. Select the output template for the report. For information about output templates,
see the Report Output section.
l Description.Type a description of the report. This field is optional.
l Category. Select one or more categories for the report. Categories are used to arrange the list of
reports in the left NavBar and in drop-down lists that display reports. This field is optional.
l Key Words. Add a comma-separated list of keywords that describe the report. This field is optional.
5

6
l Report Count Query. This query populates the RowCount Estimate field for the report, and this
query executes in the background with each input filter change made by the report user. The Row
Count Estimate field informs users before they generate reports that are so large that SL1 cannot
create them successfully. The query can include variables for the fields that a user selects in the report
(Input Forms). The variables can be scalars or lists. As the user selects or de-selects Inputs, such as
selecting Devices, then de-selecting Devices and selecting Assets instead, the query is re-run, and a
new value appears in the RowCount Estimate field.
l Name. If the report requires multiple possible queries based on the inputs that the user selects, type a
name for each query, such as "devices" and "assets". Based on the input selected by the user, one of
the two queries will be used to get the row count estimate. If the report requires only a single query,
type "default" in this field. Click the [Add Row] button to add additional queries. Do not use double
quotes (") or the back slash character (\) in this field.
l Query. Add an SQL query that returns the total possible number of data rows in the report using the
inputs selected buy the user. The query includes variables for fields that a user selects from the Input
Form. The query can include variables for scalar values (single values) and variables for list values
(multiple values). For more information about the SQL query for this field, see Creating Queries for
the Row Count Estimate Field. Do not use double quotes (") or the back slash character (\) in this
field.
NOTE: Thegoal of the SQL query in the Query field is to provide an estimate of the returned
rows, but the query should be as lightweight as possible. Do not re-use the SQL query
that populates the report.
l [Add Row]. Click this button to add another row containing the name and query code for an
additional query for this template. You can add up to eight queries. Click the red cancel icon ( ) to
remove a query that you previously added.
NOTE: To disable the RowCount Estimate feature, de-select the Report Size Estimation
option on the Behavior Settings page (System>Settings >Behavior). This feature is
enabled by default. If you disable this feature, SL1 retains the queries you created in the
Query field, but SL1 will not run those queries when you create reports.
l Query/Template Binding Code. Enter the gluecode for the report. For information about how to
write gluecode, see the Developing Gluecode section.
4. Select the [Save] button.
Creating Queries for the Row Count Estimate Field
When you create or edit a report, you can include one or more SQL queries that enables SL1 to estimate the
number of rows in the report before generating the report. You add the queries to the Query field on the Report
Template Editor page (Reports >Management >Report Manager). The result of the additional query or
queries appears in the RowCount Estimate field.
Creating a Report Template

Creating a Report Template
NOTE: The query author will need to understand SL1databases and SQL.
The queries for the RowCount Estimate field use variables that are replaced with the report input values selected
by the report user. You can use any of the variables that are available in the existing reports on the Report Input
Forms page (Reports >Management >Report Input Forms).
TIP: To help you build a query for a new report, locate a report with similar features to the report you want to
create, and use that report and its variables as a template for the new query.
To locate the variables for your report query:
1. Go to the Report Input Forms page (Reports >Management >Report Input Forms) and click the wrench (
) for the report that contains the variables you want to use in your query. In this example, we are using the
"Device-At-A-Glance" report. The Report Form Editor page appears:
7

8
2.
In the FormStructure section, click the wrench ( ) for the form that you want to use with your query. An
EditingEntity Selector modal page appears:
3. Make a note of the name used in the Input name field and close the modal page. This is the name of the
query that is used bySL1 when it calls an AJAX request to update the RowCount Estimate field.
4. Review any other forms from the FormStructure section as needed.
5. Go to the list of reports (Reports >Run Report) and navigate to the report that contains the variables that
you want to use in your query, such as the "Device-At-A-Glance" report.
6. In your browser, press [F12] to open the Web Developer console panel and click the [Network] tab:
Creating a Report Template

Creating a Report Template
7. In the File column of the Web Developer console panel, select index.em7?exec=get_report_
estimate. This is the name of the AJAX call used by SL1.
8. Click the [Response] tab. Based on what button or field you have selected in the report, this tab displays the
input filter array used in the AJAX call. For a complete example of an input filter array, see the Sample
InputFilterArray, below.
TIP: If you click a different option in the report form in the SL1 user interface, another
index.em7?exec=get_report_estimate line appears for that option. A new input filter array for
that option appears on the [Response] tab.
9. You can use the variables from the input filter array on the [Responses] tab to build your query. For more
information, see the two Query Examples, below.
10. After you create your query or queries, go to the Report Management page (Reports > Management >
Report Manager) and click the wrench ( ) for the report template you are editing, or click [Create] to
create a new report template if needed.
11. On the Report Template Editor page, add the query to the Query field in the Report Count Query
section.
NOTE: If you include multiple queries in a report, they are stored as a serialized object in the database, and
the user-selected values from the input form replace the variables in the in the main query. As each
input selection is made or changes, SL1 calls an AJAX request to update the count.
Types of Variables
You can use the following types of variables in the query:
1. Scalar. These variables will be replaced by a single value, such as Report Span Start value andReport Span
End value. Scalar variables should be defined between two "#" symbols, such as #is_admin#.
Scalar variables can be used in a query such as collection_date >= #span.start_ts#. span.start_ts can
have a single value, and it will be replaced by the timestamp value.
2. List.These variables will be replaced by multiple selected values, such as a list of organizations replaced
inside an “IN” clause. Another example is the Device Groups selector, where users can select multiple
device groups. List variables should be defined between two "@" symbols, such as @dev_ids@. List
variables can be used in a query, such as did IN @dev_ids@. dev_ids can have multiple values to check
against Device IDs, and it will be replaced by multiple values.
NOTE: dev_ids and is_admin are SL1 report variables that you can use in report queries as needed.
Scalar and list variables names are based on input filter names. For example, if you want to use start_ts and
end_ts values from the span Input Filters, the variable in the query should be formatted as #span.start_ts# and
#span.end_ts# for scalar variables, or @span.start_ts@ and @span.end_ts@ for list variables.
9
10
Sample InputFilterArray
The following code is an example of an input filter array used in the AJAX call to generate a report:
Array
(
[items] => Array
(
[select_type] => device
[all_items] => 0
[parents] => Array
(
)
[use_item_ids] => 0
[child_ids] => Array
(
)
)
[span] => Array
(
[interval] => 30
[begin] => 0
[beginyear] => 2020
[beginmonth] => 4
[beginday] => 1
[duration] => 1
[start_ts] => 1585699200
[isDST] => 0
[userTZ] => 19800
[end_ts] => 1588291200
[begindesc] => Apr 2020
[spandesc] => 1 month
[hours_included] => 1
[workday_start] => 8
[workday_end] => 18
[timezone_offset] => 0
)
)
Query Example 1
In this example #is_admin# is a scalar variable that will be replaced by a Boolean value 0 or 1. Also, @dev_
ids@ is a list variable that will be replaced by one or multiple device IDs, based on the selections made by the
user.
SELECT count(dev.id) FROM master_biz.organizations org
JOIN master_dev.legend_device dev ON (org.roa_id = dev.roa_id AND (#is_admin# OR))
JOIN master.definitions_dev_classes devclass ON dev.class_type=devclass.class_type
JOIN master.definitions_dev_cats cats ON devclass.family=cats.Fid
Creating a Report Template
Creating a Report Template
LEFT JOIN master_dev.device_hardware hw ON dev.id=hw.did AND hw.comp_type=1
WHERE (#items_all_items# OR (dev.roa_id in AND
(NOT #items_use_item_ids# OR dev.id in @dev_ids@)))
AND (#dg_all_device_groups# OR dev.id in @dev_ids@)
AND (#cats_all_cats# OR cats.Fid IN)
Query Example 2
SELECT count(log.log_id) FROM master_biz.organizations_log log
JOIN master_biz.organizations org ON (log.roa_id = org.roa_id AND (#is_admin# OR ))
WHERE log.date_edit >= FROM_UNIXTIME(#span_start_ts#)
AND log.date_edit < FROM_UNIXTIME(#span_end_ts#)
AND (#org_all_orgs# OR org.roa_id IN )
AND (#source_all_sources# OR log.source IN)
AND (log.message like #in_message_text#)
Best Practices
l The value that appears in the RowCount Estimate field is not an exact prediction, but an estimate. As a
result, you should focus on getting the upper range of the report size instead of the exact count.
l To write a report size estimate query, you will need a good understanding of reports and how report input
filters work in reports. This includes identifying the filters that do not impact the row count, such as Separated
by Device Group, because using those filters in the query will not have any impact on the row count
estimate.
l Identify the filters according to their replacement logic, such as scalars or lists.
l In general, JOINcommands perform better than sub-queries when you need to collect data from more than
one table.
l To disable the RowCount Estimate feature, de-select the Report Size Estimation option on the Behavior
Settings page (System>Settings >Behavior). This feature is enabled by default.
11

Chapter
2
Running & Scheduling Reports
Overview
This chapter briefly describes the user interface for generating reports in SL1. For additional information about
the default reports that are included in SL1 and managing scheduled reports, see the Reports manual.
Use the following menu options to navigate the SL1 user interface:
l
To view a pop-out list of menu options, click the menu icon( ).
l
To view a page containing all the menu options, click the Advanced menu icon ( ).
This chapter includes the following topics:
Quick Reports 13
Generating a Quick Report 13
Filling Out Input Forms 16
Scheduled Reports 16
Creating a Report Job 16
Running a Report Job 20
Scheduling a Report Job 21
Viewing Upcoming and Archived Scheduled Report Jobs 22
Viewing a Scheduled Report in the Inbox(Classic User Interface Only) 22
12
13
Quick Reports
The Run Quick Report page (Reports > Run Report) allows you to select and manually generate a custom
report. You can choose the report to generate from the list of default custom reports in the SL1 system. This list
includes the default custom reports provided by ScienceLogic and any reports developed by you or another user
in the SL1 system. Quick Reports allow you to quickly generate a spreadsheet or graphical report using the
information you wish to view.
Generating a Quick Report
In the user interface for a report, users of type Administrator can view options and devices for all organizations.
Users of type User can view only options and devices for organizations of which they are a member.
You can specify how many days SL1 will retain data from reports by going to the Data Retention Settings page
(System >Settings >Data Retention)and adjusting the Ad-hoc and Scheduled Reports field. Possible values
are 0 - 365, in days. If you use the default value of 0, SL1 will remove files older than 30 days from the populated
directory: /opt/em7/gui/ap/www/em7/libs/od_templates/populated.
TIP: If you want to adjust the default timeout of 1800 seconds (30 minutes) for running a report, navigate to
the Run Report page for that report from the Reports page ( )and click the[Edit] button. On the
ReportTemplate Editor modal page, update the Timeout value and click [Save].
NOTE: Quick Reports run on the current appliance(the appliance on which the report user is logged into) in
a distributed SL1 stack.
WARNING: SL1 might not be able to generate reports that contain extremely large amounts of data. The
amount of data that SL1 can process when generating a report is constrained by the configured
memory limits of SL1. The upper limit of data is dependent on the number of rows, number of
columns, and the size of each field. Each report will have different data limits. For example, the
Interface Usage report is limited to 10,000 interfaces. For reports of a similar size, ScienceLogic
recommends you test to ensure that the report generates correctly with the number of data
points you require. If the report does not generate correctly, you will need to generate multiple
smaller reports. You can use the Row Count Estimate field next to the [Generate] button to
get an estimate of the number of rows that will appear in the report before SL1 generates it.
Quick Reports

Quick Reports
To generate a report on the Run Quick Report page:
1. Go to the Reports page ( )and expand the entry for Run Report (Reports> Run Report).
2. Expand the appropriate category, such as Asset Management or Devices, and select the report you want to
run. The Run Quick Report page appears:
NOTE: Quick Reports are listed by category. If a Quick Report is not associated with a category, that
Quick Report appears under the "Others" category. To assign or change a category for a
Quick Report, edit the Category field in the Report Template Editor page (Reports >
Management > Report Manager > create/edit).
14

15
3. Update the fields on the input form to specify the options and data to include in the report. For more
information, see Filling Out Input Forms.
As you update the fields for this report, the Row Count Estimate field next to the [Generate] button is
updated to provide an estimate of the number of rows that will appear in this report. You can use this field to
manage the size of the generated report by adding or removing items from the report as needed. To disable
the RowCount Estimate feature, de-select the Report Size Estimation option on the Behavior Settings
page (System>Settings >Behavior). This feature is enabled by default. For more information about how to
edit the settings for this field, see Creating a Report Template.
NOTE: The following reports utilize the Row Count Estimate field: Device-At-A-Glance, Device
Availability, Device Top Metrics, Device Top Utilization, Device Utilization, Interface In Use,
Interface Top Metrics, Monitored Element, and PowerPack Information.
4. In the Output Format drop-down at the bottom of the page, select a format in which to generate the report.
You can choose from Open Document Format (ODF) Spreadsheet(.ods), Microsoft Excel Spreadsheet
(.xlsx), Adobe Acrobat Document(.pdf), or a Web Page (.html).
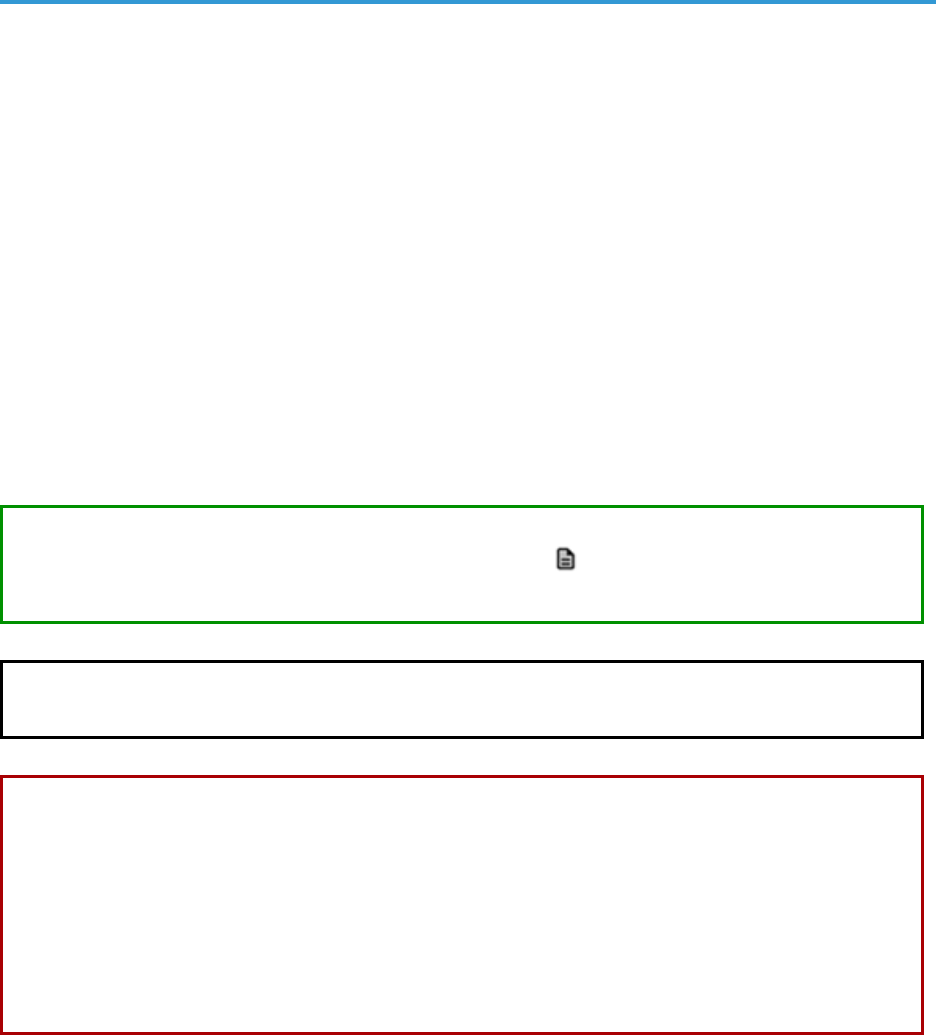
5. Click the [Generate] button. The Report Generation pop-up window appears with a message that a link
to your report will be displayed when the report is created. The link will also be sent to the mailbox of the
current user.
NOTE: You can opt to not receive an email with a link to a report by going to the Account
Preferences page (Preferences >Account >Preferences) and selecting No in the Ad-hoc
Report Email Preference field.
6. After the report is created, the Report Generation window displays a link to the report and icons that you
can click to download the report in various formats:
7. Save the report in the format you prefer and close the pop-up windows.
Quick Reports

Scheduled Reports
Filling Out Input Forms
After you select the report to run, you must specify the input options. The input form lets you select the options and
data to include in the report.
These options vary by report. However, the following input options appear for multiple default custom reports in
SL1 and are available for use in custom reports:
l Organizations. Select the organizations that you want to include data for in the report. You can select all
organizations, individual organizations, or a grouping of organizations. Organizations contain other
entities, like users, devices, assets, and policies.
l Select By. You can select the specific entities you want to include data for in the report. These options
include selecting by Org/Device, selecting by Org/Asset, and selecting by ESX Server/VM, among others.
l Report Span. Some reports provide input options that specify the time span that the data on the report
should cover. These options include Daily, Weekly, or Monthly.
l Device Categories. Select the device categories of the devices you want to include in the report. You can
select all device categories, individual device categories, or a grouping of device categories.
l Optional Columns. Provides a list of additional, optional information to include in the report.
TIP: As you update the fields for this report, the Row Count Estimate field next to the [Generate] button is
updated to provide an estimate of the number of rows that will appear in this report. You can use this
field to manage the size of the generated report by adding or removing items from the report as needed.
Scheduled Reports
You can schedule a custom report to be automatically generated by the SL1 system at a specific time, either once
or on a recurring schedule. Scheduled reports can be automatically emailed to users, external contacts, or
vendors, or delivered to the Inbox for users.
Creating a Report Job
You can define a report job in the Report Jobs page (Reports > Create Report > Report Jobs). From this page,
you can create a report job, run the report job, edit the report job, or delete the report job. To create a report job:
1. On the Reports page ( ),expand the entry for Create Report and select Report Jobs. The Report Jobs
page appears.
16

17
2. Click the [Create] button. The Report Job Editor page appears:
3. The Report Job Editor page contains fields where you can select the parameters of the report job. The
fields are:
l Job Title. Specify a title of up to 220 characters for the report job.
l Run as User. Specify the type of user to run the report as. When a scheduled report uses this report
job, the report generates as if the Run As User was running the report. This field is useful when a
system administrator, who can access all entities in all organizations, is configuring a report job for a
regular user, who is allowed to access only entities aligned with the regular user's organizations. Two
access hooks affect the behavior of the Run As User field:
o
Run As Org User. If this Access Hook is included in an Access Key that is aligned with your
account, the Run As User field will contain a list of users with the same primary organization
as your own. You can select one of these users to align with the generated report.
o
Run As Any User. If this Access Hook is included in an Access Key that is aligned with your
account, you will be able to schedule report jobs as any user. The Run As User field will
contain a list of all users. You can select one of these users to align with the generated report.
NOTE: If your user account does not include either of these Access Hooks, you can
schedule report jobs only as yourself. The Run As User field will not appear in
the Report Job Editor page. For more information on organization restrictions,
see the Access Permissions manual .
Scheduled Reports

Scheduled Reports
l Report Definition. Select a report from the list of all reports defined in the Report Management
page. Only report definitions to which you are allowed access will appear in this field. When you
select the report, the ReportOptions section for that specific report appears at the bottom of the
Report Job Editor page.
NOTE: Report definitions are listed by category. If a report definition is not associated with a
category, that report definition appears under the "Other" category. To assign or
change a category for a report definition, edit the Category field in the Report
Template Editor page (Reports > Management > Report Manager > create/edit).
l Report Appliance. Select the appliance on which to run the report, if more than one appliance is
available. By default the current appliance is selected. If you select "Active Database", SL1 locates the
active database server at run time and will execute the report on that database server.
l Job Recipients. Specifies the recipients for the report. Clicking in this field displays the Add
Recipients modal page, where you can select users, external contacts, and vendor contacts to
include in the Job Recipients field. To learn how to add job recipients to the report job, see Step 4,
below.
l Job Type. Specifies how the generated report will be delivered. Choices are:
o
Email & Archive. Report is emailed to the specified email address (in the Email To field) and
also archived on the server.
o
Archive. Report is stored on the server.
l Delivery Method. Specifies the method of delivery and the output format (if applicable) for the
report. Choices are:
o
Inline (HTML). The generated report will be sent to the selected users in the body of an Email.
o
Attachment. The generated report will be sent to the selected users as an attachment to an
Email. To select this option, select one of the output formats in the Attachment section of the
drop-down list.
o
Link to EM7. The generated report will be made available via a direct URL. The link will be sent
to the selected users in an email. To select this option, select one of the output formats in the
Link to EM7 section of the drop-down list.
For the Attachment and Link to EM7 options, the following output formats are available:
o
Adobe Acrobat Document (.pdf)
o
Web page (.html)
o
Microsoft Excel 2007+ Spreadsheet (.xlsx)
18

19
o
Open Document Format (ODF) Spreadsheet (.ods)
NOTE: The options that can be selected in the Delivery Method field are defined in the
Delivery Method field in the Report Template Editor page for the selected
report.
l Report Options. The interface for the selected report appears in this pane. Select the options you
want included in the automatically generated report. These options are limited by the Access Keys
aligned with your account and the organization memberships aligned with your account.
4. You can add recipients to a report in the Add Recipients modal page. The Add Recipients modal page
allows you to select users, external contacts, and vendor contacts to include in the "To" field of the Job
recipients field:
5. The options in the Add Recipients modal page are:
l Recipient Types. Displays checkboxes for EM7 User, External Contact, and Vendor. If a checkbox is
selected, the users in the selected contact group will appear in the Matched Recipients field.
l Search For. Select All recipients, Organization, Product, or Ticket Queue. The Matched Recipients
field will display only users in the specified group.
l Search. Enter the name of the user, external contact, or vendor you are searching for.
l Matched Recipients. Displays the possible recipients based on the criteria you specified in the
Recipient Types and/or Search For and/or Search fields.
Scheduled Reports

Scheduled Reports
6. To add a user, external contact, or vendor as a job recipient, select its checkbox. To select all users
displayed in the Matched Recipients field, select the checkbox next to the Action heading.
7. Click the [Add/Remove] button to add the selected users. To remove users as job recipients, de-select
users by removing the check mark and then clicking the [Add/Remove] button.
8. On the Report Jobs page, click the [Save] button. The new report job will appear in the list of report jobs in
the Report Jobs page.
Running a Report Job
After you save a report job, it will appear in the Report Jobs page. You can run the report job immediately from
this page.
You can specify how many days SL1 will retain data from reports by going to the Data Retention Settings page
(System >Settings >Data Retention)and adjusting the Ad-hoc and Scheduled Reports field. Possible values
are 0 - 365, in days. If you use the default value of 0, SL1 will remove files older than 30 days from the populated
directory: /opt/em7/gui/ap/www/em7/libs/od_templates/populated.
TIP: If you want to adjust the default timeout of 1800 seconds (30 minutes) for running a report, navigate to
the Run Report page for that report from the Reports page ( )and click the[Edit] button. On the
ReportTemplate Editor modal page, update the Timeout value and click [Save].
TIP: You might find it helpful to immediately run the report job to test the parameters you selected and verify
that the report is delivered correctly.
WARNING: To avoid potential "504 Gateway Timeout" errors, ScienceLogic recommends that you only run
a report job with a schedule, instead of using the lightning bolt icon ( ) to run the report job on
an ad-hoc basis. ScienceLogic recommends you run the report from the list of reports in the Run
Report entry on the Reports page.
To run a report job:
1. On the Reports page ( ),expand the entry for Create Report and select Report Jobs. The Report Jobs
page appears.
20
21
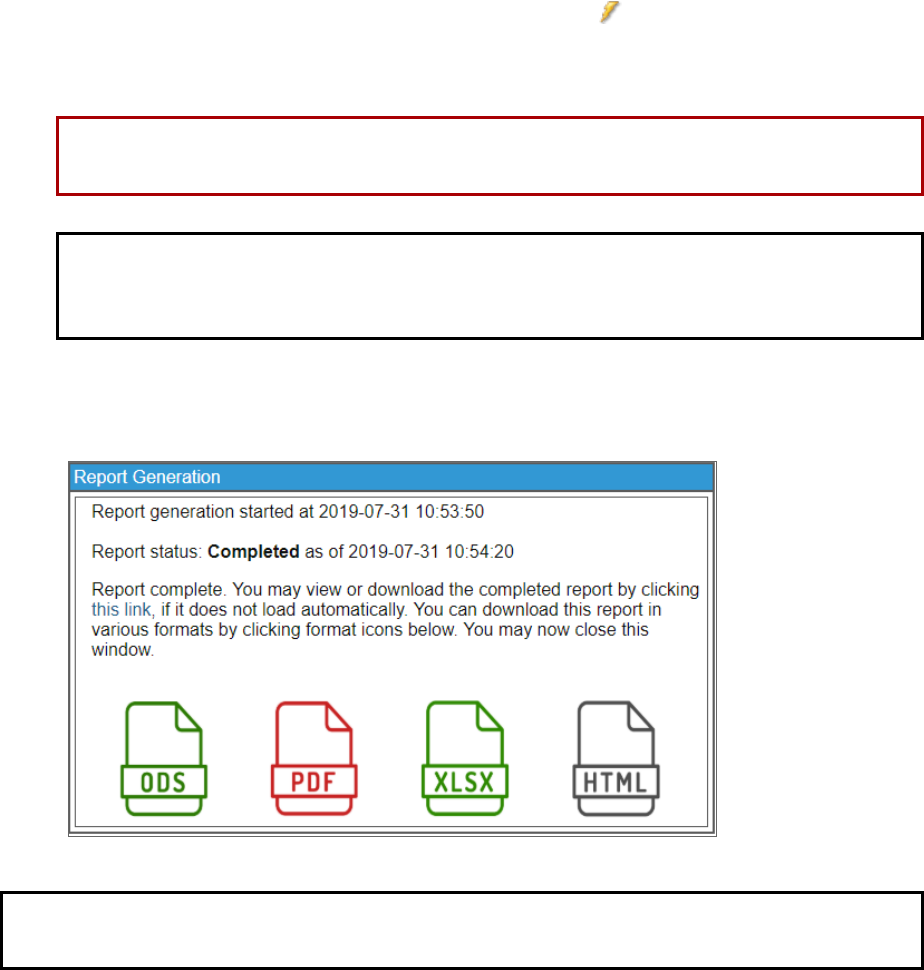
2. Find the report job you want to run and click its lightning bolt icon ( ). The Report Generation pop-up
window appears with a message that a link to your report will be displayed when the report is created. The
link will also be sent to the mailbox of the current user.
WARNING: To avoid potential timeout errors, ScienceLogic recommends that you use this option
sparingly.
NOTE: You can opt to not receive an email with a link to a report by going to the Account
Preferences page (Preferences >Account >Preferences) and selecting No in the Ad-hoc
Report Email Preference field.
4. After the report is created, the Report Generation window displays a link to the report and icons that you
can click to download the report in various formats:
NOTE: The report will be delivered to the Inbox of all users specified in the report job and any external email
addresses, if specified. The report will also appear in the Scheduled Report Archive page.
Scheduling a Report Job
After a report job has been created, you can schedule the report to run automatically on the report Schedule
Manager page (Reports >Create Report >Scheduler). Scheduled reports are automatically generated by SL1
once, at a specified time, or at specified regular intervals. You can select the day and time the report job runs or
the recurrence of the report job, if necessary, and save these parameters to view, edit, enable or disable, or
delete later.
Scheduled Reports

Scheduled Reports
NOTE: You can also view and manage all scheduled processes from the Schedule Manager page
(Registry > Schedules >Schedule Manager). For more information, see the System Administration
manual.
Viewing Upcoming and Archived Scheduled Report Jobs
The Scheduled Report Jobs page (Report >Create Report > Scheduled Job / Report Archive) displays a list of
all upcoming instances of scheduled report jobs. For example, if you schedule a PowerPack Information report to
run once a day, the Scheduled Report Jobs page will display the PowerPack Information scheduled report job
and its current status. This page automatically refreshes at a set interval; the default interval is 10 seconds.
NOTE: In the silo.conf file, the auto_page_refresh setting under [ADHOC_REPORT_IN_BATCH] defines the
interval at which this page refreshes, as well as other settings for ad hoc batch reports. For more
information about updating the silo.conf file, see the System Administration manual.
From the Scheduled Report Jobs page, you can also access the Scheduled Report Archive page by clicking
the [Archived Job] button in the top right corner of the page. (You can click the [Scheduled Job] button to
return to the Scheduled Report Jobs page.) The Scheduled Report Archive page displays a list of all past
report jobs. For example, if you schedule a Device Availability report to run once every hour, the Scheduled
Report Archive page will display each of the Device Availability reports that have already run.
Viewing a Scheduled Report in the Inbox(Classic User Interface Only)
If you are specified as a recipient of a scheduled report, you can view the report from your Inbox in the classic
user interface. This option is not available in the new SL1 user interface.
For a user to receive the results in their Inbox, they must be added to the Job recipients field when creating a
Report Job. To learn more about adding recipients to a Report Job, see the previous section on Creating a
Report Job.
22

23
To view a scheduled report from the Inbox:
1. Go to the [Inbox] tab in the classic user interface. If the Reports pane is minimized, click the pane header to
expand it. You will see a list of reports that you have created or that SL1 has delivered to you:
2. To view a report, select the bar graph icon ( ) for the report you want to view.
3. To delete a report from your Inbox, select its bomb icon ( ).
Scheduled Reports

Chapter
3
Input Forms
Overview
This chapter describes how to create and manage input forms to use in custom reports in SL1.
Use the following menu options to navigate the SL1 user interface:
l
To view a pop-out list of menu options, click the menu icon( ).
l
To view a page containing all the menu options, click the Advanced menu icon ( ).
This chapter includes the following topics:
What is an Input Form? 26
Creating an Input Form 26
Adding and Configuring Input Form Components 27
Editing an Input Form 29
Deleting an Input Form 30
Static Layout Components 30
Text 31
Paragraph 31
Vertical Box 31
Horizontal Box 31
Field Set 32
Form Input Components 32
Checkbox 32
24

25
Dropdown Select 33
Hidden 33
Multiple Checkboxes 34
Multiple Select 34
Multiple Select with Category 35
Radio Buttons 36
Text Area 37
Text Field 37
Data Components 38
Concatenate 38
Correlate Lists 38
Filter List 39
Find In List 39
Formula 40
Predefined List 42
Select From List 42
Server Function 42
SQL Query 43
String Format 44
Switch Source 44
Custom Report Components 44

What is an Input Form?
What is an Input Form?
An input form defines the user interface for a report. The user interface for a report allows the user to select
options and data to include in the report. The Report Input Forms page (Reports > Management > Report
Input Forms) displays a list of the input forms in your SL1 system. You can edit these input forms for your business
needs, or you can create your own input forms for your reports.
An input form includes one or more components. You can include the following types of input components in an
input form:
l Static Layout Component. Provides containers for laying out the user interface, labels, and text boxes. For
example, you can use these components to keep fields together in a horizontal group.
l Form Input Component. Allows the user to specify inputs when generating an instance of the report. For
example, checkboxes and drop-down fields.
l Data Component. Allows you to include dynamic elements in the user interface for a report. These
dynamic elements can retrieve data from the database and alter input items based on criteria, including
formulas and switch statements. For example, if you select the checkbox Select individual devices, the
Devices by Organization field displays a list of devices. This behavior is defined with Data Components.
l Custom Report Components. Allows you to define a common combination of input elements and then use
that combination of input elements in multiple report input forms, without having to construct each
combination of input elements in each input form. For example, the Organization Selector (a default
Custom Report Component included with SL1) provides options to select either the All Organization
checkbox or to select from the list of Organizations.
Creating an Input Form
To create an input form:
1. On the Report Input Forms page (Reports > Management > Report Input Forms), click the [Create]
button. The ReportForm Editor page appears:
26

27
2. Complete the following fields:
l Form Name. Type a name for the input form.
l Form Type. Your choices are:
o
Report. Select this option if this input form is a complete user interface for a report. If you select this
option, the input form will appear in the Input Form drop-down list in the ReportTemplate
Editor page.
o
Component. Select this option if this input form is a set of components that you want to re-use on
multiple reports. If you select this option, the input form will appear in the Available
Components pane in the ReportForm Editor page.
l Version.Enter a version number for the input form. ScienceLogic recommends changing the version
number every time you edit a report form.
l Author. Enter the name of the person or company that developed the report form. This field is
automatically populated with the first and last name from your user account.
3. Click [Save]. You can now add components to the input form.
Adding and Configuring Input Form Components
An input form includes one or more components. You can include the following types of input components in an
input form:
Adding and Configuring Input Form Components
Adding and Configuring Input Form Components
l Static Layout Components . Provide containers for laying out the user interface, labels, and text boxes.
l Form Input Components. Provide typical HTTP input-form functionality and allows the user to specify
inputs when generating an instance of the report. You must define report gluecode to process the values
passed by Form Input Components.
l Data Components. Allow you to include dynamic elements in report interfaces. Data Components can
retrieve data from the database, alter input items based on various criteria, include formulas, switch
statements, and other flexible tools.
l Custom Report Components. Allow you to define a common combination of input elements and then use
that combination of input elements in multiple reports (without having to define the combination of input
elements each time you use it).
The following panes and buttons appear in the ReportForm Editor page:
l Form Structure. This pane displays a hierarchical list view of the components that have been added to the
input form. In this pane, you can edit, remove, and rearrange the components that have been added to the
input form.
l Form Preview. This pane displays the components that have been added to the input form as they will
display in the report's user interface. If you have configured components to interact with each other, e.g. a
checkbox that controls the enabled/disabled state of a multi-select, you can test the behavior of the
components by interacting with them in this pane. For an example of how to use the Form Preview pane,
see the Simple Tabular Report example.
l Available Components. This pane displays a list of all available component types.
The following buttons appear in the ReportForm Editor page:
l Data. By default, the ReportForm Editor page does not display data source components in the Form
Structure or the Available Components. Select the [Data] button to toggle the display of data source
components.
l
Wrench icon ( ). Select this icon to edit a component.
l
Bomb icon ( ). Select this icon to remove a component from the input form.
l Save. Select this button to save your changes to the input form.
l Save As. Select this button to save your changes to the input form as a new input form.
NOTE: The ReportForm Editor does not automatically save when you add, remove, or edit a component.
You must select the [Save] button in the ReportForm Editor to save your changes.
To add or edit a component to an input form:
1. To add a new component, either double click on the component name in the Available Components
pane or Click and drag the component from the Available Components pane to the Form Structure
pane.
28

29
2.
To edit an existing component, select the wrench icon ( ) for that component in the Form Structure pane.
The Edit Component modal page is displayed.
3. To remove a component from an input form, select the bomb icon ()for the component in the Form
Structure pane.
4. Enter a value in each field in the Edit Component modal page. The fields in this page are different for each
type of component. The following sections describe each type of input component:
l Static Layout Components
l Form Input Components
l Data Components
l Custom Report Components
5. Select the [Save] button in the Edit Component modal page.The Edit Component modal page closes.
6. Select the [Save] button in the ReportForm Editor page.
The components in an input form can be arranged hierarchically in the Form Structure pane. The order of the
components in the Form Structure pane determines the order the components will be displayed on the input
form. To move a component, click and drag the component in the Form Structure pane. When you start
dragging a component, a set of dashed lines indicate where the component will be placed if you release the
mouse button.
Some components can be arranged as children of other components. The following components can be
"parents":
l Some layout components, including the Vertical Box, Horizontal Box, and Field Set.
The child components will be arranged inside the parent in the input form. To add a child
component to a layout component, click and drag the child component to the Drag components
here section below the parent in the Form Structure pane.
l Form input components and data source components that can reference data source components.
Arranging data source components as children of other components does not affect the
configuration or function of either component; however, arranging data source components in a
logical hierarchy improves the legibility of the Form Structure pane. To make a data source
component a child of a form input component or data source component, click and drag the child
component to the Drag sources here section below the parent in the Form Structure pane.
Editing an Input Form
To edit an input form:
1. Go to the Report Input Forms page (Reports > Management > Report Input Forms).
Editing an Input Form

Deleting an Input Form
2.
Click the wrench icon ( )for the input form you want to edit. The ReportForm Editor page appears:
3. Make changes to the input form. For a description of the fields in the ReportForm Editor page, see the
Creating an Input Form section. For a description of how to add, remove, and edit components on an
input form, see the Configuring Input Form Components section.
4. To save your changes, click [Save]. To save your changes as a new input form, click [Save As].
Deleting an Input Form
To delete an input form, perform the following steps:
NOTE: You cannot delete an input form that is associated with a report template.
1. Go to the Report Input Forms page (Reports > Management > Report Input Forms).
2. Select the checkbox for each input form you want to delete.
3. In the Select Action drop-down list, select Delete Input Forms.
4. Select the [Go] button.
Static Layout Components
Static Layout Components provide containers for laying out the user interface, labels, and text boxes.
30
31
Text
Displays static text on the input form. Text has the following options:
l Text. The text to display on the input form.
l Font Style. The style to apply to the displayed text. The options are normal, bold, italic, or bold italic.
Paragraph
An invisible container of other elements. Child elements are displayed on one line of text, appearing from left to
right in the order they appear in the Form Structure hierarchy. Paragraph has the following options:
l Width. The width of Paragraph in pixels. If you do not supply a value in this field, SL1 will automatically
calculate the width of the Paragraph based on the size of the Paragraph child components.
l Height. The height of Paragraph in pixels. If you do not supply a value in this field, SL1 will automatically
calculate the height of the Paragraph component based on the size of the Paragraph child components.
Vertical Box
An invisible container of other elements. Child elements are arranged vertically in the order they appear in the
Form Structure hierarchy. Vertical Box has the following options:
l Width. The width of the Vertical Box in pixels. If you do not supply a value in this field, SL1 will
automatically calculate the width of the Vertical Box based on the size of the Vertical Box child
components.
l Height. The height of the Vertical Box in pixels. If you do not supply a value in this field, , SL1 will
automatically calculate the height of the Vertical Box based on the size of the Vertical Box child
components.
Horizontal Box
An invisible container of other elements. Child elements are arranged horizontally in the order they appear in the
Form Structure hierarchy. Horizontal Box has the following options:
l Width. The width of the Horizontal Box in pixels. If you do not supply a value in this field, SL1 will
automatically calculate the width of the Horizontal Box based on the size of the Horizontal Box child
components.
l Height. The height of the Horizontal Box in pixels. If you do not supply a value in this field, , SL1 will
automatically calculate the height of the Horizontal Box based on the size of the Horizontal Box child
components.
Static Layout Components

Form Input Components
Field Set
A container of other elements. The child elements are surrounded by a border with optional legend text displayed
at the top of the Field Set. By default, child elements are arranged vertically. To display child elements
horizontally, a Horizontal Box can be nested inside a Field Set. Field Set has the following options:
l Legend Text. The text to display at the top of the Field Set.
l Width. The width of the Field Set in pixels. If you do not supply a value in this field, SL1 will automatically
calculate the width of the Field Set based on the size of the Field Set child components.
l Height. The height of the Field Set in pixels. If you do not supply a value in this field, SL1 will automatically
calculate the height of the Field Set based on the size of the Field Set child components.
Form Input Components
Form Input Components provide typical HTTP input form functionality. All of the Form Input Components allow
the user to specify inputs when generating an instance of the report. The report gluecode should be written to
process the values passed by Form Input Components.
Checkbox
Allows the user to enable or disable an option. Checkbox passes a boolean value to the gluecode. If the
Checkbox is checked, the input value is "1" (one). If the Checkbox is unchecked, the input value is "0" (zero).
Checkbox has the following options:
l Input Name. The key in the $input array that points to the input value from the Checkbox.
l Label Text. The identifying text that will be displayed with the Checkbox on the Report Input Form and in
double quotes in the Form Structure pane.
l Width. The width of the Checkbox, including the Label Text, in pixels. If you do not supply a value in this
field, SL1 automatically calculates the width of the Checkbox based on the size of the Checkbox and Label
Text.
l Height. The height of the Checkbox, including the Label Text, in pixels. If you do not supply a value in this
field, SL1 automatically calculates the height of the Checkbox on the size of the Checkbox and Label Text.
l Default State. Defines whether the Checkbox will be checked or unchecked by default. Default State can
be bound to a static value or a data component, form input component, or custom report component. If the
value of the bind is "1" (one), the Checkbox will be checked by default. If the value of the bind is "0" (zero),
the Checkbox will be unchecked by default.
l Input Disabled. Defines when the Checkbox will be active or disabled on the Input Form. Input Disabled
can be bound to a static value or a data component, form input component, or custom report component.
If the value of the bind is "1" (one), the Checkbox will be disabled. If the value of the bind is "0" (zero), the
Checkbox will be active. If Input Disabled is bound to a form input or custom report component, the
Checkbox can dynamically change (between active and disabled) as the Input Form is filled out and the
value of the bind changes.
32
33
Dropdown Select
Allows the user to select an option from a list. The value associated with a selected option is passed to the
gluecode. Each option in a Dropdown Select has a label, which is displayed to the user, and a value, which is
passed to the gluecode. Dropdown Select has the following options:
l Input name. The key in the $input array that points to the input value from the Dropdown Select.
l Label text. The identifying text that will be displayed with the Dropdown Select on the Report Input Form,
and in double quotes in the Form Structure pane.
l Width. The width of the Dropdown Select, including the Label Text, in pixels. If you do not supply a value
in this field, SL1 automatically calculates the width of the Dropdown Select based on the size of the
Dropdown Select, Label Text, and Option Labels.
l Height. The height of the Dropdown Select, including the Label Text, in pixels. If you do not supply a
value in this field, SL1 automatically calculates the height of the Dropdown Selectbased on the size of the
Dropdown Select and Label Text.
l Option Values. Defines a list of values to associate with the Option Labels in the Dropdown Select. The
value for the selected option will be passed to the gluecode. Option Values can be bound to a static value
or a data component, form input component, or custom report component.
l Option Labels. Defines a list of labels that will be displayed to the user in the Dropdown Select.These
labels map to the list of values from the Option Values field. Option Labels can be bound to a static value
or a data component, form input component, or custom report component.
l Default Selected Value. Defines the option in the Dropdown Select that will be selected by default.
Default Selected Value can be bound to a static value or a data component, form input component, or
custom report component.
l Input Disabled. Defines whether the Dropdown Select will be active or disabled on the Input Form. Input
Disabled can be bound to a static value or a data component, form input component, or custom report
component. If the value of the bind is "1" (one), the Dropdown Select will be disabled. If the value of the
bind is "0" (zero) , the Dropdown Select will be active. If Input Disabled is bound to a form input
component or custom report component, the Dropdown Select can dynamically change (between active
and disabled) as the Input Form is filled out and the value of the bind changes.
Hidden
Passes a value to the gluecode. The value is defined by the Value option and cannot be changed by the user who
generates the report. Hidden has the following options:
l Input name. The key in the $input array that points to the Hidden value.
l Label text. The identifying text that will be displayed in double quotes in the Form Structure pane.
l Width. A deprecated field. Values entered into this field have no effect.
l Height. A deprecated field. Values entered into this field have no effect.
l Value. Defines the value that will be passed to the gluecode. Value can be bound to a static value or a data
component, form input component, or custom report component.
Form Input Components
Form Input Components
Multiple Checkboxes
Presents a list of labeled checkboxes to the user, and allows the user to select multiple checkboxes. The values
associated with the selected checkboxes are passed as an array to the gluecode. Each option in a Multiple
Checkboxes has a label, which is displayed to the user, and a value, which is passed to the gluecode. Multiple
Checkboxes has the following options:
l Input name. The key in the $input array that points to the input values from the Multiple Checkboxes.
l Label text. The identifying text that will be displayed with the Multiple Checkboxes on the Report Input
Form and in double quotes in the Form Structure pane.
l Width. The width of the Multiple Checkboxes, including the Label Text, in pixels. If you do not supply a
value in this field, SL1 automatically calculates the width of the Multiple Checkboxes based on the size of
the Multiple Checkboxes, Label Text, and Option Labels.
l Height. The height of the Multiple Checkboxes, including the Label Text, in pixels. If you do not supply a
value in this field, SL1 automatically calculates the height of the Multiple Checkboxes based on the size of
the Multiple Checkboxes and Label Text.
l Checkbox Values. Defines a list of values to associated with the Checkbox Labels in the Multiple
Checkboxes. These values map to the labels in the Checkbox Labels field.The values for the selected
checkboxes will be passed to the gluecode. Checkbox Values can be bound to a static value or a data
component, form input component, or custom report component.
l Checkbox Labels. Defines a list of labels that will be displayed to the user in Multiple Checkboxes. These
labels map to the values in the Checkbox Values field. Checkbox Labels can be bound to a static value or
a data component, form input component, or custom report component.
l Default Checked Values. Defines the checkboxes in the Multiple Checkboxes that will be selected by
default. Default Checked Values can be bound to a static value or a data component, form input
component, or custom report component.
l Input Disabled. Defines whether the Multiple Checkboxes will be active or disabled on the Input Form.
Input Disabled can be bound to a static value or a data component, form input component, or custom
report component. If the value of the bind is "1" (one), the Multiple Checkboxes will be disabled. If the
value of the bind is "0" (zero), the Multiple Checkboxes will be active. If Input Disabled is bound to a form
input or custom report component, the Multiple Checkboxes can dynamically change (between active and
disabled) as the Input Form is filled out and the value of the bind changes.
Multiple Select
Allows the user to select multiple options from a list. The values associated with the selected options are passed
as an array to the gluecode. Each option in a Multiple Select has a label, which is displayed to the user, and a
value, which is passed to the gluecode. Multiple Select has the following options:
l Input name. The key in the $input array that points to the input values from the Multiple Select.
l Label text. The identifying text that will be displayed with the Multiple Select on the Report Input Form, and
in double quotes in the Form Structure pane.
34
35
l Width. The width of the Multiple Select, including the Label Text, in pixels. If you do not supply a value in
this field, SL1 automatically calculates the width of the Multiple Select based on the size of the Multiple
Select, Label Text, and Option Labels.
l Height. The height of the Multiple Select, including the Label Text, in pixels. If you do not supply a value in
this field, SL1 automatically calculates the height of the Multiple Select based on the size of the Multiple
Select and Label Text.
l Option Values. Defines a list of values associated with the options in the Multiple Select. These values
map to the labels in the Option Labels field. The values for the selected options will be passed to the
gluecode. Option Values can be bound to a static value or a data component, form input component, or
custom report component.
l Option Labels. Defines a list of labels that will be displayed to the user in the Multiple Select. These labels
map the values in the Option Values field. Option Labels can be bound to a static value or a data
component, form input component, or custom report component.
l Default Selected Values. Defines the options in the Multiple Select that will be selected by default.
Default Selected Values can be bound to a static value or a data component, form input component, or
custom report component.
l Input Disabled. Defines whether the Multiple Select will be active or disabled on the Input Form. Input
Disabled can be bound to a static value or a data component, form input component, or custom report
component. If the value of the bind is "1" (one), the Multiple Select will be disabled. If the value of the bind
is "0" (zero), the Multiple Select will be active. If Input Disabled is bound to a form input component or
custom report component, the Multiple Select can dynamically change (between active and disabled) as
the Input Form is filled out and the value of the bind changes.
Multiple Select with Category
Presents the user with a list of options divided into categories. The user can select multiple items from the list, and
can select whole categories of items by selecting the category name. The values associated with the selected
options are passed in an array to the gluecode. Each option in a Multiple Select with Category has a label,
which is displayed to the user, and a value, which is passed to the gluecode. Multiple Select with Category has
the following options:
l Input name. The key in the $input array that points to the input values from the Multiple Select with
Category.
l Label text. The identifying text that will be displayed with the Multiple Select with Category on the Report
Input Form and in double quotes in the Form Structure pane.
l Width. The width of the Multiple Select with Category, including the Label Text, in pixels. If you do not
supply a value in this field, SL1 automatically calculates the width of the Multiple Select with Category
based on the size of the Multiple Select with Category, Label Text, and Option Labels.
l Height. The height of the Multiple Select with Category, including the Label Text, in pixels. If you do not
supply a value in this field, SL1 automatically calculates the height of the Multiple Select with Category
based on the size of the Multiple Select with Category and Label Text.
Form Input Components
Form Input Components
l Option Values. Defines a list of values to include in the Multiple Select with Category. These values map
to the labels in the Option Labels field. The values for the selected options will be passed to the gluecode.
Option Values can be bound to a static value or a data component, form input component, or custom
report component.
l Option Labels. Defines a list of labels that will be displayed to the user in the Multiple Select with
Category. These labels map to the values in the Option Values field. Option Labels can be bound to a
static value or a data component, form input component, or custom report component.
l Option Categories. Defines a list of categories for the Option Labels. Option Categories can be bound
to a static value or a data component, form input component, or custom report component.
l Default Selected Values. Defines the options in the Multiple Select with Category that will be selected by
default. Default Selected Values can be bound to a static value or a data component, form input
component, or custom report component.
l Input Disabled. Defines whether the Multiple Select with Category will be active or disabled on the Input
Form. Input Disabled can be bound to a static value or a data component, form input component, or
custom report component. If the value of the bind is "1" (one), the Multiple Select with Category will be
disabled. If the value of the bind is "0" (zero), the Multiple Select with Category will be active. If Input
Disabled is bound to a form input component or custom report component, the Multiple Select with
Category can dynamically change (between active and disabled) as the Input Form is filled out and the
value of the bind changes.
Radio Buttons
Presents a list of labeled buttons to the user, and allows the user to select only one. The value associated with the
selected option is passed to the gluecode. Each option in a Radio Buttons has a label, which is displayed to the
user, and a value, which is passed to the gluecode. Radio Buttons has the following options:
l Input name. The key in the $input array that points to the input value from the Radio Buttons.
l Label text. The identifying text that will be displayed with the Radio Buttons on the Report Input Form, and
in double quotes in the Form Structure pane.
l Width. The width of the Radio Buttons, including the Label Text, in pixels. If you do not supply a value in
this field, SL1 automatically calculates the width of the Radio Buttons based on the size of the Radio
Buttons, Label Text, and Radio Button Labels.
l Height. The height of the Radio Buttons, including the Label Text, in pixels. If you do not supply a value in
this field, SL1 automatically calculates the height of the Radio Buttons based on the size of the Radio
Buttons and Label Text.
l Radio Button Values. Defines a list of values associated the buttons in the group of Radio Buttons. The
values map to the labels in the Radio Button Labels field. The value for the selected option will be passed
to the gluecode. Radio Button Values can be bound to a static value or a data component, form input
component, or custom report component.
l Radio Button Labels. Defines a list of labels that will be displayed to the user in the group of Radio
Buttons. These labels map to the values in the Radio Button Values field. Radio Button Labels can be
bound to a static value or a data component, form input component, or custom report component.
36
37
l Default Checked Value. Defines the button that will be checked by default. Default Checked Value can
be bound to a static value or a data component, form input component, or custom report component.
l Input Disabled. Defines whether the Radio Buttons will be active or disabled on the Input Form. Input
Disabled can be bound to a static value or a data component, form input component, or custom report
component. If the value of the bind is "1" (one), the Radio Buttons will be disabled. If the value of the bind is
"0" (zero), the Radio Buttons will be active. If Input Disabled is bound to a form input component or
custom report component, the Radio Buttons can dynamically change (between active and disabled) as the
Input Form is filled out and the value of the bind changes.
Text Area
Allows the user to input text into a multiple-line field. Text Area passes the entered text as an input to the
gluecode.
l Input Name. The key in the $input array that points to the input value from the Text Area.
l Label text. The identifying text that will be displayed with the Text Area on the Report Input Form and in
double quotes in the Form Structure pane.
l Width. The width of the Text Area, including the Label Text, in pixels. If you do not supply a value in this
field, SL1 automatically calculates the width of the Text Area.
l Height. The height of the Text Area, including the Label Text, in pixels. If you do not supply a value in this
field, SL1 automatically calculates the height of the Text Area.
l Default Value. The default text that populates the Text Area when the Input Form is loaded.
l Input Validation. Defines whether the text entered in the Text Area is valid. Input Validation can be bound
to a static value or a data component, form input component, or custom report component. If the value of
the bind is "1" (one), the text entered in the Text Area will be used as the input value. If the value of the bind
is "0" (zero), the Default Value will be used as the input value. If the value of the bind becomes "0" (zero)
while a user is filling out the Report Input Form, SL1 displays a pop-up window that tells the user that they
have entered an invalid value. A Formula data component is commonly used as the bind for Input
Validation. For example, the Formula might perform a regular expression match against the value entered
in the Text Area to limit the user to a certain format, such as a string of numbers.
l Input Disabled. Defines whether the Text Area will be active or disabled on the Input Form. Input
Disabled can be bound to a static value or a data component, form input component, or custom report
component. If the value of the bind is "1" (one), the Text Area will be disabled. If the value of the bind is "0"
(zero), the Text Area will be active. If Input Disabled is bound to a form input component or custom report
component, the Text Area can dynamically change (between active and disabled) as the Input Form is filled
out and the value of the bind changes.
Text Field
Allows the user to input text in a one-line field. Text Field passes the entered text as an input to the gluecode.
l Input name. The key in the $input array that points to the input value from the Text Field.
l Label text. The identifying text that will be displayed with the Text Field on the Report Input Form and in
double quotes in the Form Structure pane.
Form Input Components

Data Components
l Width. The width of the Text Field, including the Label Text, in pixels. If you do not supply a value in this
field, SL1 automatically calculates the width of the Text Field.
l Height. The height of the Text Field, including the Label Text, in pixels. If you do not supply a value in this
field, SL1 automatically calculates the height of the Text Field.
l Default Value. The default text that populates the Text Field when the Input Form is loaded.
l Input Validation. Defines whether the text entered in the Text Field is valid. Input Validation can be
bound to a static value or a data component, form input component, or custom report component. If the
value of the bind is "1" (one), the text entered in the Text Field will be used as the input value. If the value of
the bind is "0" (zero), the Default Value will be used as the input value. If the value of the bind becomes "0"
(zero) while a user is filling out the Report Input Form, SL1 displays a pop-up window that tells the user that
they have entered an invalid value. A Formula data component is commonly used as the bind for Input
Validation. For example, the Formula might perform a regular expression match against the value entered
in the Text Field to limit the user to a certain format, such as a string of numbers.
l Input Disabled. Defines whether the Text Field will be active or disabled on the Input Form. Input
Disabled can be bound to a static value or a data component, form input component, or custom report
component. If the value of the bind is "1" (one), the Text Field will be disabled. If the value of the bind is "0"
(zero), the Text Field will be active. If Input Disabled is bound to a form input component or custom report
component, the Text Field can dynamically change (between active and disabled) as the Input Form is filled
out and the value of the bind changes.
Data Components
Data Components allow you to include dynamic elements in report interfaces. Data Components can retrieve
data from the database, alter other input items based on various selections, and can include formulas, switch
statements, and other flexible tools. These components are hidden on the Report Form Editor page until the
[Data] button is selected.
Concatenate
Allows multiple data sources to be concatenated into a single data source.
l Source name. The name of the data source. This name is displayed in the Form Structure pane and
binding drop down menus.
l Input Sources. The data sources that will be concatenated into the Concatenate source. Each Input
Source is a drop down list that allows you to select the bind source. Input Sources can be bound to a static
value, or to a value from a data component, form input component, or custom report component.
Correlate Lists
A combination of the Find In List and Select From List components. Correlate Lists compares two reference
lists using the same logic as the Find In List component, creating a list of indices that represents items that
appear in both lists. Correlate Lists then uses the list of indices to retrieve values from a third correlated list.
Correlate Lists outputs a list of values from the third correlated list that are located at the indices returned by the
comparison of the two reference lists.
38
39
For example, suppose you have a Reference List containing the list "open, working, pending, resolved", and a
Reference List Members containing the list "working, pending". The list of indices used to return values from the
Correlated List would be "1, 2". If the Correlated List contained the values "support, development, qa,
customer", the output of the Correlate Lists component would be "development, qa".
l Source name. The name of the data source. This name is displayed in the Form Structure pane and
binding drop down menus.
l Reference List. The initial list of values to be filtered. Reference List can be bound to a static value, or to a
value from a data component, form input component, or custom report component.
l Reference List Members. The list of members to retrieve indices for from the Reference List. The list of
indices is then used to return a list of values from the Correlated List. Reference List Members can be
bound to a static value, or to a value from a data component, form input component, or custom report
component.
l Correlated List. The list of values to correlate the list of indices against. The Correlate Lists component
returns the values in the Correlated List located at the indices in the list of indices. Correlated List can be
bound to a static value, or to a value from a data component, form input component, or custom report
component.
Filter List
Filters a list of values based on a comparison with a list of filters. The list of filters contains a list of "0"(zeros) and
"1" (ones), that allows you to turn on and off entries in the list of values. Filter List returns only the values that have
the same list position as a non-zero value in the list of filters.
For example, suppose you have a list of five values, "one, two, three, four, and five" and you want to display only
values "two" and "four." You could create a filter list that contains the following: "0, 1, 0, 1, 0". Only those values
in the value list that match a value of "1" (ones) in the filter list will be displayed.
l Source name. The name of the data source. This name is displayed in the Form Structure pane and
binding drop down menus.
l Value List. The list of values to be filtered. Value List can be bound to a static value, or to a value from a
data component, form input component, or custom report component.
l Filter List The list of "0" (zeros) and "1" (ones) that turn on and off the values in the value list. The number of
entries in the Filter List must be equal to the number of entries in the Value List. Filter List can be bound to
a static value, or to a value from a data component, form input component, or custom report component.
Find In List
Filters a list of values based on a comparison with a list of members. Find In List returns a list of indices from the
list of values for the values that also appear in the list of members. The indices for the list of values start at zero.
For example, suppose you have a list of four values, "open, working, pending, resolved", which has the indices "0,
1, 2, 3". If the list of members contained the values "open, resolved", Find In List would return the list of indices
"0, 3".
Data Components
Data Components
l Source name. The name of the data source. This name is displayed in the Form Structure pane and
binding drop down menus.
l Value List. The list of values to be filtered. Value List can be bound to a static value, or to a value from a
data component, form input component, or custom report component.
l List Members. The list of members to return indexes for. List Members can be bound to a static value, or to
a value from a data component, form input component, or custom report component.
Formula
Returns the result of a calculated formula.
l Source name. The name of the data source. This name is displayed in the Form Structure pane and
binding drop down menus.
l Formula expression. The expression that will be use to calculate the value(s) returned by the Formula. The
following values, operators and functions can be used in a Formula expression:
Scalar Values
o
Integer or floating point numbers.
o
Single quoted strings.
o
References to Iterating Variables. See Iterating Variables.
o
References to Scalar Constants. See Scalar Constants.
List Values
o
References to List Constants. see List Constants.
o
Literal lists. Must be entered in the format "[1,2,3,...]", where 1, 2, 3, etc. are the list values.
Operators
o
( ) (order of operation parentheses)
o
! (logical not)
o
~ (bitwise not)
o
- (arithmetic negative)
o
+ (arithmetic add)
o
- (arithmetic subtract)
o
* (arithmetic multiply)
o
/ (arithmetic divide)
o
% (arithmetic modulo)
o
& (bitwise and)
o
| (bitwise or)
40
41
o
^ (bitwise exclusive or)
o
== (boolean equality comparison)
o
!= (boolean not equals comparison)
o
>= (boolean greater than or equal to comparison)
o
<= (boolean less than or equal to comparison)
o
> (boolean greater than comparison)
o
< (boolean less than comparison)
o
&& (boolean and)
o
|| (boolean or)
o
<condition> ? <true value> : <false value> (ternary if-then)
Functions
o
<scalar> in <list>. Returns 1 if the value of <scalar> appears in <list>, otherwise returns 0.
o
<string 1> contains <string 2>. Returns 1 if <string 2> is a substring of <string 1>, otherwise
returns 0.
o
<string> matches <regex>. Returns 1 if <string> matches the regular expression <regex>,
otherwise returns 0. <regex> must be a perl-compatible regular expression.
l Iterating Variables. Bound values that are substituted as scalar values into the Formula expression. If the
Iterating Variables are lists, the Formula expression will be evaluated once for each list position in the
Iterating Variables, and the return value of Formula will be a list of all the results from the Formula
expression. If the Iterating Variables are lists, each Iterating Variables list must be of the same length.
Each Iterating Variables includes a name field, where you can define a name for the variable; this name is
referenced by the Formula expression. Iterating Variables can be bound to static values, or to values
from a data component, form input component, or custom report component. Each time you define an
Iterating Variable, additional fields appear that allow you to optionally add another Iterating Variable.
l Scalar Constants. Bound values that are substituted as a scalar value into the Formula expression. Each
Scalar Constant includes a name field, where you can define a name for the constant; this name is
referenced by the Formula expression. Scalar Constants can be bound to static values, or to values from
a data component, form input component, or custom report component. Each time you define a Scalar
Constant, additional fields appear that allow you to optionally add another Scalar Constant.
l List Constants. Bound values that are substituted as a list value into the Formula expression. Each List
Constant includes a name field, where you can define a name for the constant; this name is referenced by
the Formula expression. List Constants can be bound to static values, or to values from a data
component, form input component, or custom report component. Each time you define a List Constant,
additional fields appear that allow you to optionally add another List Constant.
Data Components
Data Components
Predefined List
Provides a static list of data. The values in the static list are predefined by the report developer and do not change
dynamically.
l Source name. The name of the data source. This name is displayed in the Form Structure pane and
binding drop down menus.
l List values. Defines the values for the predefined list. Each value in the list should be entered into a separate
text field. Each time you define a List value, additional fields appear that allow you to optionally add
another List value.
Select From List
Filters a list of values based on a comparison with a list of indices. Select From List returns a new list of values
from the original list of values. The new list includes values from the original list that are located at indices
specified in the list of indices. The indices for the list of values start at zero.
For example, suppose you have a list of four values "open, working, pending, resolved", which have the indices
"0,1,2,3". If the list of indices contained the values "0, 3", Select From List would return the list of values "open,
resolved".
l Source name. The name of the data source. This name is displayed in the Form Structure pane and
binding drop down menus.
l Value List. The list of values to be filtered. Value List can be bound to a static value, or to a value from a
data component, form input component, or custom report component.
l List Indices. The list of indexes to return values for. List Indices can be bound to a static value, or to a value
from a data component, form input component, or custom report component.
Server Function
Provides data based on the results of a selected function.
l Source name. The name of the data source. This name is displayed in the Form Structure pane and
binding drop down menus.
l Function. The function to execute to generate the report data. The following functions are available:
o
date(format, timestamp). Identical to the PHP date function, which returns a formatted date string.
o
mktime(hour, minute, second, month, day, year). Identical to the PHP mktime function, which
returns a UNIX timestamp.
o
range(min, max, step). Identical to the PHP range function, which returns an array of elements from
min to max.
o
gmdate(format, timestamp). Identical to the PHP date function, which returns a formatted date
string in GMT.
42

43
o
gmmktime(hour, minute, second, month, day, year). Identical to the PHP mktime function, which
returns a UNIXtimestamp in GMT.
o
report_user_account_type(). Returns the account type of the user who is currently generating the
report. report_user_account_type() returns "0" (zero) if the user is an administrator, and returns "1"
(one) if the user is a user (not an administrator).
o
report_user_organizations(). Returns a list of organization IDs for all organizations associated with
the user who is currently generating the report.
NOTE: For details on the referenced PHPfunctions, see
http://us.php.net/manual/en/funcref.php
l Function Arguments. Defines that values that will be used as parameters for the selected function. The
number of arguments you define should match the number of arguments allowed by the selected Function.
Function Arguments can be bound to static values, or to values from a data component, form input
component, or custom report component.
SQL Query
Provides data based on the results of an SQL query executed on the main ScienceLogic database.
l Source name. The name of the data source. This name is displayed in the Form Structure pane and
binding drop down menus.
l SQL Query. The SQL query to execute.
l Scalar Binds. Allows multiple, single, bind values to be substituted into the SQL query. Each Scalar Bind
includes:
o
A name field, in which you define a name for the bind. You will then use this name to reference the
bind in the SQL statement.
o
A drop down list from which you can select the bind source. Scalar Binds can be bound to a static
value, or to a value from a data component, form input component, or custom report component.
o
Each time you define a Scalar Bind, additional form fields appear that allow you to optionally add
another Scalar Bind.
l List Binds. Allows multiple lists of bind values to be substituted into the SQL query. Each List Bind includes
the following:
o
A name field, in which you define a name for the bind. You will then use this name to reference the
bind in the SQL statement.
o
A drop down list from which you can select the bind source. List Binds can be bound to a static value,
or to a value from a data component, form input component, or custom report component.
o
Each time you define a List Bind, additional form fields appear that allow you to optionally add
another List Bind.
Data Components

Custom Report Components
String Format
Provides a list of data strings that have been formatted using the PHP sprintf function.
l Source name. The name of the data source. This name is displayed in the Form Structure pane and
binding drop down menus.
l Format string. The first argument passed to the sprintf function. Format string is a string of ordinary
characters that include conversion specifications (denoted by %) for each of the Format Arguments. The
conversion specifications in the Format string must match the data type of the values in the Format
Argument. For more information on the sprintf function and a list of conversion specifications, see the PHP
manual at php.net/sprintf.
l Format Arguments. The second and subsequent arguments passed to the sprintf function. Format
Arguments can be bound to static values, or to values from a data component, form input component, or
custom report components. If the bind values for Format Arguments are lists, each Format Arguments
must be a list of the same size as its bind value.
Switch Source
Allows you to include switch-statement functionality in your report, to dynamically select between multiple data
sources.
l Source name. The name of the data source. This name is displayed in the Form Structure pane and
binding drop down menus.
l Switch Value. A bind value that determines which of the Switched Inputs to use as the data source. Switch
Value can be bound to a static value, or to values from a data component, form input component, or
custom report components. The possible bind values must match the names given to the Switched Inputs.
l Switched Inputs. The possible data sources that can be selected by the Switch Source. Each Switched
Input includes:
o
A value field in which you specify the value that must occur in the Switch Value field before SL1 will
select the current Switched Input to use.
o
A drop down list from which you can select the bind source for the Switched Inputs. Switched
Inputs can be bound to a static value, or to a value from a data component, form input component,
or custom report component.
o
Each time you define a Switched Input, additional form fields appear that allow you to optionally
add another Switched Input.
Custom Report Components
The Custom Report Components section in the Report Form Editor page contains a list of Report Input Forms
that have a Form Type of Component.
44

45
Generally, a Report Input Form defines the user interface for a report. Report Input Forms of type Component
cannot be associated with a report. Instead, a Report Input Form of type Component allows you to define a
common combination of input elements. You can then use that combination of input elements in multiple Report
Input Forms, without having to construct that combination of input elements in each report.
Several Custom Report Components are installed by default. All default Custom Report Components include the
following options:
l Input name. The key in the $input array that points to the input data for the Custom Report Component.
l Width. Width of the Custom Report Component in pixels. If you do not supply a value in this field, SL1
automatically calculates the width of the Custom Report Component based on the size of the Custom Report
Component child components.
l Height. Height of the Custom Report Component in pixels. If you do not supply a value in this field, SL1
automatically calculates the height of the Custom Report Component based on the size of the Custom
Report Component child components.
When a Report Input Form includes a Custom Report Component, the $input array for the Report Input Form will
reference the Input name of the Custom Report Component as a key. The Input name of the Custom Report
Component will point to an array. That array will contain an item for each child input element. Each item in the
array will use the Input name of the child input element as its key. To view the configuration of the child elements
in a custom report component, select the wrench icon ( )for the custom report component in the Report Input
Forms page (Reports > Management >Report Input Forms).
Custom Report Components

Chapter
4
Developing Gluecode
Overview
This chapter describes how to develop gluecode when creating custom reports in SL1.
Use the following menu options to navigate the SL1 user interface:
l
To view a pop-out list of menu options, click the menu icon( ).
l
To view a page containing all the menu options, click the Advanced menu icon ( ).
This chapter includes the following topics:
What is Gluecode? 47
Processing Input Form Options 47
Available Resources 48
Output 48
Output Templates and Output Directives 48
Using the $output Array 49
Using the $em7_report object 53
46

47
What is Gluecode?
Gluecode is PHP code that is executed by the report engine when the report is generated. The gluecode must:
l Process the inputs from the Input Form.
l Make queries to the database or use other methods to gather the required data.
l Format the data so it can be populated into the Output Template.
You can add and edit gluecode on the Report Management page (Reports > Management > Report
Manager).
Processing Input Form Options
The values selected by the end user in the input form for a report are passed to the gluecode for that report in the
$input array. The keys in the $input array are the values from the Input name field for all form input components
and custom report components on the input form.
For a form input component, the value at the corresponding array key is:
l Checkbox. Either 0 (unchecked)or 1 (checked).
l Dropdown Select. The value from the Option Values array for the selected label.
l Hidden. The static value supplied in the configuration or the value from the input component selected in the
configuration.
l Multiple Checkboxes. A non-associative array of values. The array values are the values from the
Checkbox Values array for the checkboxes that were selected by the user. The array does not include
information about checkboxes that were not selected by the user.
l Multiple Select. A non-associative array of values. The array values are the values from the Option Values
array for the labels that were selected by the user. The array does not include information about labels that
were not selected by the user.
l Multiple Select with Category. A non-associative array of values. The array values are the values from the
Option Values array for the labels that were selected by the user. The array does not include information
about labels that were not selected by the user.
l Radio Buttons. The value from the Radio Button Values array for radio button select by the user.
l Text Area. The string entered by the end-user in the text area.
l Text Field. The string entered by the end-user in the text field.
For custom report components, the Input name of the custom report component will point to an array. That
array will contain an item for each child input element. Each item in the array will use the Input name of the child
input element as its key.
What is Gluecode?

Available Resources
Available Resources
The following resources can be used by gluecode:
l The $db object, which provides methods for querying the primary database in SL1. For more information,
see the Database Methods section.
l The data engine class, which provides methods for fetching performance data collected by SL1. For more
information, see the Data Engine section.
l The debugging functions described in the Debugging Reports section.
Output
There are two different methods by which gluecode can output values to the output template. The structure of the
output template is the same for both methods. Every report must use only one of the two methods:
l The $output array. This option passes the entire data set to the output template when the gluecode has
finished executing. This method is easier to use. However, the PHP memory limit for the execution of a single
report is 3 MB, which typically translates to a row-limit of 10,000.Large reports will generate a memory
error and fail to execute when using the $output array.
l The $em7_report object. When using this option, output is passed incrementally using a set of methods
associated with the $em7_report object. This method typically requires more lines of code in the gluecode.
However, this option does not require the entire data set to reside in memory.
Output Templates and Output Directives
An Output Template is an Open Office Spreadsheet file (.ods file) that defines the format of the generated
report. An Output Template defines the formatting and table structure you want to use for the generated report.
An output template includes one or more output directives. An output template directive indicates how output
provided by report gluecode should be laid out. There are four general types of output directives:
l Array Binding Directives. These output template directives define a section of the output template (a cell, a
row, a table, or an entire sheet) that will be repeated for each item in an array outputted by the gluecode.
For example, suppose a report outputs a list of tickets, with one ticket on each row. The gluecode for the
report outputs an array of tickets. The output template would include the bindrow output template directive,
specifying the name of that array, to indicate the row that should be repeated for each ticket in the output.
l Conditional Directives. These output template directives include or exclude sections of the output template
(e.g. columns, rows, tables, etc) based on the output from the gluecode. For example, suppose a report has
an option that can be used to include or exclude certain columns. The glucode for the report would output a
boolean value for each optional column, indicating whether the column should be included. The output
template would include the ifcol output template directive in each column to indicate that the inclusion of
that column is controlled by the boolean value.
48
49
l Style Directives. These output template directives can be used to dynamically apply styles to cells in the
output. For example, suppose a report outputs a color-coded list of tickets, with the colors applied based on
the severity of the ticket. The gluecode for the report would include the color that is associated with each
ticket in the output. The output template would include the applystyle output template directive in the
appropriate cell(s) to select the style that matches that color.
l Image and Chart Directives. These output template directives can be used to place images and charts in
the output.
Using the $output Array
To use the $output array to pass data to the output template, you must assign an array of values, typically multi-
dimensional, to $output before the gluecode finishes executing. When SL1 processes the output template, the
output directives are used to traverse the keys in the $output array and place corresponding values on the output
template.
The values in the first dimension of the $output array are:
l Single values used to output static elements on a report. For example, $output might include 'date' as an
array key, the value of which is the date the report was generated. The output template would include a
directive to place the date in a static location in the output.
l Single values used to control behavior. For example, $output might include 'opt_cols' as an array key, the
value of which is a boolean that controls whether the user wants optional columns in the report. The output
template would include a directive to include or exclude certain columns based on the boolean value.
l One or more arrays that contain information for a repeated element in the report. Repeated elements
include sheets, tables, rows, and cells. The number of times the element is repeated is equal to the number
of elements in an array. For example, $output might include 'rows' as an array key, which is used to repeat a
row multiple times. A row is inserted for each key in the $output['rows'] array. The value assigned to each key
in the $output['rows'] array determines that values that are placed on that row. The key for a row in the
$output['rows'] array can also be placed on the row, but this is not required (i.e. it can be any arbitrary
value). Typically, the value assigned to each key in the $output['rows'] array is an array of values, one for
each column.
If an array is included as a value in the $output array, that second-dimension array can include arrays as values,
etc. Additional dimensions can be used to nest repeated elements within other repeated elements, for example:
l The $output array includes the key 'sheets', which is used to repeat a sheet in the output multiple times. An
array of values is assigned to $output['sheets'], which includes one key for each sheet that will be added to
the output. This example uses an arbitrary key for each sheet; human-readable key values could be used
and optionally included in the output, e.g. to label each sheet. The $output array now looks like this:
[sheets] => Array
(
[0]
[1]
.
.
)
Output
Output
l Each value in the $output['sheets'] is an array that includes the key 'tables'. This key is used to repeat a table
within each sheet. An array of values is assigned to the 'tables' key, which includes one key for each table
that will be added to that sheet. This example uses an arbitrary key for each table; human-readable key
values could be used and optionally included in the output, e.g. to label each table. The $output array now
looks like this:
[sheets] => Array
(
[0] => Array
{
[tables] => Array
{
[0]
[1]
.
.
}
}
[1] => Array
{
[tables] => Array
{
[0]
[1]
.
.
}
}
.
.
)
l Each value in each array of tables is an array that includes the key 'rows'. This key is used to repeat a row
within each table within each sheet. An array of values is assigned to the 'rows' key, which includes one key
for each row that will be added to that table within that sheet. This example uses an arbitrary key for each
row; human-readable key values could be used and optionally included in the output, e.g. as the first value
in each row. The $output array now looks like this:
[sheets] => Array
(
[0] => Array
{
[tables] => Array
{
[0] => Array
{
[rows] => Array
{
[0] =>
[1]
.
.
}
}
[1] => Array
{
[rows] => Array
{
[0]
50
51
[1]
.
.
}
}
.
.
}
}
[1] => Array
{
[tables] => Array
{
[0] => Array
{
[rows] => Array
{
[0]
[1]
.
.
}
}
[1] => Array
{
[rows] => Array
{
[0]
[1]
.
.
}
}
.
.
}
}
.
.
}
l Each value in each array of rows is assigned an array of column values. The keys in this array are used in the
output template to indicate where to place the values in the array within each row. For example, suppose
the tables have the columns "id", "device", and "availability". The $output array now looks like this:
[sheets] => Array
(
[0] => Array
{
[tables] => Array
{
[0] => Array
{
[rows] => Array
{
[0] => Array
{
[id] => <id value>
[device] => <device value>
[availability] => <availability value>
Output
Output
}
[1] => Array
{
[id] => <id value>
[device] => <device value>
[availability] => <availability value>
}
.
.
}
}
[1] => Array
{
[rows] => Array
{
[0] => Array
{
[id] => <id value>
[device] => <device value>
[availability] => <availability value>
}
[1] => Array
{
[id] => <id value>
[device] => <device value>
[availability] => <availability value>
}
.
.
}
}
.
.
}
}
[1] => Array
{
[tables] => Array
{
[0] => Array
{
[rows] => Array
{
[0] => Array
{
[id] => <id value>
[device] => <device value>
[availability] => <availability value>
}
[1] => Array
{
[id] => <id value>
[device] => <device value>
[availability] => <availability value>
}
.
.
}
}
[1] => Array
52
53
{
[rows] => Array
{
[0] => Array
{
[id] => <id value>
[device] => <device value>
[availability] => <availability value>
}
[1] => Array
{
[id] => <id value>
[device] => <device value>
[availability] => <availability value>
}
.
.
}
}
.
.
}
}
.
.
}
l In this example, there are multiple arrays that include only one key (sheets, tables, rows). These arrays can
include additional values, which can be any of the three types of values described for the first dimension in
the $output array. For example, the array for each sheet, which in this example includes only the key 'sheet',
could also include the key 'name', the values of which can be used to label each sheet.
Using the $em7_report object
The $em7_report object is instantiated automatically for all gluecode. To use the $em7_report object to pass
output to the output template, use the following methods:
l set_token_value(string token, string value). This method outputs single values for static elements or to
control behavior on a report. The token parameter must match the parameter supplied in the output
directive that places this value in the output template. The value parameter is the value you want to supply to
the output directive.
l get_token(string token). This method returns a token object that references either a [bindrow:token] or
[bindtable:token] output directive. The token parameter must match the parameter supplied in the output
directive. The token object returned by this method can then be used to populate data in the tables or rows.
Token objects have the following methods:
l new_table(string token). Use this method only on tokens that reference a [bindtable:token] output
directive. This method returns a token object that references an instance of a table inside a
[bindtable:token] output directive. The token parameter must be unique to this table and can be used in
the output in the {##} output directive. The token object returned by this method can then be used to
populate data in the tables or rows.
Output
Output
l get_token(string token). Use this method only on tokens that reference an instance of a table inside a
[bindtable:token] output directive, i.e. a token returned by the new_table(string token) method. This
method returns a token object that references a [bindrow:token] output directive inside the instance of a
table. The token object returned by this method can then be used to create new rows.
l new_row(string token). Use this method only on tokens that reference a [bindrow:token] output directive,
i.e.a token returned by the get_token(string token) method. This method returns a token object that
references an instance of a row inside a [bindrow:token] output directive. The token parameter must be
unique to this row and can be used in the output in the {##} output directive. The token object returned by
this method can then be used to populate data in the rows.
l set_value(array values). Use this method only on tokens that reference an instance of a row inside a
[bindrow:token] output directive, i.e. a token returned by the new_row(string token) method. This
method populates the row with data. The array keys in the values parameter must match the output
directives that add values to each column.
l set_token_value(string token, string value). This method can be used:
o
On tokens that reference an instance of a row inside a [bindrow:token] output directive, i.e. a token
returned by the new_row(string token) method. The data associated with a row is an array with one
entry for each column. This method populates a single entry in the data array. The token parameter is
the array key and must match an output directive on one of the columns in the row. The value
parameter is the value to add to that column.
o
On tokens that reference an instance of a table inside a [bindtable:token] output directive, i.e. a
token returned by the new_table(string token) method. This method can be used to supply data for
the table in addition to the row data, i.e. values for output directives that appear inside the
[bindtable:token] directive but outside the [bindrow:token] directive. For example, you could
supply a title for each table using this method. The token parameter must match an output directive
parameter. The value parameter is the value to supply for that directive.
l close_row(). Use this method only on tokens that reference an instance of a row inside a [bindrowtoken]
output directive, i.e. a token returned by the new_row(string token) method. This method saves the row.
You must use this method on every row created in the gluecode; a row is not passed to the output template
and removed from memory until it is closed. You cannot edit a closed row.
l close_table(). Use this method only on tokens that reference an instance of a table inside a
[bindrowtoken] output directive, i.e. a token returned by the new_table(string token) method. This
method saves the table. You must use this method on every table created in the gluecode; a table is not
passed to the output template and removed from memory until it is closed. You cannot edit a closed table.
For example, suppose your output template is configured with output directives that specify repeated rows inside
repeated tables. Suppose that:
l tables are added to the output template using the output directive [bindtable:organizations].
l rows are added to the output template using the output directive [bindrow:devices].
To start populating data in the output template, you would first get a token object that references the
[bindtable:organizations] directive:
$organization_tables = $em7_report->get_token('organizations');
54
55
The gluecode would then include a loop. Suppose that on each iteration of the loop, the key for each table is
stored in the variable $org. On each iteration of the loop, a new table is added to the output using the token that
was returned by the previous method:
$org_table = $organization_tables->new_table($org);
The token for each table is then used to get a token that references the [bindrow:devices] directive within that
table:
$devices = $org_table->get_token('devices');
The gluecode would include a second loop within the current loop. Suppose that on each iteration of the second
loop, the key for each row is stored in he $did variable and an array of column values for that row is stored in the
$device variable. On each iteration of the second loop, the $devices token, which references the
[bindrow:devices] directive, is used to add a row:
$device_row = $devices->new_row($did);
$device_row->set_value($device);
$device_row->close_row();
After the second loop completes, the current table is closed:
$org_table->close_table();
Output

Chapter
5
Database Methods
Overview
SL1 includes a class for executing SQL queries against SL1's database instance. SL1 automatically instantiates
$db as an instance of this class for use in gluecode. This chapter describes the methods that are available for this
object. For all the examples in this chapter, the following table named cities is used:
state city area_code
VA Reston 703
VA Richmond 804
DC Washington 202
MD Baltimore 410
This chapter includes the following topics:
autofetch_all 57
autofetch_all_assoc 59
autofetch_column 63
autofetch_column_multival 65
autofetch_columns 66
autofetch_row 67
autofetch_value 68
expunge_call 69
56

57
autofetch_all
Description
array autofetch_all(string sql)
Returns the results of the SQL query as a linear array of associative arrays. Each associative array contains
data for one row returned by the SQL query, with each field name as a key.
Parameters
l sql. SQL query to run against the database.
Return Values for SQL errors and zero returned rows
If there is an error in the SQL statement, returns FALSE.
If the database query returns zero rows, returns an empty array.
autofetch_all
autofetch_all
Example
Code:
$sql = "SELECT * FROM cities";
$results = $db->autofetch_all($sql);
print_r($results);
Output:
Array
(
[0] => Array
(
[state] => VA
[city] => Reston
[area_code] => 703
)
[1] => Array
(
[state] => VA
[city] => Richmond
[area_code] => 804
)
[2] => Array
(
[state] => DC
[city] => Washington
[area_code] => 202
)
[3] => Array
(
[state] => MD
[city] => Baltimore
[area_code] => 410
)
)
58

59
autofetch_all_assoc
Description
array autofetch_all_assoc(string sql [, array columns, bool collapse, bool
multival])
Without the optional parameters, returns the results of the SQL query as an associative array. Each key
value in the returned array maps to the value of the first column returned from the SQL statement. Each
value in the associative array is an associative array containing the other values from that row, using each
field name as a key.
When the columns parameter is specified, returns the results of the SQL query as an associative array.
Each key value in the returned array maps to value of the first column value specified in columns. Each
value in the associative array for the first column is an associative array with each key value as the value
from the second column value specified in columns. Each value in the associative array for the second
column is an associative array, using the names of the remaining columns returned by the SQL query as
the keys. More than two columns can be specified in columns, which will apply the behavior recursively,
with each value in the columns array as another associative array.
Parameters
l sql. SQL query to run against the database.
l columns. see the Description.
l collapse. If TRUE: If after columns is processed only one returned column remains, the values in the
associative array for the last value in columns will be the value in the remaining column. This is
instead of the values in the associative array for the last value in columns being an associative array
containing one key for the remaining column.
l multival. Prevents function from overwriting data rows if there are duplicate array keys. If TRUE, after
the columns array is processed to create nested associative arrays, the value of the innermost array
will be a linear array with each value corresponding to one returned row. The value of the linear array
is an associative array that uses the remaining column names as keys. This is instead of the innermost
associative array having the value of an associative array that uses the remaining column names as
keys.
Return Values for SQL errors and zero returned rows
If there is an error in the SQL statement, returns FALSE.
If the database query returns zero rows, returns an empty array.
autofetch_all_assoc

autofetch_all_assoc
Example 1
Code:
$sql = "SELECT * FROM cities";
$results = $db->autofetch_all_assoc($sql);
print_r($results);
Output:
Array
(
[VA] => Array
(
[city] => Richmond
[area_code] => 804
)
[DC] => Array
(
[city] => Washington
[area_code] => 202
)
[MD] => Array
(
[city] => Baltimore
[area_code] => 410
)
)
NOTE: In example 1, the first and second rows returned by the SQL query have the same index in the
returned array. The first row has not been returned by the function as it has been overwritten by the
second row. Example 4 shows the same query with the multival parameter set to TRUE, which
prevents this data loss.
Example 2
Code:
$sql = "SELECT * FROM cities";
$columns = array(0 => state, 1 => city);
$results = $db->autofetch_all_assoc($sql, $columns);
print_r($results);
60
61
Output:
Array
(
[VA] => Array
(
[Reston] => Array
(
[area_code] => 703
)
[Richmond] => Array
(
[area_code] => 804
)
)
[DC] => Array
(
[Washington] => Array
(
[area_code] => 202
)
)
[MD] => Array
(
[Baltimore] => Array
(
[area_code] => 410
)
)
)
Example 3
Code:
$sql = "SELECT * FROM cities";
$columns = array(0 => state, 1 => city);
$results = $db->autofetch_all_assoc($sql, $columns, TRUE);
print_r($results);
Output:
Array
(
[VA] => Array
(
[Reston] => 703
[Richmond] => 804
)
[DC] => Array
(
[Washington] => 202
)
[MD] => Array
(
[Baltimore] => 401
)
)
autofetch_all_assoc
autofetch_all_assoc
Example 4
Code:
$sql = "SELECT * FROM cities";
$results = db->autofetch_array_assoc($sql, NULL, FALSE, TRUE);
print_r($results);
Output:
Array
(
[VA] => Array
(
[0] => Array
(
[city] => Reston
[area_code] => 703
)
[1] => Array
(
[city] => Richmond
[area_code] => 804
)
)
[DC] => Array
(
[0] => Array
(
[city] => Washington
[area_code] => 202
)
)
[MD] => Array
(
[0] => Array
(
[city] => Baltimore
[area_code] => 410
)
)
)
62

63
autofetch_column
Description
array autofetch_column(string sql [, bool associative])
If the associative parameter is not passed or equates to FALSE, returns a linear array of values from the
first column returned by the SQL statement.
If the associative parameter equates to TRUE, returns an associative array of values from the second
column returned by the SQL statement. The array uses each value from the first column returned by the
SQL statement as an index.
Parameters
l sql. SQL query to run against the database.
l associative. If FALSE or undefined, returns a linear array of values from the first column returned by
the SQL statement. If TRUE, returns an associative array that uses the values from the first column
returned by the SQL statement as keys and values from the second column returned by the SQL
statement as values.
Return Values for SQL errors and zero returned rows
If there is an error in the SQL statement, returns FALSE.
If the database query returns zero rows, returns an empty array.
Example 1
Code:
$sql = "SELECT * FROM cities";
$results = $db->autofetch_column($sql)
print_r($results);
Output:
Array
(
[0] => VA
[1] => VA
[2] => DC
[3] => MD
)
autofetch_column

autofetch_column
Example 2
Code:
$sql = "SELECT * FROM cities";
$results = $db->autofetch_column($sql, TRUE)
print_r($results);
Output:
Array
(
[VA] => Richmond
[DC] => Washington
[MD] => Baltimore
)
NOTE: In example 2, the first and second rows returned by the SQL query have the same index in the
returned array. The first row has not been returned by the function as it has been overwritten by the
second row.
64

65
autofetch_column_multival
Description
array autofetch_column_multival(string sql)
Operates on the first two columns returned by the SQL query. Returns an associative array that uses each
unique value from the first column as indexes. Each value in the array is a linear array of values from the
second column that is associated with that key value.
Parameters
l sql. SQL query to run against the database.
Return Values for SQL errors and zero returned rows
If there is an error in the SQL statement, returns FALSE.
If the database query returns zero rows, returns an empty array.
Example
Code:
$sql = "SELECT state, city, area_code FROM cities";
$results = $db->autofetch_column_multival($sql);
print_r($results);
Output:
Array
(
[VA] => Array
(
[0] => Reston
[1] => Richmond
)
[DC] => Array
(
[0] => Washington
)
[MD] => Array
(
[0] => Baltimore
)
)
autofetch_column_multival

autofetch_columns
autofetch_columns
Description
array autofetch_columns(string sql, array fields)
Returns an associative array that uses the fields in the fields array as the keys. Each value in the array is a
linear array of values returned for that field by the SQL statement.
Parameters
l sql. SQL query to run against the database.
l fields. Array of fields to use as keys in the returned associative array.
Return Values for SQL errors and zero returned rows
If there is an error in the SQL statement, returns FALSE.
If the database query returns zero rows, returns an empty array.
Example
Code:
$sql = "SELECT * FROM cities";
$fields = array(0 => "state", 1 => "city");
$results = $db->autofetch_columns($sql, $fields);
print_r($results);
Output:
Array
(
[state] => Array
(
[0] => VA
[1] => VA
[2] => DC
[3] => MD
)
[city] => Array
(
[0] => Reston
[1] => Richmond
[2] => Washington
[3] => Baltimore
)
)
66

67
autofetch_row
Description
array autofetch_row(string sql)
Returns the first row returned by the SQL statement as an associative array. The name of each field
returned is a key value in the array.
Parameters
l sql. SQL query to run against the database.
Return Values for SQL errors and zero returned rows
If there is an error in the SQL statement, returns FALSE.
If the database query returns zero rows, returns FALSE.
Example
Code:
$sql = "SELECT * FROM cities";
$results = $db->autofetch_row($sql);
print_r($results);
Output:
Array
(
[state] => VA
[city] => Reston
[area_code] => 703
)
autofetch_row

autofetch_value
autofetch_value
Description
mixed autofetch_value(string sql)
Returns the value in the first field of the first row returned by the SQL statement.
Parameters
l sql. SQL query to run against the database.
Return Values for SQL errors and zero returned rows
If there is an error in the SQL statement, returns FALSE.
If the database query returns zero rows, returns FALSE.
Example
Code:
$sql = "SELECT * FROM cities";
$results = $db->autofetch_value($sql);
echo $results;
Output:
VA
68

69
expunge_call
Description
NULL expunge_call()
Removes the additional result sets generated when calling a stored procedure. If you call a stored
procedure using the $db object, you must call this method before executing additional queries.
Parameters
The expunge_call()method does not take any parameters.
Return Values for SQL errors and zero returned rows
The expunge_call()method always returns NULL.
expunge_call

Chapter
6
The Data Engine
Overview
This chapter describes how to use the data engine in PHPcode for custom reports in SL1.
Use the following menu options to navigate the SL1 user interface:
l
To view a pop-out list of menu options, click the menu icon( ).
l
To view a page containing all the menu options, click the Advanced menu icon ( ).
This chapter includes the following topics:
What is the Data Engine? 71
Instantiating a Data Engine Object 71
Time Range Methods 78
Normalized Data Methods 79
Dynamic Application Methods 81
Counter Processing Methods 84
Report Builder Methods 86
Other Methods 86
Data Retrieval Methods 87
70

71
What is the Data Engine?
The data engine is a class that can be used in PHPcode for reports and widgets. The data engine provides
access to collected performance data from Dynamic Applications, monitoring policies, and internal collections.
To use the data engine class in your report or widget code:
1. Instantiate a data engine object.
2. Define the time period for which you want data.
3. Optionally, configure the data engine object to return normalized data.
4. For Dynamic Application data, define the indexes for which you want data.
5. For counter data, configure how the data engine should handle counter rollovers.
6. Optionally, use other methods that are defined for the data engine class.
7. Retrieve data.
8. Use the unset() method on the data engine object. If you are instantiating multiple data engine objects, this
is recommended to prevent excessive memory usage.
Instantiating a Data Engine Object
Use the following syntax to instantiate a data engine object:
<object name> = em7_data_engine::obj(<type>, <entity_id>, <args>);
The constructor takes the following parameters:
l type. The type of data you want to retrieve. The types are:
o
dynapp. Performance Dynamic Application data.
o
vitalmap. Data associated with a collection label. Collection labels are an abstraction layer for
Dynamic Application presentation objects. If two presentation objects are associated with the same
collection label, e.g. "CPU", "Memory", or "Swap", those objects collect the same type of data. This
option is equivalent to instantiating a data engine object for the Dynamic Application presentation
object that is associated with the collection label for the specified device. For more information on
collection labels, see the Dynamic Application Development manual.
o
avail. Availability data.
o
cv. Data from a Web Content monitoring policy.
o
ports.Data from a port monitoring policy.
o
procs. Data from a SystemProcess monitoring policy.
o
tv. Data from a SOAP/XML Transaction monitoring policy.
o
dns. Data from a DomainName monitoring policy.
What is the Data Engine?
Instantiating a Data Engine Object
o
email.Data from an Email Round-Trip monitoring policy.
o
services. Data from a Windows Service monitoring policy.
o
storage.Data about File system utilization.
o
if. The following types of interface data: utilization in octets, error rate, discard rate.
o
ifutil. Data about Interface utilization, in percent.
o
vif. Data from a bandwidth billing policy.
o
itsm_har. Health, Availability, and Risk data for an IT service policy.
o
itsm. Performance metric data for an ITservice policy.
l entity_id. The IDof the primary entity with which the data is associated. For the itsm_har and itsm data
types, this is the ID of the ITservice policy. For all other data types, this is the device IDfor the device record
associated with the data.
l args. An array of arguments. The arguments array is different for each type of data. The following sections
describe the structure of this array for each type.
Dynamic Application Data
For Dynamic Application data, the args parameter for the constructor is an array that includes the following keys:
l aid. The IDof the Dynamic Application for which you want data.
l presentation_id. The IDof the presentation object for which you want data.
l index. An optional array of indexes for which you want data. If you do not supply this parameter and do not
use the set_indexes() method for supplying a list of indexes, the data engine will return data for index 0
only.
Data Associated with Collection Labels
Collection labels are an abstraction layer for Dynamic Application presentation objects. If two presentation
objects are associated with the same collection label, e.g. "CPU", "Memory", or "Swap", those objects collect the
same type of data. This option is equivalent to instantiating a data engine object for the Dynamic Application
presentation object that is associated with the collection label for the specified device. The args parameter for the
constructor is an array that includes the following key:
l map_type. The GUIDof the collection label. Collection label GUIDs are stored in the master.system_data_
labels database table. For a collection label that is installed via a PowerPack, the GUIDfor that collection
label is the same on both the source and the target system. The following table lists the GUIDs for the
default set of collection labels provided by ScienceLogic:
72

73
Label Group GUID
CPU Vitals AFF64E74C73D96244F7DB426158A359F
Memory Vitals C36F10744B4BCA7C91CD1C405BC568C0
Swap Vitals BAC2484664F897DDBC2FECB0BD798E04
In Use Video Performance D6189453171DBC7296233976D5F51AF4
Max % PacketLoss Video Performance 1C7F5513FB8ADEED16810A27293D3E34
Max Jitter Video Performance E96337379DFBEFAF393684C1800EEE4C
Rx Audio Jitter Video Performance 777985E7BB0846423653FAE19A230F8C
Rx Audio Pkts Lost Video Performance 7E86018AD212A94671FB3FADB2F14ED6
Rx Total BW Video Performance 1ECD99199531EFB695866285A79B46DF
Rx Video Jitter Video Performance D57C18E5A4730B0A2C207140427255B0
Rx Video Pkts Lost Video Performance 96AB8783E2AC72E50424DA081192F19D
Tx Audio Jitter Video Performance DAFC53AF195639B311272BF8C7169777
TxAudio Pkts Lost Video Performance 06BB4148C9FAD147ECE7E76BCFD84B01
Tx Total BW Video Performance C97457AFAE8658BF49B6C9F69E54670D
Instantiating a Data Engine Object

Instantiating a Data Engine Object
Label Group GUID
TxVideo Jitter Video Performance C97457AFAE8658BF49B6C9F69E54670D
Tx Video Pkts Lost Video Performance C03030DF1BCFC6692A627341C7EBE954
Usage Video Performance E8CE7E065677B95C83A5F404A6BA6178
Availability Data
For Availability data, the args parameter for the constructor is an array that includes the following key:
l datafields. An array that includes the data series for which you want data. You must supply an array that
includes one or both of the following values:
o
d_check. The data series for device availability.
o
d_latency. The data series for device latency.
Web Content Monitoring Policy Data
For Web Content Monitoring Policy data, the args parameter for the constructor is an array that includes the
following keys:
l policy_id. The ID of the web content monitoring policy.
l datafields. An array that includes the data series for which you want data. You must supply an array that
includes one, multiple, or all of the following values:
o
d_state. The availability data for the web content monitoring policy.
o
d_conn_time. The connection time data for the web content monitoring policy.
o
d_ns_time. The lookup time data for the web content monitoring policy.
o
d_dl_size. The page size data for the web content monitoring policy.
o
d_dl_speed. The download speed data for the web content monitoring policy.
o
d_trans_time. The transaction time data for the web content monitoring policy.
Port Monitoring Policy Data
For Port Monitoring Policy data, the args parameter for the constructor is an array that includes the following key:
l policy_id. The ID of the port monitoring policy.
For port monitoring policies, the data engine returns a single data series, labeled 'd_state', representing the
availability of the port.
74
75
System Process Monitoring Policy Data
For System Process Monitoring Policy data, the args parameter for the constructor is an array that includes the
following keys:
l policy_id. The ID of the system process monitoring policy.
l datafields. An array that includes the data series for which you want data. You must supply an array that
includes one or both of the following values:
o
d_state. The availability data for the system process monitoring policy.
o
d_counter. The number of running processes for the system process monitoring policy.
SOAP/XML Transaction Monitoring Policy Data
For SOAP/XML Transaction Monitoring Policy data, the args parameter for the constructor is an array that
includes the following keys:
l policy_id. The ID of the SOAP/XML transaction monitoring policy.
l datafields. An array that includes the data series for which you want data. You must supply an array that
includes one, multiple, or all of the following values:
o
d_state. The availability data for the SOAP/XML transaction monitoring policy.
o
d_conn_time. The connection time data for the SOAP/XML transaction monitoring policy.
o
d_ns_time. The lookup time data for the SOAP/XML transaction monitoring policy.
o
d_dl_size. The page size data for the SOAP/XML transaction monitoring policy.
o
d_dl_speed. The download speed data for the SOAP/XML transaction monitoring policy.
o
d_trans_time. The transaction time data for the SOAP/XML transaction monitoring policy.
Domain Name Monitoring Policy Data
For Domain Name Monitoring Policy data, the args parameter for the constructor is an array that includes the
following keys:
l policy_id. The ID of the domain name monitoring policy.
l datafields. An array that includes the data series for which you want data. You must supply an array that
includes one or both of the following values:
o
d_state. The availability data for the domain name monitoring policy.
o
d_ns_time. The DNS-lookup time for the domain name monitoring policy.
Email Round-Trip Monitoring Policy Data
For Email Round-Trip Monitoring Policy data, the args parameter for the constructor is an array that includes the
following keys:
Instantiating a Data Engine Object
Instantiating a Data Engine Object
l policy_id. The ID of the Email round-trip monitoring policy.
l datafields. An array that includes the data series for which you want data. You must supply an array that
includes one or both of the following values:
o
d_state. The availability data for the Email round-trip monitoring policy.
o
d_rt_time. The round-trip time data for the Email round-trip monitoring policy.
Windows Service Monitoring Policy Data
For Windows Service Monitoring Policy data, the args parameter for the constructor is an array that includes the
following key:
l policy_id. The ID of the Windows service monitoring policy.
For windows service monitoring policies, the data engine returns a single data series, labeled 'd_state', that
represents the availability of the Windows service.
File System Utilization Data
For File System Utilization data, the args parameter for the constructor is an array that includes the following
keys:
l policy_id. The ID of the file system. Note that this is the comp_index value for the file system from the
master_dev.device_hardware database table, not the inv_id value.
l datafields. An array that includes the data series for which you want data. You must supply an array that
includes one or both of the following values:
o
d_used. The utilization data for the file system, in KB.
o
d_used_percent. The utilization data for the file system, in percent.
Interface Data - Percentage Utilization
For interface utilization data in percentage values, the args parameter for the constructor is an array that includes
the following keys:
l if_id. The ID of the interface for which you want data.
l datafields. An array that includes the data series for which you want data. You must supply an array that
includes one or both of the following values:
o
d_perc_in. The inbound utilization data for the interface, in percent.
o
d_perc_out. The outbound utilization data for the interface, in percent.
Interface Data - Octets, Errors, and Discards
For interface utilization data in octets, interface error rates, and interface discard rates, the args parameter for the
constructor is an array that includes the following keys:
76

77
l if_id. The ID of the interface for which you want data.
l datafields. An array that includes the data series for which you want data. You must supply an array that
includes one, multiple, or all of the following values:
o
d_octets_in. The inbound utilization data for the interface, in octets.
o
d_octets_out. The outbound utilization data for the interface, in octets.
o
d_errors_in. The inbound error rate for the interface, in packets.
o
d_errors_out. The outbound error rate for the interface, in packets.
o
d_discards_in. The inbound discard rate for the interface, in packets.
o
d_discards_out. The outbound discard rate for the interface, in packets.
Bandwidth Billing Policy Data
For Bandwidth Billing Policy data, the args parameter for the constructor is an array that includes the following
keys:
NOTE: The data engine returns the aggregate inbound and/or outbound utilization for the interfaces in the
bandwidth billing policy, not the calculated percentile values.
l policy_id. The IDof the bandwidth billing policy for which you want data.
l datafields. An array that includes the data series for which you want data. You must supply an array that
includes one or both of the following values:
o
d_octets_in. The aggregate inbound utilization data for the interfaces in the bandwidth billing policy,
in octets.
o
d_octets_out. The aggregate outbound utilization data for the interfaces in the bandwidth billing
policy, in octets.
ITService Data - Health, Availability, and Risk
For health, availability, and risk data for an ITservice policy, the args parameter for the constructor is an array
that includes the following key:
l datafields. An array that includes the data series for which you want data. You must supply an array that
includes one, multiple, or all of the following values:
o
d_health. The calculated health metric for the ITservice.
o
d_available. The calculated availability metric for the ITservice.
o
d_risk. The calculated risk metric for the ITservice
ITService Data - Metrics
For performance metric data associated with an ITservice policy, the args parameter for the constructor is an
array that includes the following key:
Instantiating a Data Engine Object

Time Range Methods
l presentation_id. The IDof the Dynamic Application presentation object that is used to calculate this
ITservice metric. Presentation object information, including the ID, is stored in the master.dynamic_app_
presentation database table.
Time Range Methods
Before retrieving data from a data engine object, you must use one of the following methods to configure the
time range for which data will be returned:
set_date_range(<start_ts_or_now>, <end_ts_or_now>)
This method takes two parameters:
l start_ts_or_now. The start of the time range. You must pass either a unix timestamp or, to use the
current time, the string "now" in this field.
l end_ts_or_now. The end of the time range.You must pass either a unix timestamp or the string "now"
in this field to use the current time.
For example, if you instantiated the variable $data_obj as a data engine object, you can set the time range
from midnight UTCon January 1st, 2014 to the current time using the following line of code:
$data_obj->set_date_range(1388534400, 'now');
set_date_readable(<start>, <end>)
This method takes two parameters:
l start. The start of the time range.You must pass a string that is parsable by the strtotime() PHP
function.
l end. The end of the time range.You must pass a string that is parsable by the strtotime() PHP
function.
For example, if you instantiated the variable $data_obj as a data engine object, you can set the time range
from the first day of the month to the current time using the following line of code:
$data_obj->set_date_readable('first day', 'now');
set_date_range_forward(<start_ts>, <duration>, <interval>)
This method takes three parameters:
l start_ts. The start of the time range. You must pass a unix timestamp value.
l duration. The duration of the time range. The units for the duration are specified by the interval
parameter.
l interval. The units for the duration parameter. You must pass one of the following strings: 'SECOND',
'MINUTE', 'HOUR', 'DAY', 'MONTH', or 'YEAR'.
78

79
For example, if you instantiated the variable $data_obj as a data engine object, you can set the time range
from midnight UTCon January 1st, 2014 to 30 days later using the following line of code:
$data_obj->set_date_range_forward(1388534400, 30, 'DAY');
set_date_range_reverse(<end_ts>, <duration>, <interval>)
This method takes three parameters:
l end_ts. The end of the time range. You must pass a unix timestamp value.
l duration. The duration of the time range. The units for the duration are specified by the interval
parameter.
l interval. The units for the duration parameter. You must pass one of the following strings: 'SECOND',
'MINUTE', 'HOUR', 'DAY', 'MONTH', or 'YEAR'.
For example, if you instantiated the variable $data_obj as a data engine object, you can set the time range
to be the 12 hours, ending at midnight UTCon January 1st, 2014 using the following line of code:
$data_obj->set_date_range_reverse(1388534400, 12, 'HOUR');
The following method can be used to retrieve the timestamp of the first collected item in the available data set:
get_first_timestamp()
The following method can be used to retrieve the timestamp of the last collected item in the available data set:
get_last_timestamp()
For example, if you instantiated the variable $data_obj as a data engine object, you can set the time interval to 4
hours up to the last collection time with the following lines of code:
$last_ts = $data_obj->get_last_timestamp();
$data_obj->set_date_range_reverse($last_ts,4,'HOUR');
Normalized Data Methods
By default, the data engine class returns the raw collected values for the selected data type. Additional methods
are available that configure a data engine object to return normalized (rolled-up) data. Normalized data includes
values for the average, minimum, maximum, sum, and standard deviation for the data in each normalization
period. Depending on the frequency at which raw data is collected, up to two different normalization periods are
available:
l Hourly normalized data
l Daily normalized data
Normalized Data Methods

Normalized Data Methods
NOTE: Frequent normalization has been deprecated in the SL1. Methods that previously specified frequent
normalization will now return hourly normalized data.
Return Normalized Data for a Specified Normalization Period
To configure a data engine object to return normalized data for a specific normalization period, call one of the
following methods with the specified parameters:
NOTE: You cannot reconfigure a data engine object to return normalized data if that object has already
been used to return data.
l Frequent data:
set_norm_interval('FREQ','MIN')
l Hourly data:
set_norm_interval(1,'HOUR')
l Daily data:
set_norm_interval(1,'DAY')
Return a Specified Number of Data Points of Normalized Data
To configure a data engine object to return normalized data with an automatically-selected normalization period
based on a maximum number of data points, use the following method:
set_norm_interval_auto(<max_points>, <allow_raw>)
This method takes the following parameters:
l max_points. Pass an integer value. The maximum number of data points that should be returned
when one of the data retrieval methods is called. The set_norm_interval_auto method will determine
which available normalization period will generate the most data points for the currently specified
timeperiod that is less than the max_points value.
l allow_raw. Pass a boolean value. If you pass TRUE for this parameter, the method will not configure
the data engine object to return normalization data if there are fewer raw collected data points in the
specified time period than the max_points parameter. If you pass FALSE for this parameter, the
method will always configure the data engine object to use normalized data.
Return a Specified Type of Normalized Data (Average, Minimum,
Maximum, Standard Deviation, Sum)
When you configure a data engine object to return normalized data, you can specify which calculated values will
be returned for each normalization period by calling the following method:
80

81
NOTE: If you do not call this method, a default list of values will be used. The default list includes average,
minimum, maximum, standard deviation high value, and standard deviation low value.
set_norm_fields(<fields>)
This method takes a single parameter: an array of data labels that correspond to the different calculated
values that are available for normalized data. Valid array values are:
l avg. Returns the average of the collected values from each normalization period. This value is
included in the default list.
l min. Returns the smallest collected value from each normalization period. This value is included in
the default list.
l max. Returns the largest collected value from each normalization period. This value is included in the
default list.
l std. Returns the standard deviation for the collected values from each normalization period.
l sum. Returns the sum of the collected values from each normalization period.
l std_high. Returns either the average value plus half the standard deviation value or the largest
collected value from each normalization period, whichever is higher. This value is included in the
default list.
l std_low. Returns either the average value minus half the standard deviation value or the smallest
collected value from each normalization period, whichever is lower. This value is included in the
default list.
Dynamic Application Methods
The following methods can be used to get information about Dynamic Applications, Presentation Objects, and
Indexes.
Return Information about a Dynamic Application
The following method can be used to get information about the Dynamic Application for which the data engine
object is configured:
get_app_info(<field>)
The field parameter is optional. If no parameter is specified, the method returns an array that contains the
following key/value pairs:
l app_type. The type of Dynamic Application. Possible values are:
o
0. SNMP Performance.
o
4. XMLPerformance.
o
8. Database Performance.
Dynamic Application Methods
Dynamic Application Methods
o
10. SOAP Performance.
o
14. Snippet Performance.
o
16. XSLT Performance.
o
18. WMIPerformance.
o
22. PowerShell Performance.
l poll. The poll frequency of the Dynamic Application, in minutes.
l name. The name of the Dynamic Application.
l db. The database that contains the data returned by this object.
l table. The name of the database and database table that contains the data returned by this object. This
value is in the format "<database>.<database_table>".
You can optionally pass one of the listed array keys in the field parameter. If you pass a parameter, the method
will return the value associated with that key instead of returning an array.
Return Information about a Presentation Object
The following method can be used to get information about the presentation object for which the data engine
object is configured:
get_presentation_info(<field>)
The field parameter is optional. If no parameter is specified, the method returns an array that contains the
following key/value pairs:
l presentation_id. The ID of the presentation object.
l presentation_guid The PowerPack GUID of the presentation object.
l app_id. The IDof the Dynamic Application with which the presentation object is associated.
l app_guid. The PowerPack GUID of the Dynamic Application with which the presentation object is
associated.
l name. The name of the presentation object.
l formula. The formula used to calculate each data point for the presentation object.
l hourly. This field is deprecated.
l daily. This field is deprecated.
l monthly. This field is deprecated.
l monthly_tot. This field is deprecated.
l 3month. This field is deprecated.
l yearly. This field is deprecated.
l suffix. The suffix that represents the units for the presentation object, e.g. "%", "MB", etc.
l graph_type. This field is deprecated.
82

83
l guage. Whether the presentation object represents a percentage value. Possible values are 0 (zero) for no
or 1 (one) for yes. This key name is not spelled "gauge".
l descr. The description of the presentation object.
l overview. This field is deprecated.
l state. Whether the presentation object is enabled. Possible values are 0 (zero) for disabled or 1 (one) for
enabled.
l edit_user. The ID of the user account that last edited this presentation object.
l edit_date. The date and time that the presentation object was last edited, in YYYY-MM-DD HH-MM-SS
format.
l comp_mapping.Whether the presentation is "vitals linked" to represent the CPU, Memory, or Swap
utilization for subscriber devices. Possible values are:
o
0. The presentation object is not vitals linked.
o
1. The presentation object represents the CPU utilization for subscriber devices.
o
4. The presentation object represents the Memory utilization for subscriber devices.
o
5. The presentation object represents the Swap utilization for subscriber devices.
l units. The data unit for the presentation object, e.g. "Percent", "Megabytes", etc.
l formula_req_oids. An array that contains the IDs for the collection objects that are required to calculate a
value for the presentation object.
l formula_oids. An array that contains the IDs for all collection objects that are used to calculate a value for
the presentation object.
l oid_classes. An array that contains the numeric class type for all collection objects that are used to
calculate a value for the presentation object. The array keys are the ID for each collection object.
You can optionally pass one of the listed array keys in the field parameter. If you pass a parameter, the method
will return the value associated with that key instead of returning an array.
Return Information about Indexes
The following method can be used to get the label for a specific index:
NOTE: For details on indexing in Dynamic Applications, see the manual Dynamic Application
Development..
get_series_name(<index>)
This method takes a single parameter, the index for which you want the label. If the label value is not available for
the specified index, the index is returned.
The following method, which takes no parameters, can be used to get a list of all available indexes:
get_indexes()
Dynamic Application Methods

Counter Processing Methods
This method returns an array:
l The array keys are the available indexes.
l The array values are the label for each index, if available. If label values are not available, the array values
are the same as the array keys.
The following method can be used to specify the indexes for which the data engine object will return data:
set_indexes(<indexes>)
This method takes one parameter: an array of indexes for which you want data. If you did not pass indexes to the
constructor and do not call this method, the data engine will return data for index 0 only.
NOTE: The get_indexes() method returns the available indexes as array keys and the set_indexes() method
expects indexes to be array values. To configure a data engine object to return data for all available
indexes, use the PHP array_keys() function on the output of get_indexes() before passing it to set_
indexes().
Counter Processing Methods
For counter objects:
l SL1 stores the raw collected value.
l For each collected value, the data engine returns the difference between the collected value and the
previously collected value. That is, counter math is already applied to all data returned by the data engine.
There are multiple circumstances under which a collected value for a counter is lower than the previously
collected value. SL1 includes logic that determines which of the following circumstances occurred:
l The maximum value has been exceeded and counter was reset to zero.
l Data was collected out-of-order, that is, due to a slowdown somewhere in the network, two counter values
were stored out of sequence.
l The counter was manually reset to zero on the external device.
Two thresholds control this behavior:
l The Rollover Percent threshold is used to determine when a 32-bit counter has reached its maximum value
and restarted counting. When SL1 encounters a counter value from a 32-bit counter that is lower than the
previously collected value, SL1:
1. Calculates the difference between the two counter values (the delta) using the following formula:
maximum value (2
32
) - Last Collected Value + Current Collected Value
84

85
2. Examines the value of the Rollover Percent threshold. If the delta is less than the specified percentage
of the maximum possible value (2
32
), SL1 concludes that the 32-bit counter rolled over. When
SL1determines a 32-bit counter has rolled over, SL1 uses the delta value when displaying the data
point for this poll period.
NOTE: For 64-bit counters, when the counter values go from a higher value to a lower value, SL1
assumes that the counter has been manually reset or that the two values were collected out of
order. The Rollover Percent threshold does not apply to 64-bit counters.
l The Out-of-order Percent threshold is used to determine when data has been collected out of order. When
SL1 encounters a counter value that is lower than the previously collected value and SL1 has determined
that the value is not a rollover, SL1:
1. Compares the current value to the last collected value:
current value / last collected value
2. If the ratio of current value / last collected value is greater than the percent specified in the Out-of-
order Percent field, SL1 concludes that the data was collected out of order.
3. When SL1 determines a data point has been collected out of order, SL1 uses the following value as
the current value of the data point:
last collected value - current collected value
If a collected value does not meet the rollover or out-of-order criteria, SL1 assumes a manual reset occurred and
the current collected value is used for the data point.
By default, the data engine uses the default values for both thresholds:
l Rollover Percent. 20%
l Out-of-order Percent. 50%
The following method, which takes no parameters, configures a the data engine object to use the Rollover
Percent and Out-of-order Percent thresholds that have been specified for the device with which the data is
associated:
load_counter_thresholds()
The following method can be used to specify custom Rollover Percent and Out-of-order Percent thresholds:
set_counter_thresholds(<rollover>,<outoforder>)
This method takes the following parameters:
l rollover. The Rollover Percent threshold to apply to the data returned by the object.
l outoforder. The Out-of-order Percent threshold to apply to the data returned by the object.
Counter Processing Methods

Report Builder Methods
Report Builder Methods
The report_builder_table class and its methods let you add grouping (separated by) in custom reports.
Methods from the report_builder_table class:
l set_data($data). This function takes raw data as a parameter and sets data to be displayed in report
output tables. For example: $table->set_data($data);
l set_dynamic_columns($column_arr). This function sets the dynamic columns to be used by the
bindcell directive in the report.
l add_total_column ($column, $function). This function sets the column that will be used to show
aggregated for total rows.
l populate(). This function builds the final output table and initiate the .ods report building.
l add_separation_level(). This function defines the grouping and separation levels.
NOTE: You can use additional methods in the report_builder_table class as needed.
Other Methods
The following method, which takes no parameters, returns the name of the database that contains the data
returned by this object.
get_db()
The following method returns the name of the database and database table that contains the data returned by
this object. The returned value is in the format "<database>.<database_table>":
get_table(<norm>)
This method takes one boolean parameter. If FALSEis passed, the method returns the table that contains the raw
data. If TRUEis passed and the object has been configured to return normalized data, the method returns the
table that contains the normalized data returned by this object.
The following method, which takes no parameters, returns an array that includes the currently defined start and
end times for the time period in unix timestamp format. The start and end times are at array indices 0 and 1,
respectively:
get_date_range()
86

87
Data Retrieval Methods
To retrieve data from a data engine object, call the following method:
get_datasets()
This method returns an array. The structure of the returned array is different for raw and normalized data. For
both raw and normalized data, the array includes data series objects, which have methods for retrieving
arrays of data.
Raw Data
For raw data, the get_datasets() method returns an array of data series objects. The array of data series objects
has the following keys:
l For Dynamic Application data (including CPU, Memory, and Swap data), the key values are the indexes that
were specified in the index parameter in the constructor or the set_indexes() method.
l For port and Windows service monitoring policy data, a single key: "d_state".
l For ITservice metric data, a single key: "1".
l For all other data types, the key values are the data series labels that were specified in the datafields array
that was passed to the constructor.
Normalized Data
For normalized data, the get_datasets() method returns an array with the same key values listed for raw data.
Each key points to an array that includes keys for each value that was passed to the set_norm_fields() method. If
you did not call this method, a default list of array keys is used. Possible array keys are:
l avg. Returns the average of the collected values from each normalization period. This value is included in
the default list.
l min. Returns the smallest collected value from each normalization period. This value is included in the
default list.
l max. Returns the largest collected value from each normalization period. This value is included in the
default list.
l std. Returns the standard deviation for the collected values from each normalization period.
l sum. Returns the sum of the collected values from each normalization period.
l std_high. Returns either the average value plus half the standard deviation value or the largest collected
value from each normalization period, whichever is higher. This value is included in the default list.
l std_low. Returns either the average value minus half the standard deviation value or the smallest collected
value from each normalization period, whichever is lower. This value is included in the default list.
Each key in each array of normalized data labels points to a data series object.
Data Retrieval Methods
Data Retrieval Methods
Data Series Object Retrieval Methods
The following method can be used to retrieve the array of values from a data series object:
get_array(<addpadding>)
This method returns an array of values for the data series. The array keys are the collection times in unix
timestamp format.
This method takes one boolean parameter: addpadding. If TRUEis passed, the array of values includes
NULLvalues for collection times where collection is expected, but no value exists (i.e. a missed poll). If FALSEis
passed, missed polls are not included in the output array.
The following method can be used to retrieve the number of missed polls (NULLvalues) that occurred during the
time span of the data series:
get_missed()
This method returns an integer value equal to the number of missed polls.
The following method can be used to retrieve a bi-directional weighted average for each collection time:
get_smoothed()
This method returns an array of smoothed values for the data series. Smoothed values are a bi-directional
weighted average for each raw data point. The array keys are the collection times in unix timestamp format.
88

Chapter
7
Debugging Reports
Overview
This chapter describes the logging options that are available to report and widget developers. Logging can be
enabled on any appliance that provides the user interface (Administration Portals, Database Servers, and All-In-
One Appliances). When logging is enabled on an appliance:
l As a user navigates the user interface on that appliance, the ScienceLogic user interface code will write
messages to the user interface log file.
l When reports are generated on the appliance, reports that are configured to log messages will write to the
user interface log file.
l When widgets are loaded in the user interface of the appliance, widgets that are configured to log messages
will write to the user interface log file.
Use the following menu options to navigate the SL1 user interface:
l
To view a pop-out list of menu options, click the menu icon( ).
l
To view a page containing all the menu options, click the Advanced menu icon ( ).
This chapter includes the following topics:
Controlling Log Settings 90
Setting UI Developer Log Levels 90
Setting UI/REST MySQL Query Log Levels 90
Configuring Advanced Log Settings 91
Writing to the Log File 91
89

90
WARNING: Log rotation is not enabled on the log files described in this chapter. The log files described in
this chapter can cause the file system to become full if they remain enabled for a long period of
time. Do not leave the log files described in this chapter enabled unless you are actively
debugging a problem with the user interface, a report, or a widget.
Controlling Log Settings
In rare cases, you may need to modify log levels or suppression of certain logs in SL1, usually at the request of
ScienceLogic Customer Support. To do so, you will navigate to the PHP Developer Logs page (System > Tools
> PHP Developer Logs). This section describes the options included on the PHP Developer Logs page.
NOTE: This page is only available in the classic user interface.
Setting UI Developer Log Levels
When configuring logging on an appliance, you must specify a log level. The log level controls the types of
messages that are written to the user interface log file (em7php.log). Each type of message has an associated
number; the log level is the sum of all enabled messages. The numbers and associated message types are:
l 1. Critical
l 2. Error
l 4. Warning
l 8. Info
l 16. Debug
l 32. Trace
To determine the log level, sum the numbers associated with each type of message you want to enable. For
example, if you want to enable Critical, Error, and Warning messages, you would sum one, two, and four to get a
log level value of seven.
Setting UI/REST MySQL Query Log Levels
The UI/REST MySQL Query Log Levels settings let you specify the log level for the mysqli.log. This log file
collects every PHP-based call to MySQL and includes general information about the query. Determine the
granularity of data you want and select one or more checkboxes.
l Error
l Warning
l Info (non-error)
Controlling Log Settings

Writing to the Log File
Configuring Advanced Log Settings
In the Advanced Settings section, you can configure the datatime format you want
l Suppression List. This list acts as a bitmask to log entries. For example, to suppress all entries for css-em7,
you would enter "css.em7::127", where 127 is the sum of all possible log levels. You can specify multiple
suppressions in the list, separated by commas.
l Datetime Format. Specifies a user-defined date format that will be used for5 system logs. You can use any
date variables supported by the PHP date function in this field.
NOTE: Seconds and milliseconds are always appended to the datetime stamp.
Writing to the Log File
PHP code for reports and widgets can write messages to the log file by using one of the following functions.
Although these functions can be called at any time, messages will be written to the log file only if logging is
configured with a log level that includes the message type created by the function. Each function takes one
parameter, a message string (denoted by $msg) to be written to the log file:
l To write a log message of type "Critical", use the following function:
devlog::crit($msg);
l To write a log message of type "Error", use the following function:
devlog::err($msg);
l To write a log message of type "Warning", use the following function:
devlog::warn($msg);
l To write a log message of type "Info", use the following function:
devlog::inf($msg);
l To write a log message of type "Debug", use the following function:
devlog::dbg($msg);
91

Chapter
8
Report Output
Overview
This chapter describes how to use output templates when creating reports in SL1.
Use the following menu options to navigate the SL1 user interface:
l
To view a pop-out list of menu options, click the menu icon( ).
l
To view a page containing all the menu options, click the Advanced menu icon ( ).
This chapter includes the following topics:
What is an Output Template? 93
Output Methods 93
Array Binding Directives 94
Conditional Directives 95
Style Directives 95
Image and Chart Directives 95
92

93
What is an Output Template?
An Output Template is an Open Office Spreadsheet file (.ods file) that defines the format of the generated
report. An Output Template defines the formatting and table structure you want to use for the generated report.
An output template includes one or more output directives. An output template directive indicates how output
provided by report gluecode should be laid out. There are four general types of output directives:
l Array Binding Directives. These output template directives define a section of the output template (a cell, a
row, a table, or an entire sheet) that will be repeated for each item in an array outputted by the gluecode.
For example, suppose a report outputs a list of tickets, with one ticket on each row. The gluecode for the
report outputs an array of tickets. The output template would include the bindrow output template directive,
specifying the name of that array, to indicate the row that should be repeated for each ticket in the output.
l Conditional Directives. These output template directives include or exclude sections of the output template
(e.g. columns, rows, tables, etc) based on the output from the gluecode. For example, suppose a report has
an option that can be used to include or exclude certain columns. The glucode for the report would output a
boolean value for each optional column, indicating whether the column should be included. The output
template would include the ifcol output template directive in each column to indicate that the inclusion of
that column is controlled by the boolean value.
l Style Directives. These output template directives can be used to dynamically apply styles to cells in the
output. For example, suppose a report outputs a color-coded list of tickets, with the colors applied based on
the severity of the ticket. The gluecode for the report would include the color that is associated with each
ticket in the output. The output template would include the applystyle output template directive in the
appropriate cell(s) to select the style that matches that color.
l Image and Chart Directives. These output template directives can be used to place images and charts in
the output.
Output Methods
There are two different methods by which gluecode can output values to the output template. The structure of the
output template is the same for both methods. Every report must use only one of the two methods:
l The $output array. This option passes the entire data set to the output template when the gluecode has
finished executing. This method is easier to use. However, the PHP memory limit for the execution of a single
report is 3 MB, which typically translates to a row-limit of 10,000.Large reports will generate a memory
error and fail to execute when using the $output array.
l The $em7_report object. When using this option, output is passed incrementally using a set of methods
associated with the $em7_report object. This method typically requires more lines of code in the gluecode.
However, this option does not require the entire data set to reside in memory.
What is an Output Template?

Array Binding Directives
Array Binding Directives
The following directives can be used to dynamically repeat a section of the output template multiple times. These
directives correspond to an array in the output; the number of times the section of the output is repeated is equal
to the number of array elements supplied by the gluecode:
l [bindrow:array]. Binds an array from the output to a row. The array parameter must match the name of an
array in the gluecode. If this directive is inside another repeating element, e.g. a table or sheet, use
[bindrow:#.array]. When this directive is included on a formatted row, a single row in that format will be
created for each item in the array. There is no closing directive for [bindrow:array]. The array value for
each row is another array of values. To place a value from the array for a row in a column, use one or more
of the following directives:
o
{##}. Places the array key for this row.
o
{#.key}. Places a value from the array of values for the row with array key key.
l [bindtable:array][endbindtable:array]. Binds an array from the output to a table. The array parameter
must match the name of an array in the gluecode. If this directive is inside another repeating element, i.e. a
sheet, use [bindtable:#.array]. When this directive surrounds a formatted table, a single table in that
format will be created for each item in the array. Each [bindtable:array] directive must be closed with an
[endbindtable:array] directive. The array value for each table is another array of values, typically including
additional array dimensions for use with [bindrow:#.array] directives. To use the values from the array for
a table, use one or more of the following directives:
o
{##}. Places the array key for this table inside a cell.
o
{#.key}. Places a value from the array of values for the table with array key key.
o
[bindrow:#.array]. Binds an array from the array for a table to a row, i.e. nests repeating rows
inside a repeating table. See the description of [bindrow:array] for a description on how to use this
directive.
l [bindsheet:array]. Binds an associative array to a sheet in the output document. The array parameter must
match the name of an array in the gluecode. When this directive is used on a formatted sheet, a sheet in that
format will be created for each item in the array. There is no closing directive for [bindsheet:array]. The
array value for each table is another array of values, typically including additional array dimensions for use
with [bindtable:#.array] and [bindrow:#.array] directives. To use the values from the array for a sheet,
use one or more of the following directives:
o
{##}. Places the array key for this sheet inside a cell.
o
{#.key}. Places a value from the array of values for the sheet with array key key.
o
[bindrow:#.array]. Binds an array from the array for a sheet to a row, i.e. nests repeating rows
inside a repeating sheet. See the description of [bindrow:array] for a description on how to use this
directive.
o
[bindtable:#.array]. Binds an array from the array for a sheet to a table, i.e. nests repeating tables
inside a repeating sheet. See the description of [bindtable:array] for a description on how to use this
directive.
94

95
l [bindcell:array]. Binds an array from the output to a row or cells. The array parameter must match the
name of an array in the gluecode. If this directive is inside another repeating element, e.g. a row, a table, or
a sheet, use [bindcell:#.array]. Each value in the array will be placed in a separate cell in the row. There is
no closing directive.
Conditional Directives
The following output directives conditionally include output template elements in the output based on values
passed by the gluecode:
l [columns:option]. Expands or collapses a set of merged cells to handle optional columns. option can be
expand, collapse, or flex.
l [if:bool][endif]. Conditionally displays rows based on a boolean evaluation. If bool is true, this row up to
and including the [endif] directive is displayed.
l [if:bool][else][endif]. Conditionally displays rows based on a boolean evaluation. If bool is true, this row
up to the row beginning with [else] is displayed. If bool is false, the row beginning with [else] up to and
including the [endif] directive is displayed.
l [ifcol:bool]. Conditionally displays columns based on a boolean evaluation. Place this directive at the
bottom of the output template. If bool is true, this column is displayed. If bool is false, this column is hidden.
Style Directives
The following output directives change the style applied to individual cells:
l [cellstyle:style]. Changes the style of a cell to the specified style. The specified style must already exist in the
template's available styles.
l [applystyle:style]. Adds style to a cell. This directive adds only the specified style; the specified style does
not inherit properties or related styles from its parent style.
Image and Chart Directives
The following output directives add images or chart data passed by the gluecode:
l [bindimage:image]. Dynamically adds an image. Make sure the cell is large enough to contain the image.
l [bindchart:1]. Identifies a cell into which a chart will be inserted. The :1 is for future use.
The following Output Template Directives can be included in the same cell as a [bindchart:1] directive and will
substitute values into the chart properties:
l [chart_xmin:value]. Substitutes the value of variable value into the Minimum field for the X-axis. You must
uncheck the Automatic checkbox on the Output Template for value to be substituted.
Conditional Directives
Image and Chart Directives
l [chart_xmax:value]. Substitutes the value of variable value into the Maximum field for the X-axis. You
must uncheck the Automatic checkbox on the Output Template for value to be substituted.
l [chart_xmajor:value]. Substitutes the value of variable value into the Major interval field for the X-axis.
You must uncheck the Automatic checkbox on the Output Template for value to be substituted.
l [chart_xminor:value]. Substitutes the value of variable value into the Minor interval count field for the X-
axis. You must uncheck the Automatic checkbox on the Output Template for value to be substituted.
l [chart_ymin:value]. Substitutes the value of variable value into the Minimum field for the Y-axis. You must
uncheck the Automatic checkbox on the Output Template for value to be substituted.
l [chart_ymax:value]. Substitutes the value of variable value into the Maximum field for the Y-axis. You
must uncheck the Automatic checkbox on the Output Template for value to be substituted.
l [chart_ymajor:value]. Substitutes the value of variable value into the Major interval field for the Y-axis.
You must uncheck the Automatic checkbox on the Output Template for value to be substituted.
l [chart_yminor:value]. Substitutes the value of variable value into the Minor interval count field for the Y-
axis. You must uncheck the Automatic checkbox on the Output Template for value to be substituted.
For more information on how these values affect the presentation of the graph, in the OpenOffice spreadsheet,
go to the Object Properties page, go to the Scale tab, and select the Help button to open OpenOffice help.
96

Chapter
9
Output Styles and Media
Overview
When creating an .ods file to use as a report template, you can use the OpenOffice Calc formatting options to
change the look and feel of your custom reports. SL1 includes several options for maintaining consistency across
multiple output templates:
l Instead of including a static logo in reports, you can specify that a report will use the logo associated with
each user's theme.
l For commonly used styles, you can add them to the global list of styles that is included with each report
template downloaded from the ReportOutput Templates page.
l You can upload commonly used images to the Report Output Media page for re-use in multiple reports.
Use the following menu options to navigate the SL1 user interface:
l
To view a pop-out list of menu options, click the menu icon( ).
l
To view a page containing all the menu options, click the Advanced menu icon ( ).
This chapter includes the following topics:
Using Theme Logos 98
Adding Global Styles 99
Report Output Media 100
97

98
Using Theme Logos
Instead of including a static logo in reports, you can specify that a report will use the report logo assigned to each
user's theme. To assign a report logo to a theme:
1. Go to the Theme Management page (System > Customize > Themes).
2.
Select the wrench icon ( ) for the theme to which you want to assign a new report logo. The Theme Editor
page is displayed.
3. In the Theme Images section, select a new logo in the Report Logo field. You can upload a new logo for
use in this field under the [Images] tab.
4. Select the Save button. Users who subscribe to this theme will see the new logo in all reports that use the
report logo setting.
To configure an output template to use the Report Logo from a theme:
1. In the output template for the report, merge or expand cells to create an appropriately sized cell that can
display the report image. SL1 will automatically proportionally scale the report logos to fit this cell, i.e. the
image will be scaled until either the height or width is the same as the height or width of the cell. In most of
the ScienceLogic default reports, this cell is 5 standard rows high and a width proportional to the data
displayed in the report. For example, the Asset Warranty Expiration report includes the input options in the
header. The width of the report image is the remaining width of the data table:
2. In the cell, enter the following output directive, entering the desired alignment settings where indicated:
[bindimage:logoimage:<alignment 1>:<alignment 2>]
Possible values for the first alignment setting are:
l left. The image will be aligned to the left border of the cell.
l right. The image will be aligned to the right border of the cell.
l center. The image will be equidistant from the left and right borders of the cell.
Possible values for the second alignment setting are:
l top. The image will be aligned to the top border of the cell.
l bottom. The image will be aligned to the bottom border of the cell.
l middle. The image will be equidistant from the top and bottom borders of the cell.
Using Theme Logos

Adding Global Styles
3. Add a default logo image to the report and anchor the image to the cell.
Adding Global Styles
For commonly used styles, you can add them to the global list of styles that is included with each report template
downloaded from the ReportOutput Templates page (Reports > Management > Report Output Templates).
To view the list of global styles, go to the Report Output Styles page (Reports > Management > Report Output
Styles):
For each global style, the page displays the following information:
l Style Family. The type of style.
l Style Name. The name of the style.
l
Style Description. A description of the style. You can select the wrench icon ( ) in this field to edit the
description of the style.
l Parent Style. The style that this style is linked to in OpenOffice.
l Edited By. The user that last imported the style.
l EditedOn. The date and time that the style was last edited.
To add a global style:
1. Go to the Report Output Styles page (Reports > Management > Report Output Styles).
2. Select the Export button and save the em7_styles.ods file to your local system.
99

100
3. In the em7_styles.ods file, create a new custom style and save the .ods file. For information about adding
and editing custom styles in OpenOffice Calc, see:
https://wiki.openoffice.org/wiki/Documentation/OOo3_User_Guides/Calc_Guide/Styles_and_
Templates.
4. In the Report Output Styles page, select the Import button.
5. In the modal page that appears, select the Browse button, locate the updated em7_styles.ods file, and then
select the Import button. The Import Styles page is displayed:
6. Select the checkbox for your new style and select the [Import] button.
7. Your new style will now be displayed in theReport Output Styles page and will be included when an
output template is downloaded with global styles from the Report Output Templates page. To add a
description, select the wrench icon for the new style ( ).
NOTE: Although new styles will be included in existing output templates when they are downloaded from the
Report Output Templates page, new styles are not automatically added to the existing templates,
i.e., if you generate a report in .ods format, the new style will not automatically appear.
Report Output Media
You can upload commonly used images to the Report Output Media page for re-use in multiple reports.
To upload an image:
1. Go to the Report Output Media page (Reports > Management > Report Output Media).
2. Select the Upload button.
3. In the modal page that appears, select the [Browse] button, locate the image file on your local system, and
then select the [Upload] button.
To configure a report to use the image:
Report Output Media
Report Output Media
1. In the output template for the report, merge or expand cells to create an appropriately sized cell that can
display the image. SL1 will automatically proportionally scale the image to fit this cell, i.e. the image will be
scaled until either the height or width is the same as the height or width of the cell.
2. In the cell, enter the following output directive, entering a unique output variable name and the desired
alignment settings where indicated:
[bindimage:<variable_name>:<alignment 1>:<alignment 2>]
Possible values for the first alignment setting are:
l left. The image will be aligned to the left border of the cell.
l right. The image will be aligned to the right border of the cell.
l center. The image will be equidistant from the left and right borders of the cell.
Possible values for the second alignment setting are:
l top. The image will be aligned to the top border of the cell.
l bottom. The image will be aligned to the bottom border of the cell.
l middle. The image will be equidistant from the top and bottom borders of the cell.
3. Add a default logo image to the report and anchor the image to the cell.
4. In your report gluecode, use the following function, entering the file name of the image (displayed in the
Report Output Media page) and the output variable name (specified in the output directive) where
indicated:
$output['<variable_name>']=od_image('<image_file_name>');
To delete an image:
1. Go to the Report Output Media page (Reports > Management > Report Output Media).
2. Select the checkbox for the image(s) you want to delete.
3. In the Select Action drop-down list in the lower right of the page, select the Delete File button, and then
select the [Go] button.
101

Example
1
Simple Tabular Report
Overview
This example will walk you through creating a simple tabular report in SL1.
The following steps are covered in this example:
Report Elements 103
Creating the Report Input Form 104
Creating the Report Output Template 105
Creating the Gluecode 110
Extracting Input Values 110
Processing Inputs and Building a WHERE Clause 111
Querying the Database 112
Populating the $output Array 114
Using $em7_report to Output Results 114
Populating the Date 115
Creating the Report Template 115
Full Code Listing for the $output Version 117
Full Code Listing for the $em7_report Version 118
102

103
Report Elements
There are three elements that must be created during report development:
l Input Form. Defines the user interface for a report. This user interface allows the user to provide inputs to
use in the report. Inputs may include specifying a timespan for the report, selecting specific elements to
include in the report, and selecting the information to include in the report. The Input Form defines the GUI
elements that make up the form itself, how the GUI elements interact with each other, and how the input
should be passed to the Gluecode.
l Gluecode. PHP code that examines the inputs provided in the Input Form and makes database queries to
the ScienceLogic database to gather the required data. The Gluecode then formats the data so it can be
populated into the Output Template.
l Output Template. OpenOffice speadsheet that defines the layout and formatting styles of the report. An
Output Template can include directives that define how data should be displayed depending on how the
Gluecode outputs the data.
This example will focus on creating simple versions of each of these elements. The report we will create in this
example will:
l Show a simple table of all tickets, with the following columns:
o
Ticket ID
o
Organization
o
Severity
o
Description
o
Date Create
o
Created By
o
Category
o
Status
o
Source
o
Queue Name
o
Assigned To
l Allow the list of tickets to be limited to specific organizations.
After we create the three elements (Input Form, Gluecode, Output Template), we will use them in a Report
Template, which is used to generate the Report. This example includes two versions of the gluecode that use
different methods for outputting data.
NOTE: The examples in this chapter are available on the ScienceLogic Customer Portal in the
ExampleReports PowerPack.
Report Elements

Creating the Report Input Form
Creating the Report Input Form
In our example, the Report Input Form will include an option that limits the results to only tickets for specific
organizations.
First, create a new Report Input Template:
1. Go to Reports > Management > Report Input Forms. The Report Input Forms page is displayed.
2. Select the [Create] button. The Report Form Editor page is displayed:
3. Supply a value in each of the following fields:
l Form Name. Name of the Report Input Form. This example is called "Simple Ticket List".
l Form Type. Can be set to either Report or Component. If Report is selected, the Report Input Form
can be used to generate reports. If Component is selected, the Report Input Form can be used as an
element in other Report Input Forms. This example uses the default value, Report.
l Version. The version number for the Report Input Form. SL1 uses this when reports are included in
Power Packs. This example uses the default value, "1.0".
l Author. The person who authored the Report Input Form. This example uses "ScienceLogic
Documentation Team".
4. Click the [Save] button.
104

105
Now that we have created the Report Input Form, we can add the input elements. This example uses one input
element, the Organization Selector, which is one of the default Custom Report Components. Custom Report
Components allow common combinations of elements to be reused in many Report Input Forms. In this case, the
Organization Selector includes the input elements that allow a user to select an organization from a list of all
organizations in the system. To add the Organization Selector to the Report Input Form:
1. In the Available Components pane, double click on Organization Selector. The Organization Selector
appears in the Form Structure pane.
2. Select the wrench icon for the Organization Selector. The Editing Organization Selector Component
modal window is displayed:
3. Supply a value in each of the following fields:
l Input Name. Name that identifies this instance of the Organization Selector and its input to the
gluecode. In our example, the Organization Selector is named "orgs".
l Width. Specifies the width in pixels of the Organization Selector when it is displayed on the Report
Input Form. This example uses the default value of "200".
l Height. Specifies the height in pixels of the Organization Selector when it is displayed on the Report
Input Form. In our example, we leave this field blank, so SL1 automatically calculates the height
based on the size of the list of organizations.
4. Click the [Save] button. The Editing Organization Selector Component modal window closes.
5. Click the [Save] button on the Report Form Editor window. The Report Input Form for this example is now
complete.
Creating the Report Output Template
In this example, we will use the default global styles for the Report Output Template. To create the Report Output
Template with the default styles, download one of the existing Report Output Templates:
1. Go to Reports > Management > Report Output Templates.
2. Click on the Template Name of event_detections.ods.
Creating the Report Output Template

Creating the Report Output Template
CAUTION: To download the Report Output Template with the global style information, you must click
on the filename of the Report Output Template. Selecting the save icon ( ) will
download the Report Output Template without the global styles.
3. When the browser save dialog appears, save the file as "simple_ticket_list.ods"
4. Delete the "Debug" sheet.
5. Delete all the content and unmerge all cells in Sheet1.
6. Set the width of columns A - J to 1 inch.
7. Select Format > Styles and Formatting. The Styles and Formatting toolbar will be displayed, containing all
the global styles.
8. Select cells A1 - J20, then, in the Styles and Formatting toolbar, double click on "Default". The Report
Output Template will look like this:
9. Save the Report Output Template. The Report Output Template is now ready for the addition of content
specific to this report.
In the next step, we add static text, output directives, and variable substitution to the template. Output directives
specify where to insert data from the gluecode into the output template. To add the static text and output
directives to the example template:
1. Insert a header image. Merge cells A1 - H5, then insert an image and anchor the image to the merged
cell. In this example the ScienceLogic logo image is used:
106

107
2. Add static column headers. This example uses the column headers listed in the Overview section. Enter
the column headers in cells A7 - J7:
3. Add [if:], [else:] and [endif:] directives. These directives are conditional statements that are used to
evaluate inputs and then specify one of multiple outputs (based on the inputs). In this example, we will use
them to check if the gluecode has passed any tickets as output. If the gluecode has passed tickets, the report
will display a table with the ticket information. If the gluecode has not passed any tickets, , the report will
display the message "No tickets to display". These directives use the value of the boolean tickets to
determine if there are tickets to be listed. Enter "[if:tickets]" in cell A8, and "[else:tickets][endif:tickets]" in cell
A9:
4. Add a [bindrow:] directive. When the [bindrow:] directive is used with an array, the report engine will
duplicate the row the [bindrow:] appears on for each item in the array. In our example, the displayed table
will contain a row for each ticket in the array tickets. Enter "[bindrow:tickets]" after "[if:tickets]" in cell A8:
5. Add variable substitutions. Variables are inserted into Report Output Templates using curly braces. As
described in the gluecode section, suppose the gluecode returns a ticket with ticket id 0. The ticket data will
be stored in the following array structure:
[tickets] => Array
Creating the Report Output Template

Creating the Report Output Template
(
[0] => Array
(
[company] => System
[descr] => Example Ticket
[date_create] => 2010/01/01 8:00 AM
[user_create] => em7admin
[ticket_class] => Abuse
[status] => Working
[source] => Internal
[assign] => Monitoring
[assigned_to] => em7admin
)
)
In cell A8, {##} is entered after the [bindrow:tickets] directive. The first pound-sign indicates that the
value to be substituted comes from the array used by the previous bind directive, in this case the tickets
array in [bindrow:tickets]:
The second pound-sign indicates that our example should use the array key for this row. In our example,
the array keys are the ticketIDs, so the substituted value from the example array is 0.
For the other columns in our example, the substitution variable uses in the format {#.array_key}, where
array_key is the key that points to the value for that column. For example, {#.company} would substitute
the highlighted value from the example array into the column B8:
[company] => System
In row 8, enter substitution variables for the remaining array key names in cells B8 - J8:
6. Add a "Generated On" message at the end of the report. Enter "Generated On {date}" in cell A11. The
gluecode passes the variable called date, which contains the date on which the report was generated:
7. Add header information to display the options used to generate the report. The default reports
created by ScienceLogic use the upper right-hand two columns to display the options used to generate the
report. In our example, the variable orgspec is passed by the gluecode. orgspec specifies whether the user
selected the All Organizations checkbox in the Report Input Form. If the user selected the All
Organizations checkbox, orgspec is set to "All Orgs". If the user did not select the All Organizations
checkbox, orgspec is set to "Selected Orgs". orgspec can be substituted into the report in the same way
date was in the previous step. Enter "Selected" in cell I2 (eye-two), and "{orgspec}" in cell J2:
108

109
NOTE: The header image, table column, "Generated On" text and "Selected" text are not inside an
output directive or variable substitution. These elements will be displayed in the report as they
appear on the template.
Now that we have added the static text and output directives, we can apply styles to the template. To add styles to
the example template:
1. Select a cell or collection of cells to apply the style to.
2. In the Styles and Formatting toolbar, double click the style. Our example uses the following styles:
l EM7 Report Header/Footer. Applied to the header image, cells A1 - H5.
l EM7 Column Header. Applied to the column headings, cells A7 - J7.
l EM7 Data Text. Applied to the data rows and "No tickets to display" message, cells A8 - J9.
l EM7 Data Date/Time. Overrides the EM7 Data Text style for the Create Date, cell D8.
l EM7 Data Numeric. Overrides the EM7 Data Text style for the Ticket ID, cell A8.
l EM7 Report Footer. Applied to the "Generated On" message, cell A11.
l EM7 Report Header Label. Applied to the "Selected" text, cell I2.
l EM7 Report Header Value. Applied to the orgspec variable, cell J2.
The completed template looks like this:
The Report Output Template can now be uploaded to the user interface. To do this:
1. Go to Reports > Management > Report Output Templates.
2. Select the [Upload] button.
3. Select the [Browse] button. In the upload dialog, select simple_ticket_list.ods.
Creating the Report Output Template

Creating the Gluecode
4. Select the [Upload] button.
5. In the pop-up window that appears, select the [OK] button.
Creating the Gluecode
Report gluecode is written in PHP. For our example, the gluecode must do the following:
l Extract the values from the $input array passed from the Report Input Form.
l Process the inputs to determine whether the "All Organizations" checkbox was checked or unchecked and
then build an appropriate WHERE clause for the SQL statement.
l Query the database.
l Process any datetime strings to use the correct format.
l Pass the output to the output template. This example describes two versions of the gluecode: one version
that populates the $output array and another that uses $em7_report to pass the output.
Extracting Input Values
Report Input Forms pass an array called $input to the gluecode. The name you define for each input element in
the Report Input Form is used as a key in the $input array . Each key points to the input values for that element. In
this example, the $input array contains one key, orgs. The orgs key points to the input values from the
Organization Selector. The following line of code is used to extract the orgs array from the $input array:
extract($input, EXTR_PREFIX_ALL, 'in');
This extract statement will extract each entry in the $input array and store the entry in its own variable. Each
variable will be named $in_, followed by the array key for the array entry. In our example, one new variable is
created: $in_orgs.
Because the Organization Selector is a Custom Report Component, its input value is an array of values for each
of its child elements. The keys for each child element map to the child elements' name. For an Organization
Selector, the child elements are named "all_orgs" and "org". For more information on the names given to
components in default Custom Report Components, see the Input Forms section.
Another extract statement is included in the gluecode to extract the values of the child elements into variables,
prefixed by "selected_":
extract($in_orgs, EXTR_PREFIX_ALL, 'selected');
The Organization Selector has two constituent components, a checkbox (named "all_orgs") and a Multiple
Select (named "orgs"). After the extract statements, the gluecode will be working with the following variables:
l $selected_all_orgs. Contains the value passed by the "All Organizations" checkbox, either 0 (zero) or 1
(one).
l $selected_orgs. Contains the value passed by the "Organizations" Multiple Select List, a linear array of
organization IDs.
110
111
Processing Inputs and Building a WHERE Clause
You must write the gluecode so that it processes the input for the following three conditions:
l The All Organizations checkbox was checked. In this case, the SQL query should be run with a WHERE
clause that includes all organizations. The output variable orgspec should be set to "All".
l The All Organizations checkbox was unchecked, and organizations were selected. In this case, the
SQL query should be run with a WHERE clause that includes only the selected organizations. The output
variable orgspec should be set to "Selected Orgs".
l The All Organizations checkbox was unchecked, and no organizations were selected. In this case,
the SQL query should be skipped and the output variable orgspec should be set to "Selected Orgs".
To handle these three situations, the gluecode will set the following variables prior to querying the database:
l $where. Contains the WHERE clause for the query. $where is initially given a value that will return all
organizations:
$where = "1";
If organizations were selected, the gluecode will later append $where with an AND statement.
l $skip_query. A boolean that determines whether the database will be queried. $skip_query is initially
given a value for the most likely outcome, that the database will be queried:
$skip_query = FALSE;
l $output['orgspec']. The output variable orgspec, which will contain either "All" or "Selected Orgs". This is
set in the "if statements" described below.
The gluecode must include an "if statement" that evaluates the variable $selected_all_orgs to determine whether
the All Organizations checkbox was unchecked:
if ($selected_all_orgs) {
If $selected_all_orgs is TRUE, the initial values of $where (return all organizations) and $skip_query (FALSE,
meaning the database should be queried) are still correct. orgspec should then be set as follows for the version
of the gluecode that populates the $output array:
$output['orgspec'] = 'All';
} else {
Or as follows for the version of the gluecode that uses $em7_report to pass the output:
$em7_report->set_token_value('orgspec', 'All');
} else {
If $selected_all_orgs is FALSE, orgspec should be set as follows for the version of the gluecode that populates
the $output array:
$output['orgspec'] = 'Selected Orgs';
Or as follows for the version of the gluecode that uses $em7_report to pass the output:
Creating the Gluecode

Creating the Gluecode
$em7_report->set_token_value('orgspec', 'Selected Orgs');
NOTE: Remember that the orgspec variable specifies whether the user selected the All Organizations
checkbox in the Report Input Form. If the user selected the All Organizations checkbox, orgspec is
set to "All Orgs". If the user did not select the All Organizations checkbox, orgspec is set to "Selected
Orgs".
The gluecode must include another "if statement" to evaluate the variable $selected_all_orgs and determine if
the array of selected organizations is empty (meaning the user did not select any organizations):
if (empty($selected_orgs)) {
If the array $selected_all_orgs is empty, the database query should be skipped:
$skip_query = TRUE;
} else {
If the user selected one or more organizations and the array $selected_all_orgs is not empty, $where should be
appended with an appropriate AND statement:
$where .= ' AND o.roa_id IN ('.implode(',',$selected_orgs).')';
}
}
This statement selects all organizations where the organization ID matches an entry in the $selected_all_orgs
array.
Querying the Database
If the value of the variable $skip_query is TRUE, the gluecode will not query the database. The section of
gluecode that queries the database is contained in an "if statement" that evaluates the variable $skip_query:
if(!$skip_query) {
Ticket information is stored in the table master_biz.ticketing. Nine fields from this table will be used in the
query:
l tid. The ticket ID.
l roa_id. The organization ID.
l descr. The ticket description.
l date_create. The date of creation.
l status. The ticket status, stored as an integer between 0 and 3.
l user_create. The user ID of the user that created the ticket.
l class. The ID number of the ticket category.
l source. The ID number of the ticket source.
112
113
l qid. The queue ID of the ticket queue.
l assigned_to. The user ID of the user the ticket is assigned to.
Six of these values are stored as an integer. You must use a a LEFT JOIN statement on these values to obtain a
human-readable value:
l roa_id. Used to join to the "roa_id" field in the master_biz.organizations table. The "company" field in
master_biz.organizations stores the name of the organization.
l user_create. Used to join to the "uid" field in the master_access.accounts table. The "user" field in
master_access.accounts stores the username of the user.
l class. Used to join to the "id" field in the master.definitions_ticketing table. The "def" field in
master.definitions_ticketing stores the category name if the t_type field is 0.
l source. Used to join to the "id" field in the master.definitions_ticketing table. The "def" field in
master.definitions_ticketing stores the source name if the t_type field is 2.
l qid. Used to join to the "qid" field in the master_biz.ticket_queues table. The "name" field in master_
biz.ticket_queues stores the name of the ticket queue.
l assigned_to. Used to join to the "uid" field in the master_access.accounts table. The "user" field in
master_access.accounts stores the username of the user.
Two values require additional processing to be included in the query:
l date_create. Requires the UNIX_TIMESTAMP function to convert the timestamp into a UNIX timestamp.
Later, the gluecode requires a UNIX timestamp when the timestamps are processed.
l status. Requires a CASE statement to convert the integer into a human-readable value:
o
0 = Open
o
1 = Working
o
2 = Pending
o
3 = Resolved
The query is built and stored in the variable $sql, using the variable $where to add the WHERE clause:
$sql = "SELECT
t.tid, o.company, t.descr, UNIX_TIMESTAMP(t.date_create) date_create, CASE
t.status WHEN 0 THEN 'Open' WHEN 1 THEN 'Working' WHEN 2 THEN 'Pending'
ELSE 'Resolved' END status, acr.user user_create, dtcat.def ticket_class,
dtsrc.def source, tq.name assign, aas.user assigned_to FROM master_
biz.ticketing t
LEFT JOIN master_biz.organizations o ON (t.roa_id = o.roa_id)
LEFT JOIN master_access.accounts acr ON (t.user_create = acr.uid)
LEFT JOIN master.definitions_ticketing dtcat ON (dtcat.id = t.class AND
dtcat.t_type = 0)
LEFT JOIN master.definitions_ticketing dtsrc ON (dtsrc.id = t.source AND
dtsrc.t_type = 2)
LEFT JOIN master_biz.ticket_queues tq ON (tq.qid = t.qid)
LEFT JOIN master_access.accounts aas ON (t.assigned_to = aas.uid)
WHERE " . $where . "
ORDER BY t.date_create ";
Creating the Gluecode
Creating the Gluecode
The query uses an ORDER BY statement using the date the ticket was created. This is the order in which the tickets
will appear in the report.
The variable that contains the query ($sql) is then used to query the database:
$tickets = $db->autofetch_all_assoc($sql);
$db is an instance of a class that is always passed to the gluecode. The $db class provides several functions that
query the database and return the results as variables. The return values of the $db class functions are typically
stored in arrays; different functions will return different array structures. For more information on the $db class
functions, see the section on Database Methods.
Our example uses the autofetch_all_assoc function. This function returns the results of an SQL query as an
associative array. Each key value in the returned array maps to the value of the first column of each row returned
from the SQL statement. The key value for each row points to another associative array that contains the
remaining values from the row. In this example, the keys of the returned array will map to the ticket ID . Each
ticket ID key will point to an array containing the rest of the values returned for that row, with the keys as the field
names. The following example shows the array structure if one ticket, with ticket id = 0, is returned:
[tickets] => Array
(
[0] => Array
(
[company] => System
[descr] => Example Ticket
[date_create] => 123456789
[user_create] => em7admin
[ticket_class] => Abuse
[status] => Working
[source] => Internal
[assign] => Monitoring
[assigned_to] => em7admin
)
)
Populating the $output Array
This section is applicable only to the version of the gluecode that populates the $output array.
The returned values for the date_create field are in UNIX timestamp format. The gluecode uses the od_datetime
function to convert each of these UNIX timestamps into a format readable by the Report Output Template:
foreach ($tickets as &$ticket) {
$ticket['date_create'] = od_datetime($ticket['date_create']);
}
The gluecode has now correctly formatted the values in the $tickets array. The next step is to copy the $tickets
array into the $output array, which will be passed to the Report Output Template:
$output['tickets'] = $tickets;
Using $em7_report to Output Results
This section is applicable only to the version of the gluecode that uses $em7_report to pass the output.
114

115
The output template includes the directive [bindrow:tickets] to repeat a row for each ticket in the output. The
gluecode uses the get_token method to create a token object ($ticket_rows) that references this directive:
$ticket_rows = $em7_report->get_token('tickets');
A foreach loop is used to iterate through the list of tickets returned by the database query:
foreach ($tickets as $ticket_id=> &$ticket) {
The returned values for the date_create field are in UNIX timestamp format. The gluecode uses the od_datetime
function to convert each of these UNIX timestamps into a format readable by the Report Output Template:
$ticket['date_create'] = od_datetime($ticket['date_create']);
For each ticket, the $ticket_rows token object is used to create a new row. The ticket ID (the key value form the
foreach loop) is supplied as the key. These keys will populate the {##} directive in the output:
$ticket_row = $ticket_rows->new_row($ticket_id);
Values are supplied to the row using the current value from the $tickets array and the row is closed:
$ticket_row->set_value($ticket);
$ticket_row->close_row();
The foreach loop is then closed:
}
Populating the Date
The "if statement" that contains the gluecode that queries the database is closed:
}
The Report Output Template requires the date variable to be included. orgspec should be set as follows for the
version of the gluecode that populates the $output array:
$output['date'] = date("Y-m-d");
Or as follows for the version of the gluecode that uses $em7_report to pass the output:
$em7_report->set_token_value('date', date("Y-m-d"));
Creating the Report Template
To generate the example report, we must create a Report Template. A Report Template allows you to define all
the parts of a report. A Report Template specifies identifying information about a report, and the Report Input
Form, Report Output Template and gluecode that will be used to generate instances of a report.
To create the Report Template for this example:
Creating the Report Template

Creating the Report Template
1. On the Reports page ( ), expand the Management section and select Report Manager (Reports >
Management > Report Manager). The Report Management page appears.
2. Click the [Create] button. The Report Template Editor page appears:
3. Complete the following fields:
l Template Name. The name of the report, without spaces. This example is called "Simple_Ticket_
List".
l Version. The version number for the report. This example uses the default value, "1.0".
l Author. The person who authored the report. This example uses "ScienceLogic Documentation
Team".
l Delivery Method. This option allows you to limit the options that are available when a user
schedules this report. Select the methods by which scheduled instances of this report can be
delivered. This example uses the default values.
l Input Form. The Report Input Form that will be used to generate the Report. This example uses
Simple Ticket List.
l Output Template. The Report Output Template that will be used to generate the Report. This
example uses simple_ticket_list.ods.
l Description. A description of the report. This example leaves this field empty.
l Category. Select one or more categories for the report. Categories are used to arrange the list of
reports in the left NavBar and in drop-down lists that display reports. This example assigns the
"Ticketing" category.
116

117
l Key Words. A comma-separated list of key words that describe the report. This example leaves this
field empty.
l Report Count Query. This query populates the RowCount Estimate field for the report, and this
query executes in the background with each input filter change made by the report user. The Row
Count Estimate field informs users before they generate reports that are so large that SL1 cannot
create them successfully. The query can include variables for the fields that a user selects in the report
(Input Forms). The variables can be scalars or lists. As the user selects or de-selects Inputs, such as
selecting Devices, then de-selecting Devices and selecting Assets instead, the query is re-run, and a
new value appears in the RowCount Estimate field.
l Name. If the report requires multiple possible queries based on the inputs that the user selects, type a
name for each query, such as "devices" and "assets". Based on the input selected by the user, one of
the two queries will be used to get the row count estimate. If the report requires only a single query,
type "default" in this field. Click the [Add Row] button to add additional queries. Do not use double
quotes (") or the back slash character (\) in this field.
l Query. Add an SQL query that returns the total possible number of data rows in the report using the
inputs selected buy the user. The query includes variables for fields that a user selects from the Input
Form. The query can include variables for scalar values (single values) and variables for list values
(multiple values). For more information about the SQL query for this field, see Creating Queries for
the Row Count Estimate Field. Do not use double quotes (") or the back slash character (\) in this
field.
NOTE: Thegoal of the SQL query in the Query field is to provide an estimate of the returned
rows, but the query should be as lightweight as possible. Do not re-use the SQL query
that populates the report.
l [Add Row]. Click this button to add another row containing the name and query code for an
additional query for this template. You can add up to eight queries. Click the red cancel icon ( ) to
remove a query that you previously added.
NOTE: To disable the RowCount Estimate feature, de-select the Report Size Estimation
option on the Behavior Settings page (System>Settings >Behavior). This feature is
enabled by default. If you disable this feature, SL1 retains the queries you created in the
Query field, but SL1 will not run those queries when you create reports.
l Query/Template Binding Code. The gluecode that will be used to generate the Report. This
example uses the gluecode listed in the Full Code Listing for the $output Version section or the
Full Code Listing for the $em7_report Version section.
4. Click the [Save] button. The report is now available under the Run Report > Ticketing section in the left
NavBar, and you can include the report in a Report Job on the Report Jobs page.
Full Code Listing for the $output Version
extract($input, EXTR_PREFIX_ALL, 'in');
Full Code Listing for the $output Version

Full Code Listing for the $em7_report Version
extract($in_orgs, EXTR_PREFIX_ALL, 'selected');
$where = "1";
$skip_query = FALSE;
if ($selected_all_orgs) {
$output['orgspec'] = 'All';
} else {
$output['orgspec'] = 'Selected Orgs';
if (empty($selected_orgs)) {
$skip_query = TRUE;
} else {
$where .= ' AND o.roa_id IN ('.implode(',',$selected_orgs).')';
}
}
if(!$skip_query) {
$sql = "SELECT t.tid, o.company, t.descr, UNIX_TIMESTAMP(t.date_create) date_
create,
CASE t.status WHEN 0 THEN 'Open' WHEN 1 THEN 'Working' WHEN 2 THEN 'Pending'
ELSE 'Resolved' END
status, acr.user user_create, dtcat.def ticket_class, dtsrc.def source, tq.name
assign, aas.user assigned_to
FROM master_biz.ticketing t
LEFT JOIN master_biz.organizations o ON (t.roa_id = o.roa_id)
LEFT JOIN master_access.accounts acr ON (t.user_create = acr.uid)
LEFT JOIN master.definitions_ticketing dtcat ON (dtcat.id = t.class AND dtcat.t_
type = 0)
LEFT JOIN master.definitions_ticketing dtsrc ON (dtsrc.id = t.source AND
dtsrc.t_type = 2)
LEFT JOIN master_biz.ticket_queues tq ON (tq.qid = t.qid)
LEFT JOIN master_access.accounts aas ON (t.assigned_to = aas.uid)
WHERE " . $where . "
ORDER BY t.date_create ";
$tickets = $db->autofetch_all_assoc($sql);
foreach ($tickets as &$ticket) {
$ticket['date_create'] = od_datetime($ticket['date_create']);
}
$output['tickets'] = $tickets;
}
$em7_report->set_token_value('date', date("Y-m-d"));
Full Code Listing for the $em7_report Version
extract($input, EXTR_PREFIX_ALL, 'in');
extract($in_orgs, EXTR_PREFIX_ALL, 'selected');
$where = "1";
$skip_query = FALSE;
if ($selected_all_orgs) {
$em7_report->set_token_value('orgspec', 'All');
} else {
$em7_report->set_token_value('orgspec', 'Selected Orgs');
if (empty($selected_orgs)) {
$skip_query = TRUE;
118
119
} else {
$where .= ' AND o.roa_id IN ('.implode(',',$selected_orgs).')';
}
}
if(!$skip_query) {
$sql = "SELECT t.tid, o.company, t.descr, UNIX_TIMESTAMP(t.date_create) date_
create,
CASE t.status WHEN 0 THEN 'Open' WHEN 1 THEN 'Working' WHEN 2 THEN 'Pending'
ELSE 'Resolved' END
status, acr.user user_create, dtcat.def ticket_class, dtsrc.def source, tq.name
assign, aas.user assigned_to
FROM master_biz.ticketing t
LEFT JOIN master_biz.organizations o ON (t.roa_id = o.roa_id)
LEFT JOIN master_access.accounts acr ON (t.user_create = acr.uid)
LEFT JOIN master.definitions_ticketing dtcat ON (dtcat.id = t.class AND dtcat.t_
type = 0)
LEFT JOIN master.definitions_ticketing dtsrc ON (dtsrc.id = t.source AND
dtsrc.t_type = 2)
LEFT JOIN master_biz.ticket_queues tq ON (tq.qid = t.qid)
LEFT JOIN master_access.accounts aas ON (t.assigned_to = aas.uid)
WHERE " . $where . "
ORDER BY t.date_create ";
$tickets = $db->autofetch_all_assoc($sql);
$ticket_rows = $em7_report->get_token('tickets');
foreach ($tickets as $ticket_id=>&$ticket) {
$ticket['date_create'] = od_datetime($ticket['date_create']);
$ticket_row = $ticket_rows->new_row($ticket_id);
$ticket_row->set_value($ticket);
$ticket_row->close_row();
}
}
$em7_report->set_token_value('date', date("Y-m-d"));
Full Code Listing for the $em7_report Version
© 2003 - 2021, ScienceLogic, Inc.
All rights reserved.
LIMITATION OF LIABILITY AND GENERAL DISCLAIMER
ALL INFORMATION AVAILABLE IN THIS GUIDE IS PROVIDED "AS IS," WITHOUT WARRANTY OF ANY
KIND, EITHER EXPRESS OR IMPLIED. SCIENCELOGIC™ AND ITS SUPPLIERS DISCLAIM ALL WARRANTIES,
EXPRESS OR IMPLIED, INCLUDING, BUT NOT LIMITED TO, THE IMPLIED WARRANTIES OF
MERCHANTABILITY, FITNESS FOR A PARTICULAR PURPOSE OR NON-INFRINGEMENT.
Although ScienceLogic™ has attempted to provide accurate information on this Site, information on this Site
may contain inadvertent technical inaccuracies or typographical errors, and ScienceLogic™ assumes no
responsibility for the accuracy of the information. Information may be changed or updated without notice.
ScienceLogic™ may also make improvements and / or changes in the products or services described in this
Site at any time without notice.
Copyrights and Trademarks
ScienceLogic, the ScienceLogic logo, and EM7 are trademarks of ScienceLogic, Inc. in the United States,
other countries, or both.
Below is a list of trademarks and service marks that should be credited to ScienceLogic, Inc.The ® and ™
symbols reflect the trademark registration status in the U.S. Patent and Trademark Office and may not be
appropriate for materials to be distributed outside the United States.
l ScienceLogic™
l EM7™ and em7™
l Simplify IT™
l Dynamic Application™
l Relational Infrastructure Management™
The absence of a product or service name, slogan or logo from this list does not constitute a waiver of
ScienceLogic’s trademark or other intellectual property rights concerning that name, slogan, or logo.
Please note that laws concerning use of trademarks or product names vary by country. Always consult a
local attorney for additional guidance.
Other
If any provision of this agreement shall be unlawful, void, or for any reason unenforceable, then that
provision shall be deemed severable from this agreement and shall not affect the validity and enforceability
of any remaining provisions. This is the entire agreement between the parties relating to the matters
contained herein.
In the U.S. and other jurisdictions, trademark owners have a duty to police the use of their marks.
Therefore, if you become aware of any improper use of ScienceLogic Trademarks, including infringement or
counterfeiting by third parties, report them to Science Logic’s legal department immediately.Report as
much detail as possible about the misuse, including the name of the party, contact information, and copies

800-SCI-LOGIC (1-800-724-5644)
International: +1-703-354-1010
