
TERRANOVA INTERACTIVE REPORTS
Sample Reports

2
TERRANOVA SCORE TYPES
Reports available at all levels:
• Student
• Class
• School
• District/Diocese
Scores include:
• Norm-Referenced Data (NP, LP, Quartiles, NCE, NP of the Mean NCE, GE, Stanine)
• Growth Data (Longitudinal Scale Score, NCE, Stanine, Cohort Growth)
• Criterion-Referenced Data (Number Correct, Student and National OPI-Objec-
tive Performance Index; Mastery Levels-Low, Moderate, High; Moderate Mastery
Range by Objective, DIFF scores, Condence Bands, Lexile scores)
• Prociency/Performance Levels (Starting Out/Step 1, Progressing, Nearing
Prociency, Procient, Advanced)
• InView Cognitive Abilities data (CSI, Verbal, Non-Verbal, NPA, NPG, Scale Scores,
and if combination testing-Anticipated Achievement

3
DRC’s Interactive Reporting System allows you the ability to view pre-made reports
or customize your data in seconds with just a few clicks. You can tailor access based
on permissions assigned at the district, school or class level and create custom student
groups for specialized reporting.
Online Training Modules
Step-by-Step User Guide
Reports Video
Download reports
and charts as a PDF,
CSV, PNG or XLSX
• Add users in your building
• Customize Access
• Create student groups for
specialized reporting

4
TERRANOVA:
SUMMARY OF INTERACTIVE REPORTS
PAGE 1
Category: Summary Results
Available
Reports
Description Available Scores/Data Can Filter By Report Format(s)
Download
Options
Subtest
Summary
Displays a
summary of
results by
subtest,
including curve
equivalent
scores and
national and
local quartile
scores.
•
National Percentile of
Mean NCE
• Mean NCE
• % in National Quartile
• % in Local Quartile
• Number Tested
• NTA
• Mean Scale Score
• GME
•
Exam
• Summary or
Disaggregate
• District
• Assessment Date
• Grade
• School
• Class
• Subtest
•
Bar Chart: National Percentile
of Mean NCE
• Bar Chart: Mean NCE
• Bar Chart: Percent in National
Quartile
• Bar Chart: Percent in Local
Quartile
• Table: Summary Report of
Subtests, including links to:
o Subtest Roster
o Percent National Quartile
Pie Chart
o Percent Local Quartile Pie
Chart
Entire Report:
PDF
Table: Summary
Report of
Subtests: CSV,
XLSX, or PDF
Objective
Summary
Displays results
by subtest and
objective.
•
Percent in Each
Mastery Category
(High/Moderate/Low)
• Mean Objectives
Performance Index
• Number Tested
•
Exam
• Summary or
Disaggregate
• District
• Assessment Date
• Grade Form/Level
• Subtest
• School
• Class
• Objective
•
Bar Chart: Percent in Each
Mastery Category
• Bar Chart: Mean Objectives
Performance Index
• Table: Summary Report of
Objectives, including links to:
o Objective Roster
o Mastery Pie Chart
Entire Report:
PDF
Table: Summary
Report of
Objectives: CSV,
XLSX, or PDF
Cohort
Comparison
Compare results
of one or more
cohorts/groups
over time.
•
Mean NCE
• Diff Mean NCE
• Mean Scale Score
• Diff Mean Scale Score
• Number Tested
•
Exam
• District
• School
• Cohort
• Class
• Subtest
•
Bar Chart: Mean NCE
• Line Chart: Mean NCE
• Bar Chart: Diff Mean NCE
• Line Chart: Diff Mean NCE
• Bar Chart: Mean Scale Score
• Line Chart: Mean Scale Score
• Bar Chart: Diff Mean SS
• Line Chart: Diff Mean SS
• Table: Cohort Comparison
Report
Entire Report:
PDF
Table: Cohort
Comparison
Report: CSV,
XLSX, or PDF
Item
Summary
Displays
summary of
item
performance
alongside
applicable
standards to
support
instructional
decision
making.
•
Item Number
• Number Tested
• % Correct
• Points Possible
• Student Response %
(A/B/C/D/None)
•
Exam
• District
• School
• Class
• Assessment Date
• Grade
• Form/Level
• Subtest
• Objective
•
Item Summary Table, including
links to:
o School Subtest Roster (only
with “School” View filter)
o School Objective Roster
(only with “School” View
filter)
o Class Subtest Roster (only
with “Class” View filter)
o Class Objective Roster (Only
with “Class” View filter)
CSV, XLSX, or
PDF
*This is a comprehensive list of the reports available in Interactive Reporting for TerraNova. Please note that not all of these reports are
available to every user. The reports available to each user depend on the user’s role and assigned permissions.

5
TERRANOVA:
SUMMARY OF INTERACTIVE REPORTS
PAGE 2
Category: Student Results
Available
Reports
Description Available Scores/Data Can Filter By
Report
Format(s)
Download
Options
Student
Roster/
Class Roster
Displays student-
level scores,
including default
scores, objective
scores, national
and local scores,
number correct
and performance
scores.
Default Scores Filter:
• Scale Score
• Normal Curve Equivalent
• National Percentile
Objective Scores Filter:
• Objectives Performance Index
• Mastery Category
Special Coding Roster:
• Codes K/L/M/N/O/P
• Reading SS, NCE, NP
• Language SS, NCE, NP
• Mathematics SS, NCE, NP
• Total Score SS
• Total Score NCE
• Total Score NP
• Science SS, NCE, NP
• Social Studies SS, NCE, NP
• Cognitive Skills Index
National and Local Scores Filter:
• National Percentile
• National Stanine
• Local Percentile
• Local Stanine
Number Correct & Performance Level Filter:
• Number Correct
• Performance Level (Descriptor)
• Performance Level (Number)
• Grade Equivalent
• Objectives Mastery Score
All Scores Filter:
• Number Correct
• Scale Score
• Normal Curve Equivalent
• Performance Level (Descriptor)
• National Percentile
• National Stanine
• Grade Equivalent
• Objectives Mastery Score
• Local Percentile
• Local Stanine
• Lexile
•
Exam
• District
• Assessment Date
• Score
• School
• Grade
• Form/Level
• Student Name
• Subtest
• Objective
• Class (only with “Class
Roster” report)
Table (Roster)
CSV, XLSX, or
PDF

6
TERRANOVA:
SUMMARY OF INTERACTIVE REPORTS
PAGE 3
Category: Student Results (continued)
Available
Reports
Description Available Scores/Data Can Filter By Report Format(s)
Download
Options
Longitudinal
Roster
Student results over
time; shows
difference in scale
score with each test
event.
•
Scale Score
• Diff Scale Score
• Normal Curve Equivalent
• Diff Normal Curve
Equivalent
• National Percentile
•
Exam
• District
• School
• Grade
• Form/Level
• Student Name
• Subtest
• Assessment Date
Table (Longitudinal Roster)
CSV, XLSX,
or PDF
Item Roster/
Class Item
Roster
Displays points
possible and points
earned across
various subtests and
objectives.
•
Points Possible per Item
• Points Earned per Item
•
Exam
• District
• School
• Assessment Date
• Grade
• Subtest
• Form/Level
• Objective
• Student
• Item Number
• Class (only with “Class
Item Roster” report)
Table (Item Roster)
PDF
Student
Dashboard
Displays individual
student results with
the ability to drill
down to objectives.
• Scale Scores
• Normal Curve Equivalent
• National Percentile
• Objectives Performance
Index (OPI)
• Mastery Category
• Exam
• District
• School
• Student
• Subtest
• Objective
• Grade
• Assessment Date
• Form/Level
• Dashboard: Scale Scores
(most recent test)
• Line Chart: Student
History-Scale Score
• Bar Chart: Student History-
Normal Curve Equivalent
and National Percentile
• Table: Drill to Objectives,
with links to:
o Line Chart: Objectives
Performance Index
o Bar Chart: Objectives
Performance Index
o Student Dashboard
Table
• Student Dashboard Table
Entire
Report: PDF
Tables: CSV,
XLSX, or
PDF

7
TERRANOVA:
SUMMARY OF INTERACTIVE REPORTS
PAGE 4
Category: Batch Download
Available
Reports
Description Available Scores/Data Can Filter By
Download
Options
Individual
Profile
Report
Presents information
about each student's
performance on
objectives, as well as
norm-reference scores
and national percentile
scales.
•
Student OPI
• National OPI
• Moderate Mastery Range
• Scale Scores
• Grade Equivalent
• Local Percentile/Stanine
• Number Correct
• Normal Curve Equivalent
• National Percentile/Stanine
• National Percentile Range
•
Exam
• District
• Assessment Date
• School
• Grade
• Classes
• Student
PDF
Assessment
Summary
Report –
School
Presents summary
information about each
group’s performance in
the school.
• Score Distribution (National Percentile Scale
and Normal Curve Equivalent Scale)
• Mean Scores & Standard Deviations
• Local Percentiles/Quartiles
• National Quarters
• Performance on Objectives
• Percent of Students at Each Proficiency Level
• Exam
• District
• Assessment Date
• School
PDF
Assessment
Summary
Report –
District
Presents summary
information about each
group’s performance in
the district.
•
Score Distribution (National Percentile Scale
and Normal Curve Equivalent Scale)
• Mean Scores & Standard Deviations
• Local Percentiles/Quartiles
• National Quarters
• Performance on Objectives
• Percent of Students at Each Proficiency Level
•
Exam
• District
• Assessment Date
PDF
Group List
Report
Provides preliminary
test results for individual
students in a group.
•
National Percentile and National Stanine
• Normal Curve Equivalent
• Scale Score
• Local Percentile and Local Stanine
• Grade Equivalent
• Number Correct
•
Exam
• District
• Assessment Date
• School
• Class
PDF
Student
Roster
Export
Provides a
comprehensive student-
level data file including
demographics, test
information (test forms,
accommodations, etc.),
and score details. Each
data field can be
individually filtered.
• Subtest Scores:
o Grade Equivalent, Lexile, Local Percentile,
Local Stanine, National Percentile,
National Stanine, Normal Curve Equivalent
(NCE), Number Correct, Objectives
Mastery Score, Performance Level, Scale
Score
• Objective Scores:
o Mastery Category, Mastery Category
Value, Objectives Performance Index
• Exam
• District
• Assessment Date
• School
• Grade
• Class
• Subtest
• Student Data/Special
Codes
• Test Data
• Subtest Scores
• Objective Scores
CSV

8
REPORTS MENU
BATCH DOWNLOAD
• Individual Prole Report
•
Assessment Summary Report
(School and District/Diocese)
• Group List Report
•
Student Roster Export (build
your own custom export or
worksheet reports)
9
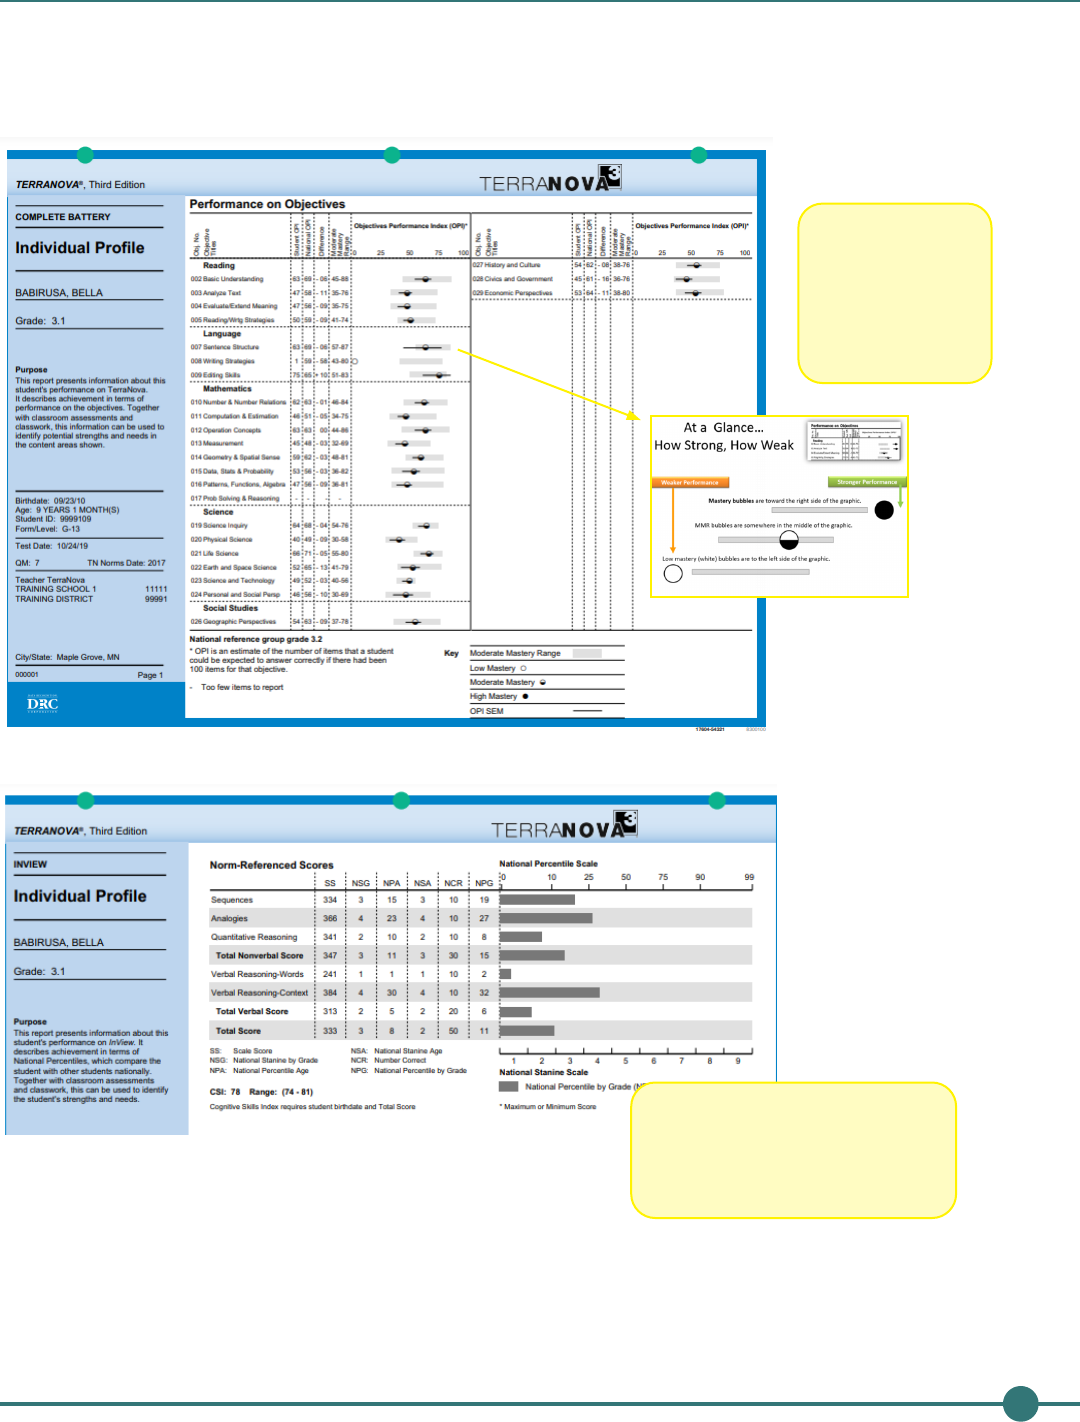
INDIVIDUAL PROFILE REPORT
Student and
National OPI,
DIFF analysis,
Mastery Range
If testing with InView, you also
receive cognitive abilities data

10
ASSESSMENT SUMMARY (BY DISTRICT/DIOCESE AND SCHOOL)
Distribution Analysis
Norm-Reference Data and Quartiles
Criterion-Reference Data
Prociency Analysis
Obtained vs. Anticipated Achievement (Achievement and Cognitive Analysis)

11
STUDENT ROSTER EXPORT:
• Build custom export les for your SIS system
• Create custom scholarship and special code reports
• Customize all data points needed
Build custom export le or
worksheet reports by choosing:
• Grades
• Test Date and Organization
• Subtests
• Student demographics
• Score Types
Headers can be ltered, sorted or
removed to customize your view

12
INTERACTIVE STUDENT RESULTS
STUDENT ROSTER (customize by Score Type)
STUDENT ROSTER REPORT
Use organization headers to
customize views using multiple lters

13
STUDENT DASHBOARD
• All test data located in one report by student, including longitudinal data
• Data is interactive and may be customized in a few clicks
• All graphs and charts may be downloaded
• Perfect for parent/teacher conferences or student goal-setting discussions
Track scale score growth
Combine cognitive
and achievement
data for the whole
picture
Track student
mastery over each
administration

14
ITEM ANALYSIS
• Available by Student, Class, School and District/Diocese
Drills to objective/
strand and subskill
Distractor Analysis & Percent
Correct by Group

15
SUMMARY RESULTS
Compare mastery
performance across
district/diocese and
schools
Quickly identify strengths and areas of concern

16
OBJECTIVE SUMMARY
Use lters to choose subjects and
building/district comparisons
Compare norm-referenced data
across district/diocese, school
and classes

17
Create bar charts that
are interactive and can be
customized when clicking on
category headings
View all data in worksheet format
• Sort, Filter and remove columns
• Create pie charts
• Export Results
• Drill down to student data using hyperlinks
Disaggregate data by SSP/IEP, 504, Race,
Ethnicity, Home Language, Gender, and
additional special codes

18
COMBINATION SUMMARY
Pinpoint signicant differences
in Actual vs. Anticipated
Achievement
Compare cognitive abilities at the
district/diocese and each school
Filter, sort and customize your data by rank, alphabetical order, score type or by sub category lters

19
COHORT COMPARISON
Track longitudinal growth by
grade or cohort growth
across each administration
Show all grades and subjects
or customize to show one
subtest at a time
Calculate gain or
areas of decline
by subtest or
grade level

20
QUICK LINK RESOURCES
Access helpful resources while
analyzing your data:
• Home Activities
• Lesson Plans
• Practice Worksheets
• Score Interpretation
• Home Activities to share
with parents
• Prociency Descriptors
• Prociency cutpoints
• Research articles
