
Automotive
Aftermarket
Market Update
Q2 2023

Houlihan Lokey is a leading
global investment bank with
expertise in mergers and
acquisitions, capital markets,
financial restructuring, and
financial and valuation
advisory.
Our firm is the trusted advisor
to more top decision-makers
than any other independent
global investment bank.
We invite you to learn more
about how our advisors can
serve your needs:
ABOUT OUR FIRM
2
Learn More About
Corporate Finance
Learn More About
Financial Restructuring
Learn More About
Financial and Valuation Advisory
Learn More About
Our Industry Coverage
Key Facts and Figures
Our Ranking by Service
Houlihan Lokey Is a Global Firm
No. 1 Global M&A Advisor for
Transactions Under $1 Billion
Leading Capital Markets Advisor
No. 1 Global M&A Fairness Opinion
Advisor Over the Past 25 Years
1,000+ Annual Valuation Engagements
No. 1 Global Restructuring Advisor
1,500+ Transactions Completed Valued
at More Than $3.0 Trillion Collectively
Corporate Finance
Financial Restructuring
Financial and Valuation Advisory
Americas
Atlanta
Baltimore
Boston
Chicago
Dallas
Houston
Los Angeles
Miami
Minneapolis
New York
San Francisco
São Paulo
Washington,
D.C.
Europe and Middle East
Amsterdam
Antwerp
Dubai
Frankfurt
London
Madrid
Manchester
Milan
Munich
Paris
Stockholm
Tel Aviv
Zurich
Asia-Pacific
Beijing
Fukuoka
Gurugram
Hong Kong
SAR
Mumbai
Nagoya
Shanghai
Singapore
Sydney
Tokyo
2,000+
CLIENTS SERVED
ANNUALLY
326
MANAGING
DIRECTORS
(1,2)
~2,000
TOTAL FINANCIAL
PROFESSIONALS
36
LOCATIONS
WORLDWIDE
(1)
$1.8B
REVENUE
(4)
$6.5B
MARKET
CAPITALIZATION
(3)
26
Senior officers dedicated to
the sponsor community in the
Americas and Europe
Fully Integrated Financial Sponsors Coverage
1,000+
Sponsors covered, providing
market insights and
knowledge of buyer behavior
700+
Companies sold to financial
sponsors over the past five years
(1) As of June 30, 2023. (2) Excludes corporate MDs. (3) As of July 2023. (4) LTM ended June 30, 2023.
2022 Global Distressed Debt & Bankruptcy
Restructuring Rankings
Advisor
Deals
1
Houlihan Lokey
58
2
PJT Partners Inc
30
3
Lazard
29
4
Rothschild & Co
25
5
Moelis & Co
21
Source: Refinitiv
.
1998 to 2022 Global M&A Fairness
Advisory Rankings
Advisor
Deals
1
Houlihan
Lokey
1,232
2
JP Morgan
1,030
3
Duff & Phelps, A Kroll Business
938
4
Morgan Stanley
725
5
BofA
Securities Inc
710
Source: Refinitiv. Announced or completed transactions.
2022 M&A Advisory Rankings
Global Transactions Under $1 Billion
Advisor
Deals
1
Houlihan
Lokey
381
2
Rothschild & Co
369
3
JP Morgan
217
4
Lazard
206
5
Goldman Sachs & Co
203
Source: Refinitiv. Excludes accounting firms and brokers.
Houlihan Lokey’s Industrials
Group has earned a reputation
for providing superior service
and achieving outstanding
results in M&A advisory,
capital raising, restructuring,
and financial and valuation
advisory services.
According to data provided by
Refinitiv, our Industrials Group
was once again ranked as the
No. 1 M&A advisor for all U.S.
industrials transactions in
2022.*
*Excludes accounting firms and brokers.
ABOUT OUR INDUSTRIALS GROUP
3
Aerospace Advanced Manufacturing
and Engineered Products
Automotive, Truck, and
Automotive Technologies
Building Products Chemicals
Key Facts and Figures
Industry Sector Coverage
We cover a broad array of sectors, with bankers dedicated to each of our primary coverage areas.
160+
Dedicated Industrials Group bankers
75
Completed Industrials Group M&A/
private placement transactions in CY22
~$2B
In disclosed financing deals in CY22
Featured Industrials Group Transactions
Learn More About Our
Industrials Group Industry Coverage
2022 M&A Advisory Rankings
All U.S. Industrials Transactions
Advisor
Deals
1
Houlihan Lokey
35
2
Lincoln International
33
3
Goldman Sachs & Co
26
3
Stout
26
5
Benchmark International
25
5
Jefferies LLC
25
Source: Refinitiv. Excludes accounting firms and brokers.
Decarbonization
Products and Services
Defense Energy Services and
Technology
Government Services
and Technology
Industrial Technology
Metals and Engineered
Materials
Packaging, Plastics, and
Paper
Security and Safety
Solutions
Specialty Distribution
a portfolio company of
has been acquired by
Sellside Advisor
has been acquired by
Sellside Advisor
a portfolio company of
has been acquired by
Sellside Advisor
has sold a majority interest in the
company to
Sellside Advisor
has acquired
a portfolio company of
Buyside Advisor
has been acquired by
Sellside Advisor
has been acquired by
Toyota Industries
Corporation
Sellside Advisor
has been acquired by
a portfolio company of
Sellside Advisor
Featured Transactions
Contact Us
Learn More About Us
Request a Meeting
Please reach out to us to schedule a call to discuss
this quarter’s market update or to explore how we can
serve your business needs.
Sector-Specific Expertise
The automotive aftermarket sector, which operates within Houlihan Lokey’s
Industrials Group, has earned a reputation for providing superior service and
achieving outstanding results in M&A advisory, capital raising, restructuring, and
financial and valuation advisory services.
Our transaction quality and client work benefit from our company culture, where
senior financial professionals are highly engaged in the execution of client projects,
and from our experience as leaders in the market for more than a decade, which
has given our professionals valuable exposure to a variety of situations and
challenges.
Car Wash
Collision Repair and Other
Auto Services
Commercial Vehicle Upfitting
Hard Parts Distribution
Lubricants, Coatings, and
Cleaning Chemicals
Mechanical Repair
Replacement Parts
Off-Road Enthusiast Parts
Performance Parts
Quick Lube
Retail and DTC E-Commerce
Software and Shop
Management
Tombstones included herein represent transactions closed from 2008 forward.
4
AUTOMOTIVE AFTERMARKET TEAM
Leadership
Christian Lunny
Managing Director
+61 2 9662 9001
Hisashi Yoshimura
Managing Director
Hisashi.Yoshimura@HL.com
+81 80 4368 3472
Nicolas Zintl
Managing Director
+49 (0) 69 256 246 121
Cory Hebenstreit
Director
+1 312.456.4704
a portfolio company of
has been acquired by
Sellside Co-Advisor
$40,000,000 HoldCo PIK Notes
Acquisition Financing
Exclusive Placement Agent
a portfolio company of
has been acquired by
a subsidiary of
Sellside Advisor
has been acquired by
Sellside & Financing Advisor
has been acquired by
a subsidiary of
Sellside Advisor
has successfully completed a $1.4
billion recapitalization, amending
and extending $860 million of 1L
credit facilities, equitizing $375mm
of unsecured notes and raising
$160 million of new money
Unsecured Noteholder Advisor

While Houlihan Lokey covers a broad range of automotive aftermarket subsectors, the Q2
2023 market update will focus on the enthusiast subsector, which serves consumers
upgrading the look or performance of their vehicles. The M&A market for enthusiast
businesses seems to have been rather constrained over the past year, and Houlihan Lokey
sees signs of optimism in 2H 2023 and beyond.
Despite SEMA estimating the specialty-equipment market growing at approximately 4% per
year, that growth has been inconsistent largely due to pandemic-related trends. Demand
accelerated in 2021, resulting in challenging year-over-year comparisons in 2022
exacerbated by supply chain challenges limiting product availability.
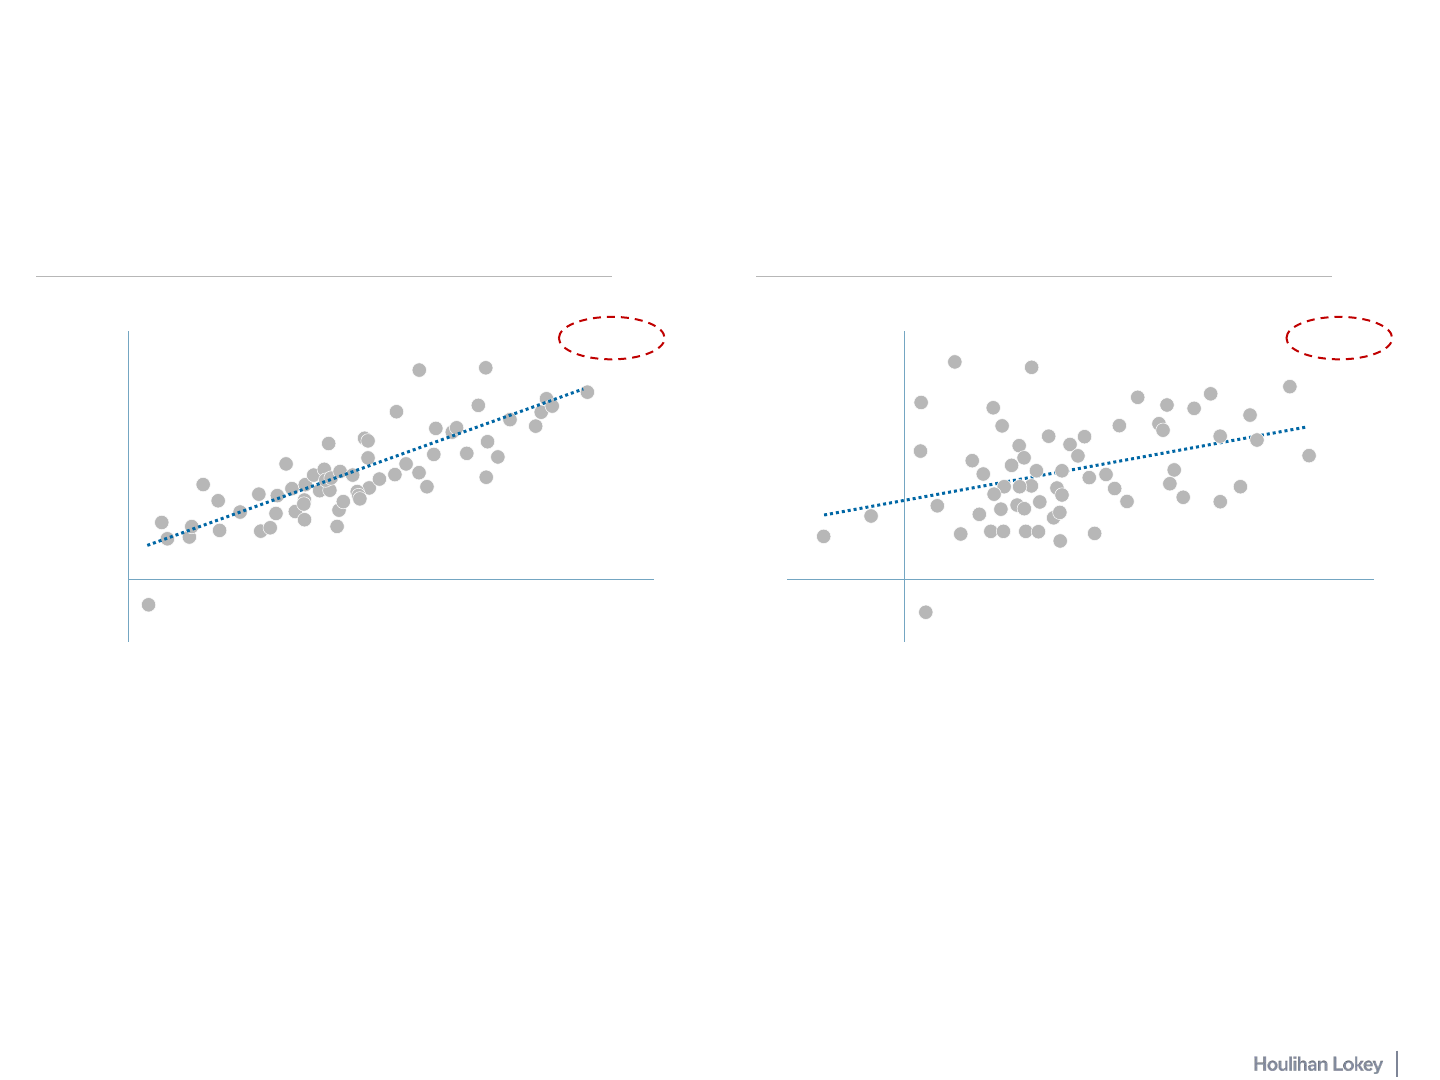
Houlihan Lokey analysis indicates that selected market participants’ demand concerns due
to rising interest rates are likely unfounded. Personal spending has historically been much
more strongly correlated to wages, which remain resilient in a job market with record-low
unemployment.
Because many upgrades are at the time of vehicle acquisition, whether new or “new to
you,” the slowdown in new vehicle production has provided an additional headwind that
seems to be clearing. Moreover, because pickup parts account for 27% of the specialty-
equipment market, it is important to note the top 10 list of U.S. auto sales in June 2023 and
their year-over-year growth from June 2022:
Introduction
1. Featured Sector News……………..……………….…….... 6
2. Additional Automotive Aftermarket M&A Highlights....….. 7
3. Demand Unlikely to Be Affected by Interest Rates or
Credit Availability.………………………………………..….. 8
4. 2020–2022 Demand Choppiness Has Seemingly
Abated…......................................................................…. 9
5. New Vehicle Production May Spur Upgrade Demand..... 10
6. Equity Market Index Performance.……………………….. 11
7. Public Company Valuations.………….............................. 13
8. Public Comparables.…………...…………………………… 14
9. Disclaimer……………………………………………………. 16
Table of Contents
AUTOMOTIVE AFTERMARKET UPDATE
Source: MarkLines.
5
1. Ford F-Series up 25%
2. Chevrolet Silverado up 8%
3. Ram Pickups up 3%
4. Toyota RAV4 up 20%
5. Tesla Model Y up 82%
6. Honda CR-V up 36%
7. Nissan Rogue up 125%
8. Toyota Camry up 18%
9. GMC Sierra up 28%
10. Jeep Grand Cherokee up 53%
The global auto aftermarket team at Houlihan Lokey would love to share further thoughts
about the enthusiast subsector and the broader aftermarket landscape. Please do not
hesitate to contact us with any questions you may have.

FEATURED RECENT TRANSACTION
Client Profile
Cardone Industries, Inc., is an industry
-leading automotive parts remanufacturer founded in 1970 and
based in Philadelphia. Cardone has a 50+ year track record of remanufacturing high
-quality, reliable,
and affordable parts. Remanufacturing is the process by which previously sold, worn out, or non
-
functional automotive products (cores) are returned to a “like
-new” or “better-than-new” condition. The
company promotes a circular economy by remanufacturing, providing sustainable products with the
quality and reliability of an original equipment manufacturer to more than 300 blue
-chip customers
across the U.S. The company has over 40,000 unique SKUs and more than 80 product lines with a
focus on steering, calipers, brakes, and electronics. The company’s seven facilities and more than
2,800 employees throughout the U.S. and Mexico serve a variety of North American retailers.
Cardone was previously acquired by Brookfield Asset Management in April 2019.
Our Role
Houlihan Lokey served as the exclusive financial advisor to Cardone, and King & Spalding LLP served
as legal counsel. We assisted in the negotiation and placement of third lien bridge financing from
Brookfield, leading to the initiation, structuring, and negotiation of the sale to a global automotive parts
company.
Transaction Snapshot
On June 30, 2023, Cardone Industries, Inc., a portfolio company of Brookfield Asset Management Ltd.,
was acquired by a global automotive parts company. This transaction builds on Houlihan Lokey’s
successes and expertise in the automotive aftermarket.
6
Cardone Industries, Inc.

Sources: Company website, press releases.
Date Company Subsectors Description Article Link
7/5/2023
Aftermarket Parts
PHINIA Inc. achieved independence by separating from BorgWarner, and it began
trading on the NYSE as “PHIN.” The company focused on delivering innovative systems
for sustainability and aiming for carbon neutrality in vehicles and industries.
Read More
6/26/2023
Aftermarket Retail
and Distribution
William C. Rhodes III will step down as President and CEO of AutoZone, transitioning to
Executive Chairman in January 2024. Philip B. Daniele III will take over as CEO and join
the board of directors.
Read More
5/30/2023
Aftermarket Parts
Atmus
Filtration Technologies, a global filtration industry leader, has successfully closed
its initial public offering of 16,243,070 shares of common stock. The shares were priced
at $19.50 per share, and trading began on the NYSE under the symbol “ATMU” on May
26, 2023. Cummins Inc. remains a major shareholder, owning approximately 80.5% of
outstanding shares.
Read More
5/25/2023
Aftermarket Parts
Fox Factory Holding Corp. appoints Dennis
Schemm
as Chief Financial Officer, effective
June 12, 2023. His extensive finance experience will support the company’s growth
journey. Mr.
Schemm succeeds Interim CFO, Maggie Torres, who will retire.
Read More
5/23/2023
Aftermarket Retail
and Distribution
Kevin Herron, President of U.S. Automotive Group at Genuine Parts Company (GPC),
will retire after 34 years. Randy Breaux will be promoted to Group President, GPC North
America on July 1, 2023. Herron will aid in a smooth transition until his retirement.
Read More
5/17/2023
Aftermarket Parts
Holley Inc. appoints Matthew Stevenson as President and CEO, effective June 6, 2023.
He brings extensive experience in leading organizational turnarounds and growth. Mr.
Stevenson replaces Interim President and CEO, Michelle
Gloeckler
, who remains on the
board of directors.
Read More
5/8/2023
Services
Gary W.
Ferrera has been appointed Executive VP and CFO of Driven Brands, effective
May 10, 2023. His extensive financial expertise and M&A experience will drive growth
and shareholder value. Mr.
Ferrera succeeds Tiffany Mason.
Read More
4/17/2023
Services
Mister Car Wash appointed Mary Porter as Chief People Officer to reinforce its people
-
centric approach. With extensive retail and HR experience, she will enhance the
company’s employee
-first culture, driving talent acquisition, engagement, and
organizational development. Ms. Porter’s belief in employee well
-being aligns with the
company’s values.
Read More
While there have been selected leadership changes announced, the public listings of PHINIA and Atmus Filtration Technologies
are potentially the most consequential changes to the aftermarket corporate landscape.
FEATURED SECTOR NEWS
7

$35.7 $13.0 $12.9 $27.7 $21.0 $7.2
326
311
301
437
361
192
2018 2019 2020 2021 2022 YTD 2023
Disclosed Value ($B) Deals
Automotive aftermarket M&A activity remains consistent
with broader trends; while the number of transactions is
on pace to be relatively steady in 2023, it seems to
comprise a relatively larger number of smaller add-on
acquisitions.
Recent acquisitions have tended to be more heavily
sk
ewed to nondiscretionary replacement parts and
services than enthusiast upgrade parts businesses.
Interest rates seem to have favored strategic buyers over
pri
vate equity parties in recent M&A activity.
Transaction Value and Deal Volume
Additional Notable Transactions
Key Takeaways
$ in Billions
Source: S&P Capital IQ.
Note: Data as of June 30, 2023.
ADDITIONAL AUTOMOTIVE AFTERMARKET M&A HIGHLIGHTS
Date Acquirer Target
6/26/2023
6/13/2023
6/8/2023
Horsepower Automotive
Group, LLC
6/6/2023
5/31/2023
5/23/2023
5/18/2023
5/9/2023
Assets of Zender’s Truck
& Equipment
5/9/2023
5/8/2023
Dealership Services
Business in United States
5/1/2023
4/18/2023
Bagnell Auto Supply, Inc.
4/18/2023
4/18/2023
4/5/2023
8
(5%) 0% 5% 10% 15% 20%
R² = 0.17
(4%)
(2%)
0%
2%
4%
6%
8%
10%
12%
14%
16%
0% 5% 10% 15%
Personal Spending
R² = 0.68
• Because parts or services to upgrade the performance or appearance of a vehicle are discretionary, it is critical for investors and
executives to understand demand drivers.
• 2021 was a very strong year for enthusiast parts and services with relative softness in 2022.
• Given the potentially distorting effects of COVID-19
and subsequent interest rate increases, it is important to utilize long-term data to
understand key reasons for recent historical trends.
• Data indicates that 2021’s strength was likely a pandemic-r
elated outlier, and 2022 was a return-to-normal affected by 2021 pull forward.
• For 2023 and 2024, interest rates and/or credit availability are unlikely to have as significant an impact on demand as wage grow
th.
DEMAND UNLIKELY TO BE AFFECTED BY INTEREST RATES OR
CREDIT AVAILABILITY
Historical demand indicates that personal spending, a driver of enthusiast upgrade parts and services, has a much stronger
correlation with income than consumer credit.
Total Wages and Government Transfers Total Consumer Credit
Relatively Strong Correlation Between
Spending and Wages
Relatively Weak Correlation Between
Spending and Credit
Sources: PitchBook, U.S. Department of Commerce Bureau of Economic Analysis.
9

Year-Over-Year Growth in Personal Income
• Because demand for enthusiast upgrade parts and services
seems to be driven significantly by wage growth, it is important
to understand historical implications.
• Annual growth trends for personal income show significant
distortions in the Q2 2020–Q3 2022 periods.
• Anecdotally, many auto aftermarket companies experienced
similar volatility in demand.
• Since the second half of 2022, personal income, and demand
for discretionary auto parts and services, have stabilized and
returned to long-term demand trends.
• Buyers and sellers of businesses in the sector may be more
comfortable understanding businesses and value in this more
stable demand environment, leading to increased M&A activity.
2020–2022 DEMAND CHOPPINESS HAS SEEMINGLY ABATED
Historical year-over-year growth by quarter was generally steady at approximately 5% before experiencing significant gyrations
from Q2 2020 through Q2 2022; growth has now returned to a pattern more consistent with long-term trends.
(5%)
0%
5%
10%
15%
20%
Q1 2018
Q2 2018
Q3 2018
Q4 2018
Q1 2019
Q2 2019
Q3 2019
Q4 2019
Q1 2020
Q2 2020
Q3 2020
Q4 2020
Q1 2021
Q2 2021
Q3 2021
Q4 2021
Q1 2022
Q2 2022
Q3 2022
Q4 2022
Q1 2023
Source: U.S. Department of Commerce Bureau of Economic Analysis.
1
0
Key Takeaways

• Consumers tend to upgrade vehicles shortly following new
ownership.
• Because new vehicle production has continued to face
li
mitations due to supply chain challenges, a key driver for
vehicle upgrade demand has been inhibited.
• Near-ter
m historical monthly low point occurred in January
2022, when more than 1 million vehicles were produced.
• June 2023 saw just under 1.4 million vehicles produced
foll
owing nearly sequential monthly improvements throughout
2023.
• Steady improvement in new vehicle production and sales will
li
kely be a leading indicator for aftermarket upgrade parts
demand.
NEW VEHICLE PRODUCTION MAY SPUR UPGRADE DEMAND
Most aftermarket upgrades to a vehicle come within approximately the first 18 months of ownership; constrained new vehicle
production due to supply chain issues, particularly driven by lack of microchip availability, has largely returned to growth.
12,500,000
13,000,000
13,500,000
14,000,000
14,500,000
15,000,000
15,500,000
LTM U.S. New Vehicle Production
Past 12 Months U.S. New Passenger Vehicle
Production
Source: MarkLines.
11

90
100
110
Apr-23 May-23 Jun-23
S&P 500 Houlihan Lokey Automotive Aftermarket
90
100
110
120
130
Jul-22 Aug-22 Sep-22 Nov-22 Dec-22 Feb-23 Mar-23 May-23 Jun-23
S&P 500 Houlihan Lokey Automotive Aftermarket
Houlihan
Lokey
Automotive
Aftermarket
18.5%
S&P
500
16.3%
After outperforming broader
markets in Q4 2022 and Q1
2023, the aftermarket sector
has lagged recently.
Recent sector declines in
public market price
performance are largely
attributable to Advance
Auto Parts, which declined
40% in May and April after
cutting dividends.
Holley and Motorcar Parts
of America, Inc., enjoyed
significant stock price
increases on a percent
basis in recent periods.
LTM June 2023 Performance
April–June 2023 Performance
S&P
500
7.9%
Houlihan
Lokey
Automotive
Aftermarket
0.3%
(1)
(1)
Source: S&P Capital IQ.
Notes: Data as of June 30, 2023. All share prices are rebased to 100.
(1) The Houlihan Lokey Automotive Aftermarket Index consists of a diversified set of 21 companies across the automotive aftermarket
sector. See pages 14 and 15 for a complete list.
12
EQUITY MARKET INDEX PERFORMANCE

Recent strong performance in the enthusiast parts subsector may be a harbinger of a return to significant M&A activity.
LTM June 2023 Performance by Subsector
60
80
100
120
140
160
Jul-22 Sep-22 Dec-22 Mar-23 Jun-23
Enthusiast Parts Replacement Parts Aftermarket Retail and Distribution Services
YTD 2023 Performance Three-Year Performance (July 2020–June 2023)
27%
-8%
3%
5%
84%
-4%
106%
52%
Source: S&P Capital IQ.
Notes: Data as of June 30, 2023. All share prices are rebased to 100.
13
EQUITY MARKET INDEX PERFORMANCE (CONT.)
AUTOMOTIVE AFTERMARKET SUBSECTORS
Enthusiast Parts
35.8%
Services
32.0%
Aftermarket
Retail and
Distribution
18.7%
Replacement
Parts
(30.3%)

EV/2023E Revenue EV/2023E EBITDA Forward P/E
Enthusiast Parts
Replacement Parts
Aftermarket Retail
and Distribution
Services
15.0x
7.6x
12.1x
15.2x
3.2x
1.0x
1.3x
2.7x
21.9x
11.3x
17.6x
26.3x
14
PUBLIC COMPANY VALUATIONS (2023E)
Source: S&P Capital IQ.
Note: Data as of June 30, 2023.

15
PUBLIC COMPARABLES (LTM JUNE 2023)
AUTOMOTIVE AFTERMARKET
Source: S&P Capital IQ.
Note: Data as of June 30, 2023.
LTM TEV/
Revenue
USDm
EBITDA
USDm EBITDA Margin EPS Forward P/E LTM EBITDA LTM Revenue
Holley Inc. $479.2 $1,132.9 $624.9 7.0x $660.6 $89.1 13.5% $0.0 21.0x 12.7x 1.7x
Fox Factory Holding Corp. 4,590.3 4,916.1 219.6 0.7x 1,618.4 304.6 18.8% 4.4 20.1x 16.1x 3.0x
XPEL, Inc. 2,326.0 2,362.2 (1.3) N/M 356.3 77.8 21.8% 1.8 36.8x 30.4x 6.6x
ARB Corporation Ltd. 1,562.8 1,566.7 4.0 0.0x 461.4 109.7 23.8% 0.8 23.3x 14.3x 3.4x
Median $111.8 0.7x $561.0 $99.4 20.3% $1.3 22.1x 15.2x 3.2x
Mean $211.8 2.6x $774.2 $145.3 19.5% $1.7 25.3x 18.4x 3.7x
Dorman Products, Inc. $2,480.6 $3,251.3 $674.1 3.0x $1,798.9 $225.8 12.6% $2.9 14.1x 14.4x 1.8x
Standard Motor Products, Inc. 813.1 1,149.1 200.2 1.1x 1,370.7 183.2 13.4% 2.8 10.1x 6.3x 0.8x
Motorcar Parts of America, Inc. 150.9 419.1 201.4 3.7x 678.8 53.7 7.9% (0.3) 7.2x 7.8x 0.6x
PHINIA Inc. 1,480.5 2,443.5 442.0 0.7x 3,432.0 593.0 17.3% 5.0 N/A 4.1x 0.7x
Atmus Filtration Technologies Inc. 1,829.2 1,867.5 510.7 2.1x 1,618.6 240.4
14.9% 2.2 11.6x 7.8x 1.2x
Median $442.0 2.1x $1,618.6 $225.8 13.4% $2.8 10.9x 7.8x 0.8x
Mean $405.7 2.1x $1,779.8 $259.2 13.2% $2.5 10.8x 8.1x 1.0x
Advance Auto Parts, Inc. $4,178.2 $8,588.0 $1,674.1 1.0x $11,198.1 $1,665.6 14.9% $6.7 11.0x 5.2x 0.8x
AutoZone, Inc. 45,269.4 55,354.6 7,023.0 1.6x 17,114.9 4,266.4 24.9% 127.3 17.9x 13.0x 3.2x
O’Reilly Automotive, Inc. 58,157.7 65,202.1 4,815.8 1.2x 15,220.0 3,931.8 25.8% 36.0 24.9x 16.6x 4.3x
Genuine Parts Company 23,779.5 27,370.5 2,873.7 1.2x 22,879.0 2,421.4 10.6% 8.5 18.5x 11.3x 1.2x
LKQ Corp. 15,575.0 19,300.0 2,096.0 1.0x 12,902.0 2,099.0 16.3% 3.7 14.0x 9.2x 1.5x
CarParts.com, Inc. 239.4 234.5 (29.9) N/M 671.0 21.9 3.3% (0.0) N/M 10.7x 0.3x
Median $2,484.8 1.2x $14,061.0 $2,260.2 15.6% $7.6 17.9x 11.0x 1.3x
Mean $3,075.5 1.2x $13,330.9 $2,401.0 16.0% $30.4 17.3x 11.0x 1.9x
Mister Car Wash, Inc. $2,977.2 $4,618.8 $775.6 2.2x $894.8 $354.3 39.6% $0.3 28.4x 13.0x 5.2x
Boyd Group Services Inc. 4,098.4 5,129.1 1,004.5 3.2x
2,730.9 315.3 11.5% 3.4 40.3x 16.3x 1.9x
Monro, Inc. 1,276.5 1,940.5 371.6 1.9x 1,302.8 191.3 14.7% 1.1 22.8x 10.1x 1.5x
Driven Brands Holdings Inc. 4,534.2 8,396.1 2,658.9 4.2x 2,127.3 629.7 29.6% 0.2 20.8x 13.3x 3.9x
Valvoline Inc. 6,219.5 5,972.8 640.7 2.0x 1,388.9 316.0 22.7% 0.8 27.1x 18.9x 4.3x
D’Ieteren Group S.A. 9,387.2 10,630.6 1,203.6 3.6x 5,038.6 331.8 6.6% 6.6 13.6x 32.0x 2.1x
Median $890.1 2.7x $1,758.1 $323.9 18.7% $0.9 24.9x 14.8x 3.0x
Mean $1,109.2 2.9x $2,247.2 $356.4 20.8% $2.1 25.5x 17.3x 3.1x
Overall Median $640.7 1.9x $1,618.6 $315.3 14.9% $2.8 20.1x 13.0x 1.8x
Overall Mean $1,332.5 2.2x $5,022.1 $877.2 17.4% $10.2 20.2x 13.5x 2.4x
Services
Replacement
Parts
Net Debt/LTM
EBITDA
Market Cap
USDm
EV
USDm
Net Debt
USDm
Enthusiast
Parts
Aftermarket
Retail and
Distribution

Source: S&P Capital IQ.
Note: Data as of June 30, 2023.
16
PUBLIC COMPARABLES (2023E)
AUTOMOTIVE AFTERMARKET
EV/Revenue EV/EBITDA P/E EBITDA Margin
2022 2023E 2022 2023E 2022 2023E Revenue EBITDA 2022 2023E 2022 2023E
Holley Inc. 6.3x 1.6x 1.7x 11.5x 8.9x 28.6x 28.1x (1.9%) (8.6%) 14.3% 19.1% 13.3x 14.1x
Fox Factory Holding Corp. 0.7x 3.1x 2.9x 16.0x 15.2x 22.4x 21.0x 13.3% 14.1% 19.2% 19.4% 19.4x 19.6x
XPEL, Inc. N/M 7.3x 6.0x 35.3x 28.2x N/M 37.3x 22.8% 32.2% 20.7% 21.5% 41.5x 36.5x
ARB Corporation Ltd. 0.0x 3.4x 3.5x 14.3x 14.7x 22.8x 24.0x (5.9%) (15.0%) 23.8% 23.6% 21.0x 24.2x
Median 0.7x 3.2x 3.2x 15.1x 15.0x 22.8x 26.1x 5.7% 2.7% 19.9% 20.4% 20.2x 21.9x
Mean 2.4x 3.8x 3.5x 19.3x 16.7x 24.6x 27.6x 7.1% 5.7% 19.5% 20.9% 23.8x 23.6x
Dorman Products, Inc. 2.8x 1.9x 1.7x 13.6x 10.5x 20.5x 15.3x 21.0% 18.8% 13.8% 15.7% 15.6x 13.3x
Standard Motor Products, Inc. 1.1x 0.8x 0.8x 6.5x 8.7x 11.4x 10.6x 3.5% (13.7%) 12.9% 9.5% 10.3x 11.3x
Motorcar Parts of America, Inc. 4.4x 0.6x 0.6x 9.2x 4.9x
N/M 7.2x 5.1% 10.6% 7.0% 11.9% 2.9x 7.0x
PHINIA Inc. 0.8x 0.7x N/A 4.2x N/A N/A N/A N/A N/A 17.5% N/M N/A N/A
Atmus Filtration Technologies Inc. 2.4x 1.2x 1.2x 8.7x 6.5x N/A 11.6x 5.7% 15.3% 13.7% 18.0% N/A 11.3x
Median 2.4x 0.8x 1.0x 8.7x 7.6x 15.9x 11.1x 5.4% 13.0% 13.7% 13.8% 10.3x 11.3x
Mean 2.3x 1.1x 1.1x 8.5x 7.6x 15.9x 11.2x 8.8% 7.8% 13.0% 13.8% 9.6x 10.7x
Advance Auto Parts, Inc. 0.9x 0.8x 0.8x 4.8x 10.1x 8.5x 11.8x 1.0% (32.2%) 15.9% 7.6% 5.4x 11.1x
AutoZone, Inc. 1.7x 3.3x 3.1x 13.5x 13.6x 20.9x 18.5x 7.8% 1.8% 24.8% 23.1% 19.0x 18.0x
O’Reilly Automotive, Inc. 1.3x 4.5x 4.2x 17.2x 18.3x 28.6x 25.6x 8.4% (1.9%) 26.3% 22.8% 26.5x 23.9x
Genuine Parts Company 1.2x 1.2x 1.2x 11.5x 12.7x 20.4x 18.7x 11.3% 6.5% 10.8% 9.2% 20.1x 17.6x
LKQ Corp. 1.0x 1.5x 1.4x 9.2x 10.7x 14.1x 14.3x 3.0% (9.5%) 16.4% 13.0% 14.6x
14.0x
Car
Parts.com, Inc. N/M 0.4x 0.3x 10.6x 11.5x N/M N/M 8.5% 71.5% 3.4% 3.0% N/A N/M
Median 1.2x 1.4x 1.3x 11.0x 12.1x 20.4x 18.5x 8.1% (0.0%) 16.1% 11.1% 19.0x 17.6x
Mean 1.2x 2.0x 1.8x 11.1x 12.8x 18.5x 17.8x 6.7% 6.0% 16.2% 13.1% 17.1x 16.9x
Mister Car Wash, Inc. 2.2x 5.3x 5.0x 13.1x 16.6x 28.4x 29.9x 10.6% 54.0% 40.3% 30.0% 25.3x 28.5x
Boyd Group Services Inc. 3.8x 2.1x 1.7x 19.7x 13.9x N/M 43.4x 25.5% 33.0% 10.7% 12.5% 49.1x 35.3x
Monro, Inc. 1.8x 1.4x 1.5x 9.3x 11.4x 28.5x 28.5x (0.9%) (12.6%) 15.5% 13.0% 23.5x 25.7x
Driven Brands Holdings Inc. 4.3x 4.1x 3.6x 13.5x 15.6x N/M 22.1x 25.6% 7.1% 30.6% 23.2% 21.1x 26.8x
Valvoline Inc. 2.2x 4.7x 4.0x 20.9x 14.9x N/M 29.8x 49.1% 1.8% 22.3% 27.0% 34.3x 23.5x
D’Ieteren Group S.A. 3.6x 2.1x 0.9x 32.0x 17.3x 26.8x 13.6x 76.8% 102.1% 6.6% 5.1% 14.1x 13.3x
Median 2.9x 3.1x 2.7x 16.6x
15.2x 28.4x 29.
1x 25.6% 20.0% 18.9% 18.1% 24.4x 26.3x
Mean 3.0x 3.3x 2.8x 18.1x 14.9x 27.9x 27.9x 31.1% 30.9% 21.0% 18.5% 27.9x 25.5x
Overall Median 1.8x 1.9x 1.7x 13.1x 13.2x 22.4x 21.0x 8.4% 6.8% 15.9% 16.8% 19.7x 18.0x
Overall Mean 2.2x 2.5x 2.3x 14.0x 13.2x 21.7x 21.6x 14.5% 13.8% 17.4% 16.4% 20.9x 19.7x
Net Debt/2022
EBITDA
2021–23E CAGR Forward P/E
Services
Replacement
Parts
Aftermarket
Retail and
Distribution
Enthusiast
Parts

© 2023 Houlihan Lokey. All rights reserved. This material may not be reproduced in any format by any means or redistributed without the prior written consent of
Houlihan Lokey.
Houlihan Lokey is a trade name for Houlihan Lokey, Inc., and its subsidiaries and affiliates, which include the following licensed (or, in the case of Singapore, exempt)
entities: in (i) the United States: Houlihan Lokey Capital, Inc., and Houlihan Lokey Advisors, LLC, each an SEC-registered broker-dealer and member of FINRA
(www.finra.org
) and SIPC (www.sipc.org) (investment banking services); (ii) Europe: Houlihan Lokey Advisory Limited, Houlihan Lokey EMEA, LLP, Houlihan Lokey
(Corporate Finance) Limited, and Houlihan Lokey UK Limited, authorized and regulated by the U.K. Financial Conduct Authority; Houlihan Lokey (Europe) GmbH,
authorized and regulated by the German Federal Financial Supervisory Authority (Bundesanstalt für Finanzdienstleistungsaufsicht); (iii) the United Arab Emirates, Dubai
International Financial Centre (Dubai): Houlihan Lokey (MEA Financial Advisory) Limited, regulated by the Dubai Financial Services Authority for the provision of advising
on financial products, arranging deals in investments, and arranging credit and advising on credit to professional clients only; (iv) Singapore: Houlihan Lokey (Singapore)
Private Limited and Houlihan Lokey Advisers Singapore Private Limited, each an “exempt corporate finance adviser” able to provide exempt corporate finance advisory
services to accredited investors only; (v) Hong Kong SAR: Houlihan Lokey (China) Limited, licensed in Hong Kong by the Securities and Futures Commission to conduct
Type 1, 4, and 6 regulated activities to professional investors only; (vi) India: Houlihan Lokey Advisory (India) Private Limited, registered as an investment adviser with
the Securities and Exchange Board of India (registration number INA000001217); and (vii) Australia: Houlihan Lokey (Australia) Pty Limited (ABN 74 601 825 227), a
company incorporated in Australia and licensed by the Australian Securities and Investments Commission
(AFSL number 474953) in respect of financial services
provided to wholesale clients only. In the United Kingdom, European Economic Area (EEA), Dubai, Singapore, Hong Kong, India, and Australia, this communication is
directed to intended recipients, including actual or potential professional clients (UK, EEA, and Dubai), accredited investors (Singapore), professional investors (Hong
Kong), and wholesale clients (Australia), respectively. No entity affiliated with Houlihan Lokey, Inc., provides banking or securities brokerage services and is not subject
to FINMA supervision in Switzerland or similar regulatory authorities in other jurisdictions. Other persons, such as retail clients, are NOT the intended recipients of our
communications or services and should not act upon this communication.
Houlihan Lokey gathers its data from sources it considers reliable; however, it does not guarantee the accuracy or completeness of the information provided within this
presentation. The material presented reflects information known to the authors at the time this presentation was written, and this information is subject to change. Any
forward-looking information and statements contained herein are subject to various risks and uncertainties, many of which are difficult to predict, that could cause actual
results and developments to differ materially from those expressed in, or implied or projected by, the forward-looking information and statements. In addition, past
performance should not be taken as an indication or guarantee of future performance, and information contained herein may be subject to variation as a result of
currency fluctuations. Houlihan Lokey makes no representations or warranties, expressed or implied, regarding the accuracy of this material. The views expressed in this
material accurately reflect the personal views of the authors regarding the subject securities and issuers and do not necessarily coincide with those of Houlihan Lokey.
Officers, directors, and partners in the Houlihan Lokey group of companies may have positions in the securities of the companies discussed. This presentation does not
constitute advice or a recommendation, offer, or solicitation with respect to the securities of any company discussed herein, is not intended to provide information upon
which to base an investment decision, and should not be construed as such. Houlihan Lokey or its affiliates may from time to time provide financial or related services to
these companies. Like all Houlihan Lokey employees, the authors of this presentation receive compensation that is affected by overall firm profitability.
17
DISCLAIMER

Corporate Finance
Financial Restructuring
Financial and Valuation Advisory
HL.com
