

DEPARTMENT OF THE TREASURY
WASHINGTON, D.C. 20220
July 24, 2017
We are pleased to present the Summary of States’ Annual Reports for the U.S. Treasury’s State
Small Business Credit Initiative (SSBCI). SSBCI was created by the Small Business Jobs Act of
2010 to support state-level small business nancing programs in order to improve access to capital
in the wake of the Great Recession. Seven years later, SSBCI continues to address long-standing
nancing gaps for small businesses, including early stage and women and minority-owned
businesses. As the SSBCI was appropriated to run through 2017, Treasury’s administration of the
program sunsets this year, making this the nal summary of Annual Reports.
Cumulatively, from 2011 to 2016, states reported the following notable accomplishments:
• States expended $1.2 billion in SSBCI funds which supported new nancing to small
businesses totaling $10.7 billion.
• SSBCI programs have supported $8.95 in new nancing for every $1 of SSBCI funds.
• Small business owners reported that SSBCI funds will help create or save more than
240,000 jobs.
We commend the state program managers and their partners for enabling thousands of small
businesses to grow over the past six years, and for their ongoing efforts to recycle SSBCI funds
to support even more small businesses.
For more information about SSBCI, including the SSBCI Program Evaluation Report,
visit www.treasury.gov/ssbci.
Kipp Kranbuhl Jeffrey Stout
Deputy Assistant Secretary Director
Small Business, Community Development State Small Business Credit Initiative
And Affordable Housing Policy

SSBCI: Summary of States’ 2016 Annual Reports
I
Table of Contents
Overview. . . . . . . . . . . . . . . . . . . . . . . . . . . . . . . . . . . . . . . . . . . . . . . .1
SSBCI-Supported Loans and Investments Financed Small Business Growth . . . . . . . . . 4
SSBCI Mobilized Local Sources of Capital . . . . . . . . . . . . . . . . . . . . . . . . . . . . . 6
SSBCI Program Performance . . . . . . . . . . . . . . . . . . . . . . . . . . . . . . . . . . . . 8
Appendix A:
State-by-State Results . . . . . . . . . . . . . . . . . . . . . . . . . . . . . . . . . . . . . . 25
Participating Municipalities . . . . . . . . . . . . . . . . . . . . . . . . . . . . . . . . . . . 49
Participating Territories . . . . . . . . . . . . . . . . . . . . . . . . . . . . . . . . . . . . . 51
Appendix B:
SSBCI Funds Expended by State Program . . . . . . . . . . . . . . . . . . . . . . . . . . . 54
Appendix C:
Top 50 SSBCI Lenders by Dollar Amount Loaned and by Number of Loans . . . . . . . . 61
Appendix D:
Top 25 SSBCI CDFIs by Dollar Amount Loaned and by Number of Loans . . . . . . . . . . 65
Appendix E:
SSBCI Program Types . . . . . . . . . . . . . . . . . . . . . . . . . . . . . . . . . . . . . . 67
Acknowledgements . . . . . . . . . . . . . . . . . . . . . . . . . . . . . . . . . . . . . . . . 70

SSBCI: Summary of States’ 2016 Annual Reports
1
OVERVIEW
Overview
The State Small Business Credit Initiative
1
(SSBCI) awarded over $1.4 billion to agencies in every state
2
for small business nancing programs. States designed programs in response to local economic
conditions and targeted a range of challenges small businesses face securing nancing. These programs
spur private sector nancing by sharing the risk of repayment with lenders and investors—primarily
community banks, community development nancial institutions (CDFIs), and local investors. States
operated ve types of programs under SSBCI: capital access programs, loan guarantee programs, loan
participation programs, collateral support programs, and venture capital programs. SSBCI funds will
remain with states to be recycled to support more small businesses over time.
Each year Treasury releases a summary of data submitted to Treasury by the states in Annual Reports. As
Treasury’s administration of SSBCI sunsets in September 2017, this is the nal summary of Annual Reports.
1 The Small Business Jobs Act of 2010 authorized and funded SSBCI to operate through September 27, 2017.
2 SSBCI awarded funding to 47 states, the District of Columbia, ve territories, and municipalities in three states, collectively
referred to as “states” in this report.

SSBCI: Summary of States’ 2016 Annual Reports
2
OVERVIEW
Highlighted Outcomes
$10.7 billion in new nancing from over 21,000 loans and investments—From 2011 to 2016, the
total value of new nancing provided to small businesses supported by SSBCI funds reached $10.7 billion
or almost $9 for every $1 in SSBCI funds loaned to or invested in a small business.
Over 240,000 jobs created or retained—The small business owners who received SSBCI-supported
funds projected that they will create over 79,000 jobs within two years of the loan or investment and
will retain over 161,000 jobs that were at risk of loss.
Figure 1: New Financing Supported by SSBCI
$250 m – $500 m
$100 m – $250 m
$50 m – $100 m
$0 – $50 m
$500 m – $1.1bn
New Financing
ID
NW
AZ
AK
HI
NM
TX
CO
UT
MT
ND
SD
WY
NE
KS
OK
AR
LA
MO
IA
MN
WI
IL
IN
MI
OH
PA
NY
VT
ME
NH
MA
RI
CT
NJ
DE
DC
VA
WV
KY
TN
MS
AL
GA
NC
SC
FL
MD
WA
OR
CA
Puerto
Rico
American
Samoa
GuamU.S. Virgin
Islands
Northern
Mariana Islands

SSBCI: Summary of States’ 2016 Annual Reports
3
OVERVIEW
Over 80 new small business support programs—The availability of SSBCI funds resulted in a new
infrastructure of credit support programs across the country. SSBCI funded 154 programs nationwide,
more than half of which were created as a result of SSBCI. States dedicated $1 billion (70 percent)
to programs that support lending to small businesses and over $400 million (30 percent) to venture
capital programs targeting investment in early stage small businesses.
3 The data presented throughout this report are cumulative through December 31, 2016.
Figure 2: Summary of Program Outcomes by Objective, cumulative through
December 31, 2016
3
Objective Program Outcomes
Support nancing of small businesses Median business size: 3 full-time employees
Average business size: 11 full-time employees
Median loan/investment amount at closing: $33,000
Average loan/investment amount at closing: $381,700
Expand access to credit to businesses in low- and moderate-income
(LMI) areas, minority and other underserved communities
42.9 percent in LMI areas
41 percent to women or minority-owned businesses*
Leverage new nancing $8.95 in new nancing for each $1 in SSBCI funds expended
Create or retain jobs 240,669 projected jobs created or retained (79,193 created,
161,476 retained) within two years of loan or investment closing
as reported by small business owners
* This percentage does not reect all women or minority-owned businesses supported by SSBCI funds because only some states reported this data.

SSBCI: Summary of States’ 2016 Annual Reports
4
LOANS AND INVESTMENTS
SSBCI-Supported Loans and Investments
Financed Small Business Growth
SSBCI funds supported over 21,000 loans and investments made to small businesses representing
almost every major industry sector. States aligned programs with local economic development
goals by addressing nancing gaps facing neighborhood businesses, high-tech startups, and small
manufacturers, among others. This section highlights some types of businesses that received a
signicant concentration of SSBCI-supported nancing.
Small manufacturers
States sought to create additional economic
benets by supporting base industries like
manufacturing. SSBCI supported 2,520 loans
and investments totaling $2.5 billion in new
nancing to small manufacturers. These
businesses reported that SSBCI-supported
loans and investments would result in 41,000
jobs created or retained.
Women and minority-owned
businesses
SSBCI required states to develop a plan to
reach underserved communities but gave the
states exibility to dene “underserved.”
4
Many
states created programs specically tailored for
women and minority-owned businesses. More
than 41 percent of SSBCI-supported loans or
investments (totaling more than $1.6 billion)
were made to women or minority-owned
businesses.
5
4 Small Business Jobs Act of 2010, Sec 3005(e)(8).
5 Business ownership demographics (women-owned
and minority-owned) were optional data elds. In
total, 43 out of 56 states reported on a total of 13,479
transactions to either or both of these data elds. Of
those transactions, 9,057 transactions were reported
to be in a women- and/or minority-owned business.
Those 9,057 transactions were responsible for $1.6
billion in new nancing, representing just over 41
percent of the 21,963 total SSBCI transactions.
High growth potential businesses
Venture capital is highly concentrated in
certain states. Many states funded venture
capital programs that target early stage
businesses in markets where venture capital
is less accessible, which helped support over
$4 billion in new nancing through 1,623
investments.
Businesses in economically distressed
areas
SSBCI has been eective in supporting small
businesses in areas that were hit hardest by
the recession and where the need continues
to be the greatest. Over 42 percent of SSBCI-
supported loans and investments were made
to businesses in low- and moderate-income
(LMI) communities.
Very small businesses
Over 17,000 transactions or 78 percent of
all SSBCI-supported loans and investments
were to businesses with under $1 million in
revenues, a category of business that have
more diculty accessing capital.
6
6 Small Business Credit Survey. Federal Reserve
Banks. April 2017. Web accessed. Page iv. (https://
www.newyorkfed.org/medialibrary/media/
smallbusiness/2016/SBCS-Report-EmployerFirms-2016
.pdf)

SSBCI: Summary of States’ 2016 Annual Reports
5
LOANS AND INVESTMENTS
Featured Small Businesses
JSB Industrial Solutions (Kentucky)
Conventional nancing was out of reach when
Shane Wallingford tried to start a sheet metal
manufacturing company. A local Community
Development Financial Institution (CDFI),
the Mountain Association for Community
Economic Development (MACED), stepped in
with support from the Kentucky Cabinet for
Economic Development’s collateral support
program to provide a loan for equipment and
start-up costs. The loan enabled JSB Industrial
Solutions to start up and create ve new jobs
in an economically distressed county.
Jada Beauty (Indiana)
When Danielle McDowell and Janell Shaer
sought seed capital for their e-commerce
platform, Jada Beauty, Indiana’s SSBCI program
matched an investment from a member-
managed angel fund. Jada Beauty launched
and within 18 months was acquired by a
national brand. Indiana generated sizable
returns, providing additional early-stage
capital available to be invested in future
opportunities.
Prospect Mining (Alabama)
Special purpose buildings, such as a coal
washing facility, are more dicult to nance
because of limited resale demand. Alabama’s
SSBCI program guaranteed a $5 million loan to
Prospect Mining to nish construction of such
a facility, saving the company over one million
dollars per year on hauling expenses. Prospect
Mining estimates the facility will support
approximately 100 jobs in an economically
distressed region of the state.
Thai Zap (Idaho)
Obtaining traditional nancing can be dicult
for rst-time small business owners. Idaho’s
SSBCI program provided collateral support
to guarantee a $49,500 loan to start a food
truck serving Thai cuisine to the residents of
Pocatello, Idaho. The business owner was able
to hire three employees.

SSBCI: Summary of States’ 2016 Annual Reports
6
MOBILIZED CAPITAL
SSBCI Mobilized Local Sources of Capital
States addressed local nancing gaps by sharing risk with local lenders and investors. This section
highlights the types of lenders and investors that participated in SSBCI programs.
Community banks
Sixty-three percent of the dollar amount
of loans supported by SSBCI ($3.4 billion)
were made by community banks. Over 700
community banks participated in SSBCI
programs across the country.
Community Development Financial
Institutions (CDFIs)
CDFIs, lenders with a mission of community
development, accounted for 54 percent of
all SSBCI-supported loans or $835 million in
new nancing. The average CDFI borrower
had four full-time employees, which is dened
as a microbusiness by the Small Business
Administration.
Regional Banks
A number of regional banks were very active
participants in SSBCI. Seven of the top 25
lenders by volume were regional banks, which
primarily funded more established businesses
that averaged 22 full-time employees.
Equity Investors
Under SSBCI, 38 states funded venture capital
programs. These programs engaged a variety
of equity investors to improve access to equity
investments in innovative businesses.
7
SSBCI
venture capital programs helped support
$4.2 billion in new nancing.
7 Thirty-eight states funded venture capital programs.
As of December 31, 2016, 36 venture capital programs
had expended SSBCI dollars. In this report, those 36
programs will be referred to as active programs.

SSBCI: Summary of States’ 2016 Annual Reports
7
MOBILIZED CAPITAL
Featured Small Businesses
Servant’s Heart (North Carolina)
Servant’s Heart, a non-prot that provides
coordinated care for adults with mental and
developmental disabilities, received a loan to
buy a new building and expand its operations.
NewBridge Bank, a community bank, and The
North Carolina Rural Center, which operates
North Carolina’s Loan Participation Program,
came together to make the loan possible.
Southern Girl Desserts (California)
After turning to merchant cash advances to
nance the rapid expansion of Los Angeles-
based Southern Girl Desserts, the owners
faced monthly payments equal to 40 percent
of the company’s cash ow. They renanced
their high cost debt through California’s CAP
program with Opportunity Fund, a CDFI. The
renance cut their monthly payments by
ninety percent.
Earnest Products (Florida)
Earnest Products fabricates high-quality metal
used to manufacture custom parts. Fifth Third
Bank, a regional bank, nanced the company’s
recent expansion, including a $1.75 million
line of credit guaranteed by Florida’s SSBCI
program. The expansion created 25 new jobs
and the business anticipates creating 100 more
high-wage, skilled manufacturing jobs over the
next few years.
Moleculera Labs (Oklahoma)
The founders of Moleculera Labs developed a
test to help dierentiate autism from Pediatric
Acute-Onset Neuropsychiatric Syndrome (PANS).
Moleculera struggled to raise investment
to commercialize its test until i2E, a private
non-prot that administers Oklahoma’s
SSBCI program, invested over $1 million and
helped attract co-investment from local angel
investors. Moleculera now has 11 employees.
Initially, Moleculera’s client base was 12 clinicians,
but now nearly 850 order the test and over
5,000 patients have been tested and treated.

SSBCI: Summary of States’ 2016 Annual Reports
8
PROGRAM PERFORMANCE
SSBCI Program Performance
2016 marked the sixth year of SSBCI program activity. This section highlights measures of performance
assembled from the states’ 2016 Annual Reports.
8
Aggregate Performance
States designed SSBCI programs suited to their local communities and had the exibility to apply
funds to the types of programs that they deemed most successful. Figure 3 highlights performance by
program type.
Capital access programs (CAPs) provide a portfolio loan loss reserve for which the lender and
borrower contribute a share of the loan value (up to seven percent) that is matched on a dollar-for-
dollar basis with SSBCI funds. Losses may be recovered from the reserve until there is no additional
funding in the reserve. CAPs operate in 24 states, which allocated $40 million toward them. CAPs
expended 71 percent of their allocated amounts (includes administrative expenses) by making 13,965
small business loans.
Collateral support programs (CSPs) provide cash to lenders to boost the value of available collateral.
A collateral shortfall is a common issue in many areas where the economy has not fully recovered from
the Great Recession. CSPs operate in 17 states, which collectively allocated $269 million toward them.
States have expended 89 percent of the funds allocated to CSPs, totaling $238 million. The average
total nancing per small business loan in a CSP was $866,200.
Loan guarantee programs (LGPs) provide an assurance to lenders of partial repayment in the event
a loan goes into default. Guarantees typically support businesses that do not t standard lending
criteria. States allocated $246 million toward LGPs operating in 22 states, and have expended
$182 million of that amount, or 74 percent. State LGPs supported 2,779 loans averaging
$501,900 per loan.
8 The data throughout this report have not been veried or audited by Treasury.
Figure 3: Summary Data by Program Type
States with
Programs
Loans/
Investments
Total New Financing
($ millions)
Average New Financing
per Transaction
Leverage
Ratio
Jobs
Retained
Jobs
Created
Capital Access 24 13,965 $640 $45,849 22.54:1 65,073 14,553
Collateral Support 17 1,530 $1,325 $866,195 5.57:1 14,059 12,105
Loan Guarantee 22 2,779 $1,395 $501,891 7.66:1 44,447 16,793
Loan Participation 40 2,065 $3,157 $1,528,715 7.53:1 27,208 22,173
Venture Capital 38 1,623 $4,171 $2,569,664 12.76:1 10,689 13,569

SSBCI: Summary of States’ 2016 Annual Reports
9
PROGRAM PERFORMANCE
Loan participation programs (LPPs) purchase a portion of a loan that a lender makes or make a
direct loan from the state in conjunction with a private loan (companion loan). The state typically is
subordinate to the lender’s loan. LPPs operate in 40 states, which allocated $474 million—the largest
allocation of SSBCI funds for any program type—toward them. States have expended $419 million of
the allocation.
Venture capital programs (VCPs) provide nancing by purchasing an ownership interest or providing
equity-like loans to enterprises that typically do not participate in debt nancing markets due to
their business stage and structure. Forty states allocated $431 million toward VCPs, and expended 76
percent, or $327 million. VCPs supported $4.2 billion in new nancing, the most of any program type,
and achieved a leverage ratio of 12.76 to 1.
See Appendix E for additional details on performance by program type.

SSBCI: Summary of States’ 2016 Annual Reports
10
PROGRAM PERFORMANCE
New Financing Leveraged
Through 2016, $8.95 in new nancing resulted from every $1 of SSBCI funding (8.95:1 leverage ratio).
9
Figure 4 summarizes the ratio of new financing supported to dollars of SSBCI expended from
2011 to 2016.
CAPs and VCPs achieved signicantly higher leverage than LGPs, LPPs, and CSPs. CAPs achieve higher
leverage (22.54) by virtue of the program’s design in which the state’s contribution is limited to
two-to-seven percent of each loan and averaged four percent. VCPs achieved higher leverage
(12.76) in large part because initial rounds of nancing set the stage for future rounds.
SSBCI funds will continue to spur more new nancing as loans or investments are repaid and states
recycle SSBCI funds into new small businesses, even after the SSBCI program sunsets. Through 2016,
states recycled $280 million. Over half of all states reported recycling funds.
9 New nancing leverage calculations include SSBCI funds expended for administrative expenses and exclude
non-private sources.
Figure 4: New Financing Leveraged
Total New Financing Leveraged Including
Subsquent Private Financing ($ millions)
SSBCI Funds Expended ($ millions)
0
$500
$1,000
$1,500
$2,000
$2,500
$3,000
$3,500
$4,000
$4,500
0 $30 $80 $130 $180 $230 $280 $330 $380 $430
Loan Guarantee
Collateral Support
Loan Participation
Venture Capital
Capital Access
22.54
7.66
5.57
12.76
7.53
Figure 5: Leverage Ratios by Program Type
Program Type
SSBCI Funds Expended*
($ millions)
Total New Financing Leveraged including
Subsequent Private Financing**
($ millions)
Total Subsequent
Private Financing
($ millions) Leverage Ratio
Capital Access $28 $640 $0 22.54:1
Collateral Support $238 $1,325 $0 5.57:1
Loan Guarantee $182 $1,395 $0 7.66:1
Loan Participation $419 $3,157 $270 7.53:1
Venture Capital $327 $4,171 $2,035 12.76:1
Total $1,195 $10,688 $2,305 8.95:1
* Includes SSBCI funds expended for program administration
** Includes nancing leveraged with recycled SSBCI funds

SSBCI: Summary of States’ 2016 Annual Reports
11
PROGRAM PERFORMANCE
Size and Purpose of SSBCI-Supported Loans and Investments
Across all programs, the average loan or investment supported by SSBCI was $381,686 at closing
with an average of $62,121 in SSBCI support.
10
The average transaction size and the amount of SSBCI
support per loan or investment varied by program type. The average amount of a CAP loan was the
smallest, at approximately $46,000, with $1,752 of SSBCI support, whereas the average transaction size
of an LPP loan was $1,398,011, with 17.2 percent of SSBCI support, or $240,406.
In 2016 Treasury collected additional data elds through an optional transaction-level data collection.
Forty-one of 57 states reported transaction level data on the primary use of funds. Figure 7 shows that
half of all loans and investments for which optional data was reported were primarily used for wages,
working capital, and professional services.
10 The average level of SSBCI support for each loan or investment does not correlate directly with leverage ratios which
include activity generated by recycling SSBCI funds and subsequent private nancing for certain programs.
Figure 6: Average Transaction Size and Average Level of Support
$ in Thousands
Average Level of Support Average Transaction Size
$0
$800
$600
$400
$200
$1,000
$1,200
$1,400
$1,600
3.8%
CAP
20.8%
Collateral Support
17.6%
Loan Guarantee
17.2%
Loan Participation
15.1%
Venture Capital
Figure 7: Primary Use of Funds
Fund Construction Costs
Purchase Equipment
Purchase Real Estate
Refinance
Wages, Working Capital
& Professional Services
3%
3%
5%
50% 39%

SSBCI: Summary of States’ 2016 Annual Reports
12
PROGRAM PERFORMANCE
SSBCI-Supported Loans and Investments by Amount
Loans and investments of less than $100,000 made up only ve percent of the total dollar amount
of SSBCI-supported loans and investments through 2016, but they accounted for the bulk of all
transaction volume. Over two-thirds (69 percent) of SSBCI-supported loans or investments were less
than $100,000. Total nancings of greater than half a million dollars represented 81 percent of the total
dollar amount but just 14 percent of the total transaction volume.
Figure 8: SSBCI-Supported Loans or Investments
# of Loans/Investments
New Financing ($ millions)
# of Transactions New Financing
0 2,000 4,000 6,000 8,000
0 4,000 8,000 12,000 16,0002,000 6,000 10,000 14,000
>
$10 million
$500,000–$10 million
$100,000–$500,000
<
$100,000
51
$ 950
2,994
$ 7,608
3,742
15,175
$ 1,499
$ 631

SSBCI: Summary of States’ 2016 Annual Reports
13
PROGRAM PERFORMANCE
Jobs Created and Retained
Business owners projected that SSBCI-supported loans and investments would lead to the creation
and retention of 240,669 jobs—79,193 jobs created and 161,476 jobs retained. Business owners
estimated the number of full-time jobs that will be created within two years and that will be retained
that were at risk of loss.
11
11 Jobs Created include the number of new Full-Time Equivalent (FTE) jobs expected to be created as a direct result of the
loan; according to the business owner, these jobs will materialize within two years from the date of the loan closing. Jobs
Retained is the number of FTE jobs retained as a direct result of the loan that were at risk of loss. These numbers may
duplicate job estimates for any loans reported under federal programs such as the SBA CDC/504 Loan Program. Treasury
did not verify or audit these estimates.
Figure 9: Jobs Created and Retained by Program Type
Jobs Retained Jobs Created
0
20,000
40,000
60,000
80,000
CAP Collateral Support Loan Guarantee Loan Participation Venture Capital
79,626
26,164
61,240
49,381
24,258

SSBCI: Summary of States’ 2016 Annual Reports
14
PROGRAM PERFORMANCE
Loans or Investments Made in Low- and Moderate-Income (LMI) Communities
The LMI designation is one proxy for the various “underserved” populations targeted by states.
Treasury collected data on business location to analyze the percentage of states that used SSBCI
to reach underserved communities. More than four out of every ten SSBCI-supported loans or
investments were made to businesses in LMI communities.
12
12 Calculated from total number of loans or investments made in low- and moderate-income census tracts. The “Low and
Moderate Income” categorizations are derived from income data from the Census Bureau. The SSBCI Annual Report
transaction statistics are linked to 2010 data from the Census Bureau’s 5-year American Community Survey which is the
successor to the decennial census for census tract level data for income and poverty data. “Low income” households earn
less than 50 percent of area median income. “Moderate income” households earn between 50 percent and 80 percent of
area median income.
Figure 10: Percent of SSBCI-Supported Loans or Investments (by Number)
in LMI Communities by Program Type
0% 10% 20% 30% 40% 50%
Cumulative
All Other
CAP
42.9%
34.3%
48%

SSBCI: Summary of States’ 2016 Annual Reports
15
PROGRAM PERFORMANCE
Small Business Characteristics
This section highlights the variety of small businesses supported based on size (number of full-
time employees (FTEs) and revenue), age, and, in the case of venture capital, investment stage. The
percentages are based on the volume of loans and investments, not dollar amount. SSBCI funds
tended to support very small businesses. Over 80 percent of the loans and investments were made to
businesses with 10 or fewer full-time employees. Two-thirds of SSBCI-supported loans and investments
were made to businesses with revenue between $0 and $500,000. Additionally, over half of all SSBCI-
supported loans and investments were made to businesses less than ve years old.
VCPs had the option to report the stage at which SSBCI-supported investment was made in each
business during Treasury’s 2016 optional transaction-level data collection. Twenty-three states with
VCPs reported this information. Figure 14 shows that for the 967 investments reported, 85 percent
were made in businesses at the pre-seed, seed, and early stage.
Figure 11: Size of
Business, by FTEs
Figure 12: Size of
Business, by Revenue
Figure 13: Age of
Business, in Years
0–1 FTEs
2–10 FTEs
10+ FTEs
20%
32%
48%
<$100k
$100k–$500k
$500k–$1m
$1m–$5m
>$5m
15%
7%
39%
29%
10%
0–1 Years
2–5 Years
6–10 Years
>10 Years
24%
23%
30%
21%
Figure 14: Stage of Venture Capital Investments
Seed
Early Stage
Mezzanine
Growth
Pre-Seed
27%
4%
45%
11%
13%

SSBCI: Summary of States’ 2016 Annual Reports
16
PROGRAM PERFORMANCE
Based on the optional data provided by 43 states, at least 41 percent of all SSBCI-supported loans and
investments made were to a woman or minority-owned small business. The top three states which
reported the optional data represented 83 percent of the reported woman and minority-owned small
business loans and investments.
Figure 15: Loans and Investments to Woman or Minority-Owned Small Businesses
State Number of Transactions Percentage of State’s Transactions
California 6,360 61.8
New York 862 48.9
North Carolina 342 44.5

SSBCI: Summary of States’ 2016 Annual Reports
17
PROGRAM PERFORMANCE
Loans and Investments by Industry
SSBCI funds supported businesses in every major industry sector. Manufacturing, Professional,
Scientic & Technical Services, and Information (which includes a diverse collection of other industries)
accounted for large shares of SSBCI-supported loans or investments by total dollar amount, with
Manufacturing alone generating $2.5 billion of new nancing. The sector with the highest number of
transactions was Retail Trade followed by Accommodation and Food Services.
Figure 16: Industries by NAICS Sector
$145
$147
$163
$174
$188
$208
$263
$270
$327
$391
$585
$604
$864
$937
$1,080
$1,794
$2,548
319
320
453
1,014
41
381
1,943
1,789
494
1,586
1,230
1,172
3,646
2,602
681
1,771
2,520
0
# of Loans/Investments
2,000 4,000 6,000 8,000 10,000
Other Sectors
Educational Services
Agriculture, Forestry, Fishing and Hunting
Administrative and Support and Waste
Management and Remediation Services
Mining, Quarrying, and Oil and Gas Extraction
Arts, Entertainment, and Recreation
Transportation and Warehousing
Other Services (except Public Administration)
Real Estate and Rental and Leasing
Health Care and Social Assistance
Construction
Wholesale Trade
Retail Trade
Accommodation and Food Services
Information
Professional, Scientific
and Technical Services
Manufacturing
0 500 1,000 1,500 2,000 2,500 3,000
New Financing ($ millions)
# of Transactions New Financing

SSBCI: Summary of States’ 2016 Annual Reports
18
PROGRAM PERFORMANCE
Lender and Investor Characteristics
Most SSBCI-supported loans were made by lending institutions with less than $10 billion in assets.
Lenders with less than $10 billion in assets, including CDFIs, accounted for 95 percent of all SSBCI-
supported loans by volume and 86 percent of all SSBCI-supported loans by dollar amount. Community
banks alone accounted for 63 percent of all SSBCI-supported loans by dollar amount.
CDFI Participation in SSBCI Programs
CDFIs made nearly 11,000 loans or investments supported by SSBCI funds, totaling $835 million in new
nancing through 2016. CDFIs accounted for 93 percent of the total number of SSBCI-supported loans
and investments and 8 percent of the total dollar amount nanced.
Georgia and California loaned or invested the largest dollar amounts through CDFIs, followed by
Washington, Pennsylvania, and Mississippi.
CDFIs accounted for just over 86 percent of the total number of SSBCI-supported loans and
investments in Minnesota, followed by New York (86%), California (78%), Pennsylvania (60%), and
Washington (59%).
Figure 17: Lender Participation, by Size of Lender
> $10b
$1.2b–$10b < $1.2b
# of Transactions New Financing
0%
20%
40%
60%
80%
100%
82.6% 62.5%
12.3%
23.7%
5.1%
13.8%
Figure 18: CDFI v. Non-CDFI Summary
# of Transactions*
SSBCI Expended
($ millions)
New Financing
($ millions) Leverage** Jobs Supported
CDFI 10,923 $96.18 $835 8.69 x 56,658
Non-CDFI 9,416 $744.00 $5,682 7.64 x 159,752
Total 20,339 $840.18 $6,517 7.76 x 216,410
* The number of transactions does not include venture capital transactions.
** The leverage ratio does not include administrative expenses.

SSBCI: Summary of States’ 2016 Annual Reports
19
PROGRAM PERFORMANCE
Venture Capital Investor Characteristics
State VCPs spurred private investment in small businesses through a variety of organizations and
structures. This section presents the types of organizations that managed SSBCI dollars and the types
of private investors that co-invested with them. The organizations that managed SSBCI VCPs fall into
four general categories: funds, state-sponsored entities, co-investment funds, and state agencies.
• Funds—SSBCI dollars are obligated to private venture capital funds to be invested alongside private
capital in eligible deals
• State-Sponsored Entities—Quasi- or non-governmental entities are contracted by the state and
serve as intermediaries that manage investments
• Co-Investment Models—States set dened criteria for eligible investments and automatically
match eligible private investments on a formulaic basis
• State Agencies—Sta at the state agency source deals, conduct due diligence, and manage
investments directly, often with an external investment committee
All SSBCI programs required a minimum of 20 percent matching private capital at risk in all
transactions, and states targeted an overall private leverage ratio of 10 to 1. Within VCPs, the structural
categories attracted various sources of private capital. Overall, angel investors and in-state venture
funds were the most active co-investors in SSBCI venture capital transactions.
13 Primary source of co-investment was an optional data eld. In total, 21 of the 36 states with active VCPs reported data on
the primary source of co-investment, representing a total of 898 transactions, or over 55 percent of the total 1,623 SSBCI
VCP transactions.
Figure 19: Venture Capital Program Allocations by Category
VCP Category SSBCI Allocation ($ millions)
State Sponsored Entities (36%)
Co-Investment Models (11%)
State Agencies (6%)
Funds (46%)
Funds $197.8
State Supported Entities $156.7
Co-Investment Models $49.0
State Agencies $27.6
Total $431.1
Figure 20: Most Active Primary Co-Investor Type per Venture Capital Program
Category, by number of transactions
13
Venture Capital Program Category Most Active Primary Co-Investor Type
Funds Angel Investors
State-Sponsored Entities (SSE) Angel Investors
Co-Investment Models In-State Venture Capital Fund
State Agencies In-State Venture Capital Fund

SSBCI: Summary of States’ 2016 Annual Reports
20
PROGRAM PERFORMANCE
According to the National Venture Capital Association’s 2017 Yearbook, California, Massachusetts, and
New York account for 75 percent of U.S. venture capital dollars invested and 52 percent of total deals
in the U.S. The top ve states by the number of SSBCI VCP investments were Arkansas, Hawaii, Indiana,
Missouri, and New York. Together these ve states were responsible for 610 investments representing
over one third of the total 1,623 SSBCI-supported venture capital investments in small businesses.
Figure 21: SSBCI-Supported Venture Capital Investments Across the United States
* The Municipality of Anchorage, Hawaii, and Puerto Rico also expended SSBCI funds in VCPs, totaling $1.3 million, $5.2 million, and $1 million, respectively.
SSBCI: Summary of States’ 2016 Annual Reports
21
PROGRAM PERFORMANCE
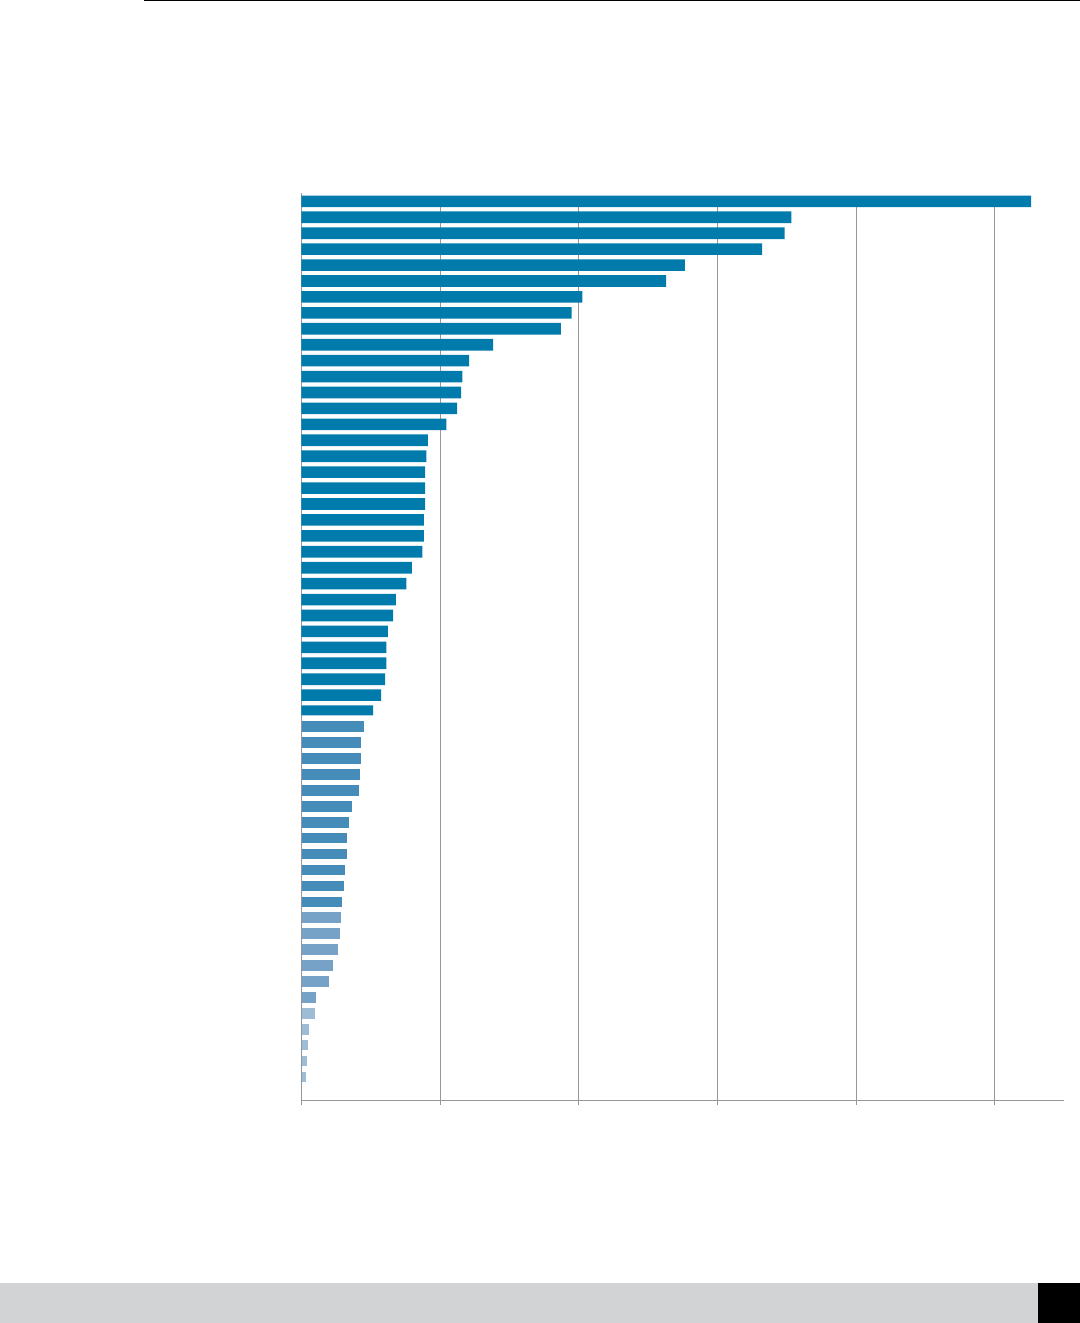
Performance by State
This section breaks down performance by state. The charts show the total nancing supported by
SSBCI funds by state and each state’s leverage ratio.
Figure 22: Amount of Financing (in millions) Supported by SSBCI by State
American Samoa
Alaska—Anchorage
North Dakota—Carrington
Northern Mariana Islands
Guam
U.S. Virgin Islands
District of Columbia
Nevada
Iowa
New Mexico
Louisiana
Maine
Wyoming—Laramie
Utah
Delaware
Puerto Rico
South Dakota
Indiana
Connecticut
Arizona
North Dakota—Mandan
Mississippi
Oklahoma
Nebraska
West Virginia
Virginia
Montana
Rhode Island
Kentucky
New Jersey
Massachusetts
Colorado
Wisconsin
Tennessee
Minnesota
South Carolina
New Hampshire
Vermont
Ohio
Washington
Oregon
Hawaii
Idaho
Arkansas
Alabama
Kansas
Pennsylvania
Georgia
Missouri
Florida
Maryland
Michigan
Texas
Illinois
New York
California
North Carolina
$0
$7
$8
$9
$10
$19
$20
$39
$46
$52
$56
$57
$59
$62
$63
$65
$66
$68
$73
$83
$84
$85
$86
$91
$103
$115
$121
$121
$122
$124
$133
$135
$152
$160
$175
$175
$177
$177
$178
$179
$179
$182
$208
$224
$231
$232
$241
$276
$374
$389
$405
$525
$553
$664
$697
$707
$1,052
0 200 400 600 800 1000
New Financing ($ millions)

SSBCI: Summary of States’ 2016 Annual Reports
22
PROGRAM PERFORMANCE
Figure 23: Leverage Ratios for Each State
Ohio
Utah
American Samoa
Guam
Northern Mariana Islands
District of Columbia
North Dakota
U.S. Virgin Islands
Indiana
Puerto Rico
Nevada
Arizona
Wyoming—Laramie
New Jersey
Alaska—Anchorage
Florida
Iowa
Tennessee
Connecticut
Louisiana
New Mexico
Massachusetts
Georgia
Virginia
Delaware
Maine
Michigan
Oklahoma
Mississippi
Nebraska
California
Colorado
Alabama
South Dakota
West Virginia
Kentucky
North Dakota—Mandan
South Carolina
Montana
Illinois
Washington
Oregon
Wisconsin
Pennsylvania
Vermont
Texas
New Hamphire
Rhode Island
Minnesota
North Carolina
Missouri
Idaho
New York
Arkansas
Kansas
Hawaii
Maryland
0.00 x
1.89 x
2.10 x
2.31 x
2.77 x
2.78 x
3.47 x
4.12 x
4.44 x
4.52 x
4.69 x
4.78 x
4.89 x
5.16 x
5.29 x
5.57 x
5.57 x
6.17 x
6.46 x
6.61 x
6.62 x
6.67 x
6.77 x
6.83 x
7.11 x
7.19 x
7.20 x
7.24 x
7.46 x
7.58 x
7.76 x
8.05 x
8.11x
8.22 x
8.35 x
8.37 x
8.85 x
9.70 x
9.83 x
9.84 x
10.52 x
11.14 x
11.53 x
13.17 x
13.63 x
13.84 x
14.04 x
15.22 x
15.30 x
15.95 x
16.34 x
16.45 x
16.88 x
17.93 x
18.64 x
29.36 x
34.72 x
0.00 x 5.00 x 10.00 x 15.00 x 20.00 x 25.00 x 30.00 x 35.00 x
Leverage Ratio

SSBCI: Summary of States’ 2016 Annual Reports
23
PROGRAM PERFORMANCE
Measuring Losses and Economic Development
This report does not present the aggregate nancial performance of state programs due to data
constraints. Nevertheless, data from states’ nal narratives, as well as the optional data reported by
some states provides a starting point for further inquiry.
States were required to submit a nal narrative at the end of the program, providing written response
to program evaluation questions. Among those questions, states were required to report data on
losses in excess of 50 percent of the original loan or investment amount. Where possible, this data was
supplemented by loss data collected through the optional data collection.
14
In total, states reported $16.4 million in losses or 1.2 percent of total SSBCI dollars expended in lending
programs. It is important to note that these gures represent a point in time and that programs will
continue to generate income and experience losses after SSBCI sunsets.
It is also important to note that in CAPs, states use SSBCI dollars to contribute a small percentage of a
loan—typically 2–5 percent on any one transaction—to a loan loss reserve, which is available to cover
up to 100 percent of any loans in the portfolio. This structure gives lenders an incentive to conduct
an increased quantity of loans to build up the reserve, while also ensuring the state’s liability is never
more than the xed 2–5 percent of total lending the program enables. However, this structure also
means SSBCI dollars lost as a percentage of SSBCI dollars expended tends to be high in CAPs despite
the relatively low percentage of transactions recording losses.
Venture capital funds assess nancial performance in terms of the net returns on investment over the life of
the fund. Because funds have a 10–15 year lifecycle, this report cannot present the nancial performance
of VCPs. However, states with VCPs did report data on losses through the nal narrative and optional data
collection.
15
This data is more complex due to variance in states management and reporting of losses in
14 In total, 32 states with lending programs reported on SSBCI dollars lost, of which 20 states reported having transactions
with losses. Those 32 states represented 15,707 transactions, or approximately 77 percent of all SSBCI lending transactions.
In dierence to the Final Narrative, optional data collected on SSBCI losses was inclusive of all losses, including losses less
than 50 percent of the original loan or investment amount.
15 In total, 20 states with VCPs reported on SSBCI dollars lost, of which 18 states reported having transactions with losses.
Those states represented 825 transactions, or approximately 51 percent of all SSBCI venture capital transactions. In
dierence to the Final Narrative, optional data collected on SSBCI losses was inclusive of all losses, including losses less
than 50 percent of the original loan or investment amount.
Figure 24: Loss Percentages by Loan Program Type
Program Type
SSBCI Losses
SSBCI Program Activity
(Including Recycled Dollars) Losses as Percent of Activity
Amount
($ millions)
Number of
Transactions
Amount
($ millions)
Number of
Transactions
Dollar Amount
(%)
Number of
Transactions (%)
CAP $2.5 388 $24.5 13,965 10.4 2.8
Collateral Support $2.8 23 $275.2 1,530 1.0 1.5
Loan Guarantee $5.4 44 $245.4 2,779 2.2 1.6
Loan Participation $5.7 41 $496.4 2,065 1.1 2.0
Total $16.4 496 $1,364.3 20,339 1.2 2.4

SSBCI: Summary of States’ 2016 Annual Reports
24
PROGRAM PERFORMANCE
VCPs. However, many of these states also reported on whether or not their portfolio companies were still in
operation as of December 31, 2016.
16
In total, these states reported that 157 transactions, or approximately
9.7 percent of total SSBCI venture capital transactions, were in companies that had ceased operation as of
the end of 2016. Ultimately, given that the participating funds are in the rst to sixth year of the lifecycle,
these data are not conclusive. Funds generate most of their returns from a minority of investments and a
valid measure of performance—net gain or loss—can only take place at the end of a fund’s life cycle.
In addition to nancial performance, state programs assess performance based on economic
development impacts such as jobs created and increased tax revenues. The data currently available
is not sucient to conrm job and revenue growth over time. However, SSBCI has matched rm
identiers reported through the optional data collection with the U.S. Census Bureau’s Longitudinal
Business Database, which utilizes IRS tax lings to track rm performance, such as jobs and revenues,
over time. The matched dataset is available to eligible researchers
17
through the Census Bureau’s
Federal Statistical Research Data Centers.
16 In total, 24 states with VCPs reported on active operations status. Those 24 states that reported active operation status
represented 1,067 transactions, or approximately 65.7 percent of all SSBCI venture capital transactions.
17 Researchers interested in gaining access to the matched dataset of SSBCI transactions and IRS tax lings providing
measurement of rm performance over time must obtain Special Sworn Status from the U.S. Census Bureau, passing a
background check and signing sworn agreements to protect condentiality for life, facing legal and nancial penalties
under Title 13 and Title 26 for failure to do so. Approved researchers must further submit a project proposal demonstrating
the need and use for the data to the U.S. Census Bureau for approval. All data is condential and cannot be accessed
outside of the Federal Statistical Research Data Centers.

SSBCI: Summary of States’ 2016 Annual Reports
25
APPENDIX A
Appendix A: State-by-State Results
Alabama
Allocation Amount: $31,443,076
Number of Loans/Investments 582
SSBCI Original Allocated Funds Expended $29,241,658
SSBCI Recycled Funds Expended $46,584,781
Total New Financing to Small Businesses $230,994,466
Leverage Ratio 7.90x
Transaction Size and Demographics
Median Principal Loan/Investment Size $150,000
Minimum Principal Loan/Investment Size $3,000
Maximum Principal Loan/Investment Size $5,000,000
LMI Census Tracts (by Number of Transactions) 33.8%
LMI Census Tracts (by Dollar Amount) 33.8%
Non-Metro Areas (by Number of Transactions) 43.1%
Non-Metro Areas (by Dollar Amount) 30.9%
Business Age and Size
Median Business Age at Loan/Investment 3
Median Business Size (FTEs) 3
Median Business Size (Annual Revenue) $254,156
Total Number of Jobs Created or Retained 6,533
Jobs Created 2,404
Jobs Retained 4,129
Top 3 Industries by Number of Transactions
Retail Trade 92
Manufacturing 69
Health Care and Social Assistance 57
Top 3 Industries by Dollar Amount
Retail Trade $36,200,264
Manufacturing $28,294,615
Health Care and Social Assistance $23,345,842
Lender Participation
Small Lenders* (by Number of Transactions) 86.3%
Small Lenders (by Dollar Amount) 68.6%
* Includes Banks, Credit Unions, CDFIs, and Non-Financial Institution Lenders
with assets less than or equal to $1.22B
Arizona
Allocation Amount: $18,286,556
Number of Loans/Investments 61
SSBCI Original Allocated Funds Expended $18,286,556
SSBCI Recycled Funds Expended $2,201,144
Total New Financing to Small Businesses $82,710,192
Leverage Ratio 4.52x
Transaction Size and Demographics
Median Principal Loan/Investment Size $721,000
Minimum Principal Loan/Investment Size $61,709
Maximum Principal Loan/Investment Size $9,319,367
LMI Census Tracts (by Number of Transactions) 50.8%
LMI Census Tracts (by Dollar Amount) 37.9%
Non-Metro Areas (by Number of Transactions) 1.6%
Non-Metro Areas (by Dollar Amount) 9.0%
Business Age and Size
Median Business Age at Loan/Investment 5
Median Business Size (FTEs) 15
Median Business Size (Annual Revenue) $1,283,335
Total Number of Jobs Created or Retained 3,924
Jobs Created 2,445
Jobs Retained 1,479
Top 3 Industries by Number of Transactions
Manufacturing 16
Professional, Scientic, and Technical Services 8
Construction 8
Health Care and Social Assistance 8
Top 3 Industries by Dollar Amount
Manufacturing $20,939,839
Health Care and Social Assistance $13,078,476
Construction $8,554,046
Lender Participation
Small Lenders* (by Number of Transactions) 68.9%
Small Lenders (by Dollar Amount) 75.1%
* Includes Banks, Credit Unions, CDFIs, and Non-Financial Institution Lenders
with assets less than or equal to $1.22B

SSBCI: Summary of States’ 2016 Annual Reports
26
APPENDIX A
Arkansas
Allocation Amount: $13,227,911
Number of Loans/Investments 284
SSBCI Original Allocated Funds Expended $12,885,729
SSBCI Recycled Funds Expended $2,191,101
Total New Financing to Small Businesses $223,822,458
Leverage Ratio 17.37x
Transaction Size and Demographics
Median Principal Loan/Investment Size $30,000
Minimum Principal Loan/Investment Size $1,000
Maximum Principal Loan/Investment Size $12,490,000
LMI Census Tracts (by Number of Transactions) 43.0%
LMI Census Tracts (by Dollar Amount) 64.4%
Non-Metro Areas (by Number of Transactions) 12.7%
Non-Metro Areas (by Dollar Amount) 15.2%
Business Age and Size
Median Business Age at Loan/Investment 1
Median Business Size (FTEs) 2
Median Business Size (Annual Revenue) $25,000
Total Number of Jobs Created or Retained 1,776
Jobs Created 1,409
Jobs Retained 367
Top 3 Industries by Number of Transactions
Professional, Scientic, and Technical Services 83
Manufacturing 50
Retail Trade 46
Top 3 Industries by Dollar Amount
Retail Trade $99,417,101
Manufacturing $75,979,360
Professional, Scientic, and Technical Services $28,148,201
Lender Participation
Small Lenders* (by Number of Transactions) 47.9%
Small Lenders (by Dollar Amount) 30.7%
* Includes Banks, Credit Unions, CDFIs, and Non-Financial Institution Lenders
with assets less than or equal to $1.22B
California
Allocation Amount: $168,399,074
Number of Loans/Investments 10,286
SSBCI Original Allocated Funds Expended $139,805,884
SSBCI Recycled Funds Expended $10,810,456
Total New Financing to Small Businesses $1,051,906,582
Leverage Ratio 7.52x
Transaction Size and Demographics
Median Principal Loan/Investment Size $12,000
Minimum Principal Loan/Investment Size $500
Maximum Principal Loan/Investment Size $10,000,000
LMI Census Tracts (by Number of Transactions) 50.3%
LMI Census Tracts (by Dollar Amount) 39.8%
Non-Metro Areas (by Number of Transactions) 0.9%
Non-Metro Areas (by Dollar Amount) 0.8%
Business Age and Size
Median Business Age at Loan/Investment 5
Median Business Size (FTEs) 2
Median Business Size (Annual Revenue) $144,000
Total Number of Jobs Created or Retained 92,533
Jobs Created 14,233
Jobs Retained 78,300
Top 3 Industries by Number of Transactions
Retail Trade 2,262
Accommodation and Food Services 1,465
Transportation and Warehousing 1,299
Top 3 Industries by Dollar Amount
Accommodation and Food Services $135,432,512
Manufacturing $133,870,804
Retail Trade $120,891,706
Lender Participation
Small Lenders* (by Number of Transactions) 93.2%
Small Lenders (by Dollar Amount) 64.6%
* Includes Banks, Credit Unions, CDFIs, and Non-Financial Institution Lenders
with assets less than or equal to $1.22B

SSBCI: Summary of States’ 2016 Annual Reports
27
APPENDIX A
Colorado
Allocation Amount: $17,311,437
Number of Loans/Investments 219
SSBCI Original Allocated Funds Expended $17,234,247
SSBCI Recycled Funds Expended $3,858,552
Total New Financing to Small Businesses $135,061,244
Leverage Ratio 7.84x
Transaction Size and Demographics
Median Principal Loan/Investment Size $170,000
Minimum Principal Loan/Investment Size $2,500
Maximum Principal Loan/Investment Size $11,300,000
LMI Census Tracts (by Number of Transactions) 43.8%
LMI Census Tracts (by Dollar Amount) 37.5%
Non-Metro Areas (by Number of Transactions) 41.6%
Non-Metro Areas (by Dollar Amount) 19.1%
Business Age and Size
Median Business Age at Loan/Investment 4
Median Business Size (FTEs) 2
Median Business Size (Annual Revenue) $240,386
Total Number of Jobs Created or Retained 1,471
Jobs Created 989
Jobs Retained 482
Top 3 Industries by Number of Transactions
Accommodation and Food Services 41
Health Care and Social Assistance 31
Retail Trade 26
Top 3 Industries by Dollar Amount
Health Care and Social Assistance $31,019,500
Arts, Entertainment, and Recreation $15,869,232
Manufacturing $14,979,348
Lender Participation
Small Lenders* (by Number of Transactions) 78.5%
Small Lenders (by Dollar Amount) 47.4%
* Includes Banks, Credit Unions, CDFIs, and Non-Financial Institution Lenders
with assets less than or equal to $1.22B
Connecticut
Allocation Amount: $13,361,288
Number of Loans/Investments 19
SSBCI Original Allocated Funds Expended $11,801,125
SSBCI Recycled Funds Expended $0
Total New Financing to Small Businesses $72,775,738
Leverage Ratio 6.17x
Transaction Size and Demographics
Median Principal Loan/Investment Size $1,775,850
Minimum Principal Loan/Investment Size $250,009
Maximum Principal Loan/Investment Size $10,000,000
LMI Census Tracts (by Number of Transactions) 36.8%
LMI Census Tracts (by Dollar Amount) 23.7%
Non-Metro Areas (by Number of Transactions) 0.0%
Non-Metro Areas (by Dollar Amount) 0.0%
Business Age and Size
Median Business Age at Loan/Investment 5
Median Business Size (FTEs) 5
Median Business Size (Annual Revenue) $0
Total Number of Jobs Created or Retained 271
Jobs Created 96
Jobs Retained 175
Top 3 Industries by Number of Transactions
Manufacturing 6
Professional, Scientic, and Technical Services 4
Wholesale Trade 3
Information 3
Top 3 Industries by Dollar Amount
Wholesale Trade $25,416,800
Manufacturing $15,120,250
Information $11,754,314
Lender Participation
Small Lenders* (by Number of Transactions) 0.0%
Small Lenders (by Dollar Amount) 0.0%
* Includes Banks, Credit Unions, CDFIs, and Non-Financial Institution Lenders
with assets less than or equal to $1.22B

SSBCI: Summary of States’ 2016 Annual Reports
28
APPENDIX A
Delaware
Allocation Amount: $13,227,911
Number of Loans/Investments 127
SSBCI Original Allocated Funds Expended $9,234,130
SSBCI Recycled Funds Expended $0
Total New Financing to Small Businesses $63,023,122
Leverage Ratio 6.83x
Transaction Size and Demographics
Median Principal Loan/Investment Size $61,900
Minimum Principal Loan/Investment Size $7,000
Maximum Principal Loan/Investment Size $20,000,000
LMI Census Tracts (by Number of Transactions) 28.3%
LMI Census Tracts (by Dollar Amount) 24.7%
Non-Metro Areas (by Number of Transactions) 29.1%
Non-Metro Areas (by Dollar Amount) 59.3%
Business Age and Size
Median Business Age at Loan/Investment 3
Median Business Size (FTEs) 3
Median Business Size (Annual Revenue) $176,418
Total Number of Jobs Created or Retained 1,606
Jobs Created 569
Jobs Retained 1,037
Top 3 Industries by Number of Transactions
Accommodation and Food Services 24
Retail Trade 18
Health Care and Social Assistance 13
Top 3 Industries by Dollar Amount
Accommodation and Food Services $27,608,843
Manufacturing $6,055,225
Finance and Insurance $5,652,650
Lender Participation
Small Lenders* (by Number of Transactions) 53.5%
Small Lenders (by Dollar Amount) 22.1%
* Includes Banks, Credit Unions, CDFIs, and Non-Financial Institution Lenders
with assets less than or equal to $1.22B
District of Columbia
Allocation Amount: $13,227,911
Number of Loans/Investments 33
SSBCI Original Allocated Funds Expended $8,910,279
SSBCI Recycled Funds Expended $0
Total New Financing to Small Businesses $20,268,500
Leverage Ratio 2.27x
Transaction Size and Demographics
Median Principal Loan/Investment Size $500,000
Minimum Principal Loan/Investment Size $25,000
Maximum Principal Loan/Investment Size $2,500,000
LMI Census Tracts (by Number of Transactions) 45.5%
LMI Census Tracts (by Dollar Amount) 58.3%
Non-Metro Areas (by Number of Transactions) 0.0%
Non-Metro Areas (by Dollar Amount) 0.0%
Business Age and Size
Median Business Age at Loan/Investment 7
Median Business Size (FTEs) 9
Median Business Size (Annual Revenue) $2,169,234
Total Number of Jobs Created or Retained 791
Jobs Created 165
Jobs Retained 626
Top 3 Industries by Number of Transactions
Construction 8
Accommodation and Food Services 6
Other Services (except Public Administration) 4
Manufacturing 4
Top 3 Industries by Dollar Amount
Construction $8,456,500
Utilities $3,100,000
Other Services (except Public Administration) $2,790,000
Lender Participation
Small Lenders* (by Number of Transactions) 84.8%
Small Lenders (by Dollar Amount) 86.5%
* Includes Banks, Credit Unions, CDFIs, and Non-Financial Institution Lenders
with assets less than or equal to $1.22B

SSBCI: Summary of States’ 2016 Annual Reports
29
APPENDIX A
Florida
Allocation Amount: $98,104,081
Number of Loans/Investments 278
SSBCI Original Allocated Funds Expended $76,229,668
SSBCI Recycled Funds Expended $32,914,972
Total New Financing to Small Businesses $389,390,741
Leverage Ratio 5.11x
Transaction Size and Demographics
Median Principal Loan/Investment Size $300,750
Minimum Principal Loan/Investment Size $2,500
Maximum Principal Loan/Investment Size $17,629,650
LMI Census Tracts (by Number of Transactions) 41.0%
LMI Census Tracts (by Dollar Amount) 36.5%
Non-Metro Areas (by Number of Transactions) 2.9%
Non-Metro Areas (by Dollar Amount) 4.0%
Business Age and Size
Median Business Age at Loan/Investment 4
Median Business Size (FTEs) 4
Median Business Size (Annual Revenue) $222,588
Total Number of Jobs Created or Retained 4,373
Jobs Created 3,300
Jobs Retained 1,073
Top 3 Industries by Number of Transactions
Information 35
Manufacturing 34
Accommodation and Food Services 27
Top 3 Industries by Dollar Amount
Accommodation and Food Services $91,175,292
Information $80,375,536
Manufacturing $60,319,728
Lender Participation
Small Lenders* (by Number of Transactions) 60.8%
Small Lenders (by Dollar Amount) 36.6%
* Includes Banks, Credit Unions, CDFIs, and Non-Financial Institution Lenders
with assets less than or equal to $1.22B
Georgia
Allocation Amount: $48,024,748
Number of Loans/Investments 499
SSBCI Original Allocated Funds Expended $43,172,047
SSBCI Recycled Funds Expended $4,521,550
Total New Financing to Small Businesses $276,185,161
Leverage Ratio 6.40x
Transaction Size and Demographics
Median Principal Loan/Investment Size $200,000
Minimum Principal Loan/Investment Size $5,000
Maximum Principal Loan/Investment Size $13,200,000
LMI Census Tracts (by Number of Transactions) 33.5%
LMI Census Tracts (by Dollar Amount) 34.5%
Non-Metro Areas (by Number of Transactions) 10.4%
Non-Metro Areas (by Dollar Amount) 14.6%
Business Age and Size
Median Business Age at Loan/Investment 5
Median Business Size (FTEs) 4
Median Business Size (Annual Revenue) $150,000
Total Number of Jobs Created or Retained 4,027
Jobs Created 2,200
Jobs Retained 1,827
Top 3 Industries by Number of Transactions
Professional, Scientic, and Technical Services 143
Construction 68
Manufacturing 62
Top 3 Industries by Dollar Amount
Accommodation and Food Services $77,392,278
Professional, Scientic, and Technical Services $29,156,768
Real Estate and Rental and Leasing $26,563,439
Lender Participation
Small Lenders* (by Number of Transactions) 97.2%
Small Lenders (by Dollar Amount) 96.0%
* Includes Banks, Credit Unions, CDFIs, and Non-Financial Institution Lenders
with assets less than or equal to $1.22B

SSBCI: Summary of States’ 2016 Annual Reports
30
APPENDIX A
Hawaii
Allocation Amount: $13,227,911
Number of Loans/Investments 120
SSBCI Original Allocated Funds Expended $5,476,683
SSBCI Recycled Funds Expended $0
Total New Financing to Small Businesses $181,849,084
Leverage Ratio 33.20x
Transaction Size and Demographics
Median Principal Loan/Investment Size $25,000
Minimum Principal Loan/Investment Size $10,000
Maximum Principal Loan/Investment Size $15,000,000
LMI Census Tracts (by Number of Transactions) 28.3%
LMI Census Tracts (by Dollar Amount) 25.1%
Non-Metro Areas (by Number of Transactions) 10.0%
Non-Metro Areas (by Dollar Amount) 3.2%
Business Age and Size
Median Business Age at Loan/Investment 0
Median Business Size (FTEs) 3
Median Business Size (Annual Revenue) $0
Total Number of Jobs Created or Retained 678
Jobs Created 159
Jobs Retained 520
Top 3 Industries by Number of Transactions
Information 76
Professional, Scientic, and Technical Services 10
Manufacturing 9
Top 3 Industries by Dollar Amount
Information $57,351,974
Professional, Scientic, and Technical Services $50,529,919
Manufacturing $27,114,800
Lender Participation
Small Lenders* (by Number of Transactions) 0.0%
Small Lenders (by Dollar Amount) 0.0%
* Includes Banks, Credit Unions, CDFIs, and Non-Financial Institution Lenders
with assets less than or equal to $1.22B
Idaho
Allocation Amount: $13,195,667
Number of Loans/Investments 315
SSBCI Original Allocated Funds Expended $13,136,543
SSBCI Recycled Funds Expended $10,559,488
Total New Financing to Small Businesses $208,186,678
Leverage Ratio 15.85x
Transaction Size and Demographics
Median Principal Loan/Investment Size $350,000
Minimum Principal Loan/Investment Size $4,765
Maximum Principal Loan/Investment Size $5,000,000
LMI Census Tracts (by Number of Transactions) 26.7%
LMI Census Tracts (by Dollar Amount) 28.9%
Non-Metro Areas (by Number of Transactions) 30.5%
Non-Metro Areas (by Dollar Amount) 27.7%
Business Age and Size
Median Business Age at Loan/Investment 6
Median Business Size (FTEs) 8
Median Business Size (Annual Revenue) $969,169
Total Number of Jobs Created or Retained 3,081
Jobs Created 1,051
Jobs Retained 2,030
Top 3 Industries by Number of Transactions
Health Care and Social Assistance 56
Retail Trade 42
Manufacturing 42
Top 3 Industries by Dollar Amount
Health Care and Social Assistance $46,408,816
Manufacturing $34,400,292
Retail Trade $24,676,978
Lender Participation
Small Lenders* (by Number of Transactions) 56.8%
Small Lenders (by Dollar Amount) 44.6%
* Includes Banks, Credit Unions, CDFIs, and Non-Financial Institution Lenders
with assets less than or equal to $1.22B

SSBCI: Summary of States’ 2016 Annual Reports
31
APPENDIX A
Illinois
Allocation Amount: $78,719,715
Number of Loans/Investments 240
SSBCI Original Allocated Funds Expended $70,374,955
SSBCI Recycled Funds Expended $4,450,000
Total New Financing to Small Businesses $663,822,904
Leverage Ratio 9.43x
Transaction Size and Demographics
Median Principal Loan/Investment Size $488,955
Minimum Principal Loan/Investment Size $7,500
Maximum Principal Loan/Investment Size $12,728,800
LMI Census Tracts (by Number of Transactions) 32.9%
LMI Census Tracts (by Dollar Amount) 44.5%
Non-Metro Areas (by Number of Transactions) 13.3%
Non-Metro Areas (by Dollar Amount) 7.5%
Business Age and Size
Median Business Age at Loan/Investment 6
Median Business Size (FTEs) 10
Median Business Size (Annual Revenue) $1,066,995
Total Number of Jobs Created or Retained 4,427
Jobs Created 2,957
Jobs Retained 1,470
Top 3 Industries by Number of Transactions
Manufacturing 73
Accommodation and Food Services 28
Professional, Scientic, and Technical Services 26
Top 3 Industries by Dollar Amount
Manufacturing $267,316,649
Wholesale Trade $126,301,007
Professional, Scientic, and Technical Services $61,837,773
Lender Participation
Small Lenders* (by Number of Transactions) 77.1%
Small Lenders (by Dollar Amount) 53.2%
* Includes Banks, Credit Unions, CDFIs, and Non-Financial Institution Lenders
with assets less than or equal to $1.22B
Indiana
Allocation Amount: $34,494,392
Number of Loans/Investments 241
SSBCI Original Allocated Funds Expended $20,238,651
SSBCI Recycled Funds Expended $0
Total New Financing to Small Businesses $67,902,490
Leverage Ratio 3.36x
Transaction Size and Demographics
Median Principal Loan/Investment Size $100,000
Minimum Principal Loan/Investment Size $3,000
Maximum Principal Loan/Investment Size $5,136,000
LMI Census Tracts (by Number of Transactions) 30.7%
LMI Census Tracts (by Dollar Amount) 18.8%
Non-Metro Areas (by Number of Transactions) 7.1%
Non-Metro Areas (by Dollar Amount) 7.1%
Business Age and Size
Median Business Age at Loan/Investment 4
Median Business Size (FTEs) 5
Median Business Size (Annual Revenue) $349,000
Total Number of Jobs Created or Retained 1,294
Jobs Created 613
Jobs Retained 681
Top 3 Industries by Number of Transactions
Retail Trade 43
Professional, Scientic, and Technical Services 30
Construction 29
Top 3 Industries by Dollar Amount
Professional, Scientic, and Technical Services $13,961,836
Information $11,235,109
Manufacturing $10,709,720
Lender Participation
Small Lenders* (by Number of Transactions) 44.0%
Small Lenders (by Dollar Amount) 10.5%
* Includes Banks, Credit Unions, CDFIs, and Non-Financial Institution Lenders
with assets less than or equal to $1.22B

SSBCI: Summary of States’ 2016 Annual Reports
32
APPENDIX A
Iowa
Allocation Amount: $13,123,161
Number of Loans/Investments 45
SSBCI Original Allocated Funds Expended $8,398,788
SSBCI Recycled Funds Expended $0
Total New Financing to Small Businesses $45,866,763
Leverage Ratio 5.46x
Transaction Size and Demographics
Median Principal Loan/Investment Size $200,000
Minimum Principal Loan/Investment Size $6,000
Maximum Principal Loan/Investment Size $2,000,000
LMI Census Tracts (by Number of Transactions) 26.7%
LMI Census Tracts (by Dollar Amount) 6.3%
Non-Metro Areas (by Number of Transactions) 15.6%
Non-Metro Areas (by Dollar Amount) 2.2%
Business Age and Size
Median Business Age at Loan/Investment 2
Median Business Size (FTEs) 4
Median Business Size (Annual Revenue) $64,125
Total Number of Jobs Created or Retained 506
Jobs Created 303
Jobs Retained 204
Top 3 Industries by Number of Transactions
Manufacturing 10
Information 9
Professional, Scientic, and Technical Services 8
Top 3 Industries by Dollar Amount
Manufacturing $34,709,300
Professional, Scientic, and Technical Services $4,788,650
Information $3,959,100
Lender Participation
Small Lenders* (by Number of Transactions) 37.8%
Small Lenders (by Dollar Amount) 1.4%
* Includes Banks, Credit Unions, CDFIs, and Non-Financial Institution Lenders
with assets less than or equal to $1.22B
Kansas
Allocation Amount: $13,227,911
Number of Loans/Investments 92
SSBCI Original Allocated Funds Expended $12,770,943
SSBCI Recycled Funds Expended $1,255,243
Total New Financing to Small Businesses $231,571,176
Leverage Ratio 18.13x
Transaction Size and Demographics
Median Principal Loan/Investment Size $1,605,500
Minimum Principal Loan/Investment Size $154,000
Maximum Principal Loan/Investment Size $12,852,843
LMI Census Tracts (by Number of Transactions) 35.9%
LMI Census Tracts (by Dollar Amount) 41.9%
Non-Metro Areas (by Number of Transactions) 35.9%
Non-Metro Areas (by Dollar Amount) 41.8%
Business Age and Size
Median Business Age at Loan/Investment 3
Median Business Size (FTEs) 7
Median Business Size (Annual Revenue) $237,688
Total Number of Jobs Created or Retained 1,769
Jobs Created 1,248
Jobs Retained 521
Top 3 Industries by Number of Transactions
Manufacturing 25
Accommodation and Food Services 17
Professional, Scientic, and Technical Services 9
Top 3 Industries by Dollar Amount
Manufacturing $56,771,917
Accommodation and Food Services $52,844,713
Agriculture, Forestry, Fishing and Hunting $30,685,569
Lender Participation
Small Lenders* (by Number of Transactions) 57.6%
Small Lenders (by Dollar Amount) 49.4%
* Includes Banks, Credit Unions, CDFIs, and Non-Financial Institution Lenders
with assets less than or equal to $1.22B

SSBCI: Summary of States’ 2016 Annual Reports
33
APPENDIX A
Kentucky
Allocation Amount: $15,558,051
Number of Loans/Investments 161
SSBCI Original Allocated Funds Expended $14,707,486
SSBCI Recycled Funds Expended $0
Total New Financing to Small Businesses $122,151,772
Leverage Ratio 8.31x
Transaction Size and Demographics
Median Principal Loan/Investment Size $262,000
Minimum Principal Loan/Investment Size $25,000
Maximum Principal Loan/Investment Size $6,100,000
LMI Census Tracts (by Number of Transactions) 44.1%
LMI Census Tracts (by Dollar Amount) 51.3%
Non-Metro Areas (by Number of Transactions) 46.0%
Non-Metro Areas (by Dollar Amount) 50.4%
Business Age and Size
Median Business Age at Loan/Investment 5
Median Business Size (FTEs) 5
Median Business Size (Annual Revenue) $365,802
Total Number of Jobs Created or Retained 2,420
Jobs Created 1,122
Jobs Retained 1,298
Top 3 Industries by Number of Transactions
Manufacturing 24
Accommodation and Food Services 22
Retail Trade 19
Health Care and Social Assistance 19
Top 3 Industries by Dollar Amount
Manufacturing $38,486,408
Accommodation and Food Services $22,387,063
Health Care and Social Assistance $11,558,809
Lender Participation
Small Lenders* (by Number of Transactions) 72.7%
Small Lenders (by Dollar Amount) 69.7%
* Includes Banks, Credit Unions, CDFIs, and Non-Financial Institution Lenders
with assets less than or equal to $1.22B
Louisiana
Allocation Amount: $12,414,995
Number of Loans/Investments 85
SSBCI Original Allocated Funds Expended $8,822,637
SSBCI Recycled Funds Expended $0
Total New Financing to Small Businesses $55,645,857
Leverage Ratio 6.31x
Transaction Size and Demographics
Median Principal Loan/Investment Size $365,000
Minimum Principal Loan/Investment Size $25,000
Maximum Principal Loan/Investment Size $5,300,000
LMI Census Tracts (by Number of Transactions) 18.8%
LMI Census Tracts (by Dollar Amount) 16.6%
Non-Metro Areas (by Number of Transactions) 8.2%
Non-Metro Areas (by Dollar Amount) 14.8%
Business Age and Size
Median Business Age at Loan/Investment 2
Median Business Size (FTEs) 4
Median Business Size (Annual Revenue) $0
Total Number of Jobs Created or Retained 1,717
Jobs Created 918
Jobs Retained 800
Top 3 Industries by Number of Transactions
Manufacturing 17
Information 15
Professional, Scientic, and Technical Services 13
Top 3 Industries by Dollar Amount
Manufacturing $12,730,674
Information $9,836,050
Accommodation and Food Services $6,966,000
Lender Participation
Small Lenders* (by Number of Transactions) 38.8%
Small Lenders (by Dollar Amount) 35.3%
* Includes Banks, Credit Unions, CDFIs, and Non-Financial Institution Lenders
with assets less than or equal to $1.22B

SSBCI: Summary of States’ 2016 Annual Reports
34
APPENDIX A
Maine
Allocation Amount: $13,227,911
Number of Loans/Investments 74
SSBCI Original Allocated Funds Expended $8,323,874
SSBCI Recycled Funds Expended $0
Total New Financing to Small Businesses $57,357,394
Leverage Ratio 6.89x
Transaction Size and Demographics
Median Principal Loan/Investment Size $448,000
Minimum Principal Loan/Investment Size $73,774
Maximum Principal Loan/Investment Size $9,757,950
LMI Census Tracts (by Number of Transactions) 25.7%
LMI Census Tracts (by Dollar Amount) 31.2%
Non-Metro Areas (by Number of Transactions) 27.0%
Non-Metro Areas (by Dollar Amount) 19.5%
Business Age and Size
Median Business Age at Loan/Investment 3
Median Business Size (FTEs) 6
Median Business Size (Annual Revenue) $365,000
Total Number of Jobs Created or Retained 1,026
Jobs Created 334
Jobs Retained 692
Top 3 Industries by Number of Transactions
Manufacturing 11
Professional, Scientic, and Technical Services 11
Retail Trade 9
Top 3 Industries by Dollar Amount
Accommodation and Food Services $12,908,218
Manufacturing $12,687,230
Professional, Scientic, and Technical Services $7,208,372
Lender Participation
Small Lenders* (by Number of Transactions) 64.9%
Small Lenders (by Dollar Amount) 69.1%
* Includes Banks, Credit Unions, CDFIs, and Non-Financial Institution Lenders
with assets less than or equal to $1.22B
Maryland
Allocation Amount: $23,025,709
Number of Loans/Investments 55
SSBCI Original Allocated Funds Expended $14,125,270
SSBCI Recycled Funds Expended $0
Total New Financing to Small Businesses $405,245,372
Leverage Ratio 28.69x
Transaction Size and Demographics
Median Principal Loan/Investment Size $1,070,000
Minimum Principal Loan/Investment Size $52,000
Maximum Principal Loan/Investment Size $18,000,000
LMI Census Tracts (by Number of Transactions) 27.3%
LMI Census Tracts (by Dollar Amount) 39.4%
Non-Metro Areas (by Number of Transactions) 0.0%
Non-Metro Areas (by Dollar Amount) 0.0%
Business Age and Size
Median Business Age at Loan/Investment 6
Median Business Size (FTEs) 15
Median Business Size (Annual Revenue) $556,972
Total Number of Jobs Created or Retained 2,251
Jobs Created 1,073
Jobs Retained 1,178
Top 3 Industries by Number of Transactions
Professional, Scientic, and Technical Services 17
Information 13
Manufacturing 9
Top 3 Industries by Dollar Amount
Professional, Scientic, and Technical Services $206,406,076
Information $120,726,191
Retail Trade $27,062,000
Lender Participation
Small Lenders* (by Number of Transactions) 29.1%
Small Lenders (by Dollar Amount) 4.0%
* Includes Banks, Credit Unions, CDFIs, and Non-Financial Institution Lenders
with assets less than or equal to $1.22B

SSBCI: Summary of States’ 2016 Annual Reports
35
APPENDIX A
Massachusetts
Allocation Amount: $20,514,536
Number of Loans/Investments 1,015
SSBCI Original Allocated Funds Expended $20,514,536
SSBCI Recycled Funds Expended $4,428,770
Total New Financing to Small Businesses $132,907,299
Leverage Ratio 6.48x
Transaction Size and Demographics
Median Principal Loan/Investment Size $25,000
Minimum Principal Loan/Investment Size $1,000
Maximum Principal Loan/Investment Size $3,540,000
LMI Census Tracts (by Number of Transactions) 25.4%
LMI Census Tracts (by Dollar Amount) 29.2%
Non-Metro Areas (by Number of Transactions) 2.5%
Non-Metro Areas (by Dollar Amount) 3.8%
Business Age and Size
Median Business Age at Loan/Investment 6
Median Business Size (FTEs) 4
Median Business Size (Annual Revenue) $450,000
Total Number of Jobs Created or Retained 11,953
Jobs Created 1,295
Jobs Retained 10,658
Top 3 Industries by Number of Transactions
Retail Trade 183
Construction 129
Other Services (except Public Administration) 101
Top 3 Industries by Dollar Amount
Wholesale Trade $31,938,531
Retail Trade $21,619,729
Manufacturing $15,496,437
Lender Participation
Small Lenders* (by Number of Transactions) 69.0%
Small Lenders (by Dollar Amount) 87.7%
* Includes Banks, Credit Unions, CDFIs, and Non-Financial Institution Lenders
with assets less than or equal to $1.22B
Michigan
Allocation Amount: $79,515,777
Number of Loans/Investments 962
SSBCI Original Allocated Funds Expended $75,284,959
SSBCI Recycled Funds Expended $26,688,202
Total New Financing to Small Businesses $525,259,498
Leverage Ratio 6.98x
Transaction Size and Demographics
Median Principal Loan/Investment Size $50,000
Minimum Principal Loan/Investment Size $2,000
Maximum Principal Loan/Investment Size $20,000,000
LMI Census Tracts (by Number of Transactions) 33.6%
LMI Census Tracts (by Dollar Amount) 38.2%
Non-Metro Areas (by Number of Transactions) 40.2%
Non-Metro Areas (by Dollar Amount) 32.8%
Business Age and Size
Median Business Age at Loan/Investment 5
Median Business Size (FTEs) 4
Median Business Size (Annual Revenue) $300,000
Total Number of Jobs Created or Retained 11,216
Jobs Created 6,498
Jobs Retained 4,718
Top 3 Industries by Number of Transactions
Manufacturing 193
Retail Trade 118
Transportation and Warehousing 98
Top 3 Industries by Dollar Amount
Manufacturing $326,902,830
Wholesale Trade $35,783,016
Retail Trade $27,753,940
Lender Participation
Small Lenders* (by Number of Transactions) 40.0%
Small Lenders (by Dollar Amount) 28.5%
* Includes Banks, Credit Unions, CDFIs, and Non-Financial Institution Lenders
with assets less than or equal to $1.22B

SSBCI: Summary of States’ 2016 Annual Reports
36
APPENDIX A
Minnesota
Allocation Amount: $15,533,123
Number of Loans/Investments 292
SSBCI Original Allocated Funds Expended $11,886,737
SSBCI Recycled Funds Expended $543,943
Total New Financing to Small Businesses $174,918,405
Leverage Ratio 14.72x
Transaction Size and Demographics
Median Principal Loan/Investment Size $43,000
Minimum Principal Loan/Investment Size $1,800
Maximum Principal Loan/Investment Size $3,750,000
LMI Census Tracts (by Number of Transactions) 50.3%
LMI Census Tracts (by Dollar Amount) 39.9%
Non-Metro Areas (by Number of Transactions) 16.4%
Non-Metro Areas (by Dollar Amount) 24.8%
Business Age and Size
Median Business Age at Loan/Investment 4
Median Business Size (FTEs) 2
Median Business Size (Annual Revenue) $147,043
Total Number of Jobs Created or Retained 3,838
Jobs Created 1,302
Jobs Retained 2,537
Top 3 Industries by Number of Transactions
Manufacturing 51
Accommodation and Food Services 47
Construction 39
Top 3 Industries by Dollar Amount
Manufacturing $60,450,396
Accommodation and Food Services $33,461,577
Professional, Scientic, and Technical Services $15,547,699
Lender Participation
Small Lenders* (by Number of Transactions) 92.1%
Small Lenders (by Dollar Amount) 76.5%
* Includes Banks, Credit Unions, CDFIs, and Non-Financial Institution Lenders
with assets less than or equal to $1.22B
Mississippi
Allocation Amount: $13,227,911
Number of Loans/Investments 119
SSBCI Original Allocated Funds Expended $11,757,651
SSBCI Recycled Funds Expended $0
Total New Financing to Small Businesses $85,139,656
Leverage Ratio 7.24x
Transaction Size and Demographics
Median Principal Loan/Investment Size $459,135
Minimum Principal Loan/Investment Size $50,000
Maximum Principal Loan/Investment Size $6,000,000
LMI Census Tracts (by Number of Transactions) 27.7%
LMI Census Tracts (by Dollar Amount) 24.8%
Non-Metro Areas (by Number of Transactions) 47.1%
Non-Metro Areas (by Dollar Amount) 59.6%
Business Age and Size
Median Business Age at Loan/Investment 1
Median Business Size (FTEs) 2
Median Business Size (Annual Revenue) $0
Total Number of Jobs Created or Retained 1,008
Jobs Created 796
Jobs Retained 212
Top 3 Industries by Number of Transactions
Agriculture, Forestry, Fishing and Hunting 40
Retail Trade 18
Manufacturing 16
Top 3 Industries by Dollar Amount
Agriculture, Forestry, Fishing and Hunting $28,152,374
Manufacturing $22,200,102
Information $9,585,043
Lender Participation
Small Lenders* (by Number of Transactions) 82.4%
Small Lenders (by Dollar Amount) 77.7%
* Includes Banks, Credit Unions, CDFIs, and Non-Financial Institution Lenders
with assets less than or equal to $1.22B

SSBCI: Summary of States’ 2016 Annual Reports
37
APPENDIX A
Missouri
Allocation Amount: $27,052,101
Number of Loans/Investments 93
SSBCI Original Allocated Funds Expended $23,786,980
SSBCI Recycled Funds Expended $284,101
Total New Financing to Small Businesses $373,845,177
Leverage Ratio 15.72x
Transaction Size and Demographics
Median Principal Loan/Investment Size $500,000
Minimum Principal Loan/Investment Size $37,718
Maximum Principal Loan/Investment Size $8,158,170
LMI Census Tracts (by Number of Transactions) 47.3%
LMI Census Tracts (by Dollar Amount) 35.3%
Non-Metro Areas (by Number of Transactions) 2.2%
Non-Metro Areas (by Dollar Amount) 0.6%
Business Age and Size
Median Business Age at Loan/Investment 3
Median Business Size (FTEs) 2
Median Business Size (Annual Revenue) $0
Total Number of Jobs Created or Retained 1,612
Jobs Created 1,248
Jobs Retained 364
Top 3 Industries by Number of Transactions
Professional, Scientic, and Technical Services 50
Manufacturing 27
Information 10
Top 3 Industries by Dollar Amount
Manufacturing $136,461,105
Information $126,612,953
Professional, Scientic, and Technical Services $103,928,857
Lender Participation
Small Lenders* (by Number of Transactions) 2.2%
Small Lenders (by Dollar Amount) 2.5%
* Includes Banks, Credit Unions, CDFIs, and Non-Financial Institution Lenders
with assets less than or equal to $1.22B
Montana
Allocation Amount: $12,819,143
Number of Loans/Investments 50
SSBCI Original Allocated Funds Expended $12,769,806
SSBCI Recycled Funds Expended $0
Total New Financing to Small Businesses $120,918,506
Leverage Ratio 9.47x
Transaction Size and Demographics
Median Principal Loan/Investment Size $445,636
Minimum Principal Loan/Investment Size $150,000
Maximum Principal Loan/Investment Size $999,900
LMI Census Tracts (by Number of Transactions) 30.0%
LMI Census Tracts (by Dollar Amount) 33.4%
Non-Metro Areas (by Number of Transactions) 56.0%
Non-Metro Areas (by Dollar Amount) 35.5%
Business Age and Size
Median Business Age at Loan/Investment 11
Median Business Size (FTEs) 10
Median Business Size (Annual Revenue) $1,606,500
Total Number of Jobs Created or Retained 1,010
Jobs Created 825
Jobs Retained 185
Top 3 Industries by Number of Transactions
Retail Trade 10
Health Care and Social Assistance 8
Construction 7
Manufacturing 7
Top 3 Industries by Dollar Amount
Accommodation and Food Services $34,933,164
Manufacturing $34,118,447
Retail Trade $33,569,486
Lender Participation
Small Lenders* (by Number of Transactions) 66.0%
Small Lenders (by Dollar Amount) 65.9%
* Includes Banks, Credit Unions, CDFIs, and Non-Financial Institution Lenders
with assets less than or equal to $1.22B

SSBCI: Summary of States’ 2016 Annual Reports
38
APPENDIX A
Nebraska
Allocation Amount: $13,168,350
Number of Loans/Investments 54
SSBCI Original Allocated Funds Expended $12,435,104
SSBCI Recycled Funds Expended $1,513,156
Total New Financing to Small Businesses $90,644,327
Leverage Ratio 7.29x
Transaction Size and Demographics
Median Principal Loan/Investment Size $300,000
Minimum Principal Loan/Investment Size $20,000
Maximum Principal Loan/Investment Size $7,500,000
LMI Census Tracts (by Number of Transactions) 53.7%
LMI Census Tracts (by Dollar Amount) 30.0%
Non-Metro Areas (by Number of Transactions) 29.6%
Non-Metro Areas (by Dollar Amount) 75.3%
Business Age and Size
Median Business Age at Loan/Investment 0
Median Business Size (FTEs) 3
Median Business Size (Annual Revenue) $0
Total Number of Jobs Created or Retained 547
Jobs Created 352
Jobs Retained 195
Top 3 Industries by Number of Transactions
Professional, Scientic, and Technical Services 24
Manufacturing 15
Information 6
Top 3 Industries by Dollar Amount
Manufacturing $59,459,154
Professional, Scientic, and Technical Services $9,923,363
Transportation and Warehousing $8,521,000
Lender Participation
Small Lenders* (by Number of Transactions) 24.1%
Small Lenders (by Dollar Amount) 55.1%
* Includes Banks, Credit Unions, CDFIs, and Non-Financial Institution Lenders
with assets less than or equal to $1.22B
Nevada
Allocation Amount: $13,793,599
Number of Loans/Investments 22
SSBCI Original Allocated Funds Expended $9,037,468
SSBCI Recycled Funds Expended $0
Total New Financing to Small Businesses $38,925,560
Leverage Ratio 4.31x
Transaction Size and Demographics
Median Principal Loan/Investment Size $1,178,150
Minimum Principal Loan/Investment Size $40,000
Maximum Principal Loan/Investment Size $5,167,000
LMI Census Tracts (by Number of Transactions) 31.8%
LMI Census Tracts (by Dollar Amount) 21.6%
Non-Metro Areas (by Number of Transactions) 4.5%
Non-Metro Areas (by Dollar Amount) 15.6%
Business Age and Size
Median Business Age at Loan/Investment 2
Median Business Size (FTEs) 8
Median Business Size (Annual Revenue) $617,761
Total Number of Jobs Created or Retained 784
Jobs Created 483
Jobs Retained 301
Top 3 Industries by Number of Transactions
Administrative and Support and Waste Management
and Remediation Services 4
Professional, Scientic, and Technical Services 3
Retail Trade 3
Health Care and Social Assistance 3
Top 3 Industries by Dollar Amount
Health Care and Social Assistance $9,679,000
Accommodation and Food Services $6,082,000
Professional, Scientic, and Technical Services $6,070,000
Lender Participation
Small Lenders* (by Number of Transactions) 68.2%
Small Lenders (by Dollar Amount) 59.6%
* Includes Banks, Credit Unions, CDFIs, and Non-Financial Institution Lenders
with assets less than or equal to $1.22B

SSBCI: Summary of States’ 2016 Annual Reports
39
APPENDIX A
New Hampshire
Allocation Amount: $13,168,350
Number of Loans/Investments 350
SSBCI Original Allocated Funds Expended $12,654,720
SSBCI Recycled Funds Expended $0
Total New Financing to Small Businesses $176,931,335
Leverage Ratio 13.98x
Transaction Size and Demographics
Median Principal Loan/Investment Size $39,821
Minimum Principal Loan/Investment Size $1,150
Maximum Principal Loan/Investment Size $17,100,000
LMI Census Tracts (by Number of Transactions) 36.6%
LMI Census Tracts (by Dollar Amount) 25.7%
Non-Metro Areas (by Number of Transactions) 55.7%
Non-Metro Areas (by Dollar Amount) 32.8%
Business Age and Size
Median Business Age at Loan/Investment 6
Median Business Size (FTEs) 3
Median Business Size (Annual Revenue) $291,590
Total Number of Jobs Created or Retained 4,792
Jobs Created 761
Jobs Retained 4,031
Top 3 Industries by Number of Transactions
Construction 47
Accommodation and Food Services 46
Manufacturing 36
Top 3 Industries by Dollar Amount
Manufacturing $57,204,710
Professional, Scientic, and Technical Services $46,720,119
Transportation and Warehousing $18,123,675
Lender Participation
Small Lenders* (by Number of Transactions) 60.0%
Small Lenders (by Dollar Amount) 39.2%
* Includes Banks, Credit Unions, CDFIs, and Non-Financial Institution Lenders
with assets less than or equal to $1.22B
New Jersey
Allocation Amount: $33,895,151
Number of Loans/Investments 73
SSBCI Original Allocated Funds Expended $25,271,865
SSBCI Recycled Funds Expended $0
Total New Financing to Small Businesses $123,606,054
Leverage Ratio 4.89x
Transaction Size and Demographics
Median Principal Loan/Investment Size $499,994
Minimum Principal Loan/Investment Size $50,000
Maximum Principal Loan/Investment Size $8,310,000
LMI Census Tracts (by Number of Transactions) 16.4%
LMI Census Tracts (by Dollar Amount) 20.5%
Non-Metro Areas (by Number of Transactions) 0.0%
Non-Metro Areas (by Dollar Amount) 0.0%
Business Age and Size
Median Business Age at Loan/Investment 3
Median Business Size (FTEs) 17
Median Business Size (Annual Revenue) $959,000
Total Number of Jobs Created or Retained 2,125
Jobs Created 961
Jobs Retained 1,164
Top 3 Industries by Number of Transactions
Information 29
Real Estate and Rental and Leasing 9
Professional, Scientic, and Technical Services 8
Top 3 Industries by Dollar Amount
Information $42,681,346
Professional, Scientic, and Technical Services $24,469,908
Manufacturing $17,040,000
Lender Participation
Small Lenders* (by Number of Transactions) 8.2%
Small Lenders (by Dollar Amount) 4.4%
* Includes Banks, Credit Unions, CDFIs, and Non-Financial Institution Lenders
with assets less than or equal to $1.22B

SSBCI: Summary of States’ 2016 Annual Reports
40
APPENDIX A
New Mexico
Allocation Amount: $13,227,911
Number of Loans/Investments 17
SSBCI Original Allocated Funds Expended $8,099,671
SSBCI Recycled Funds Expended $385,072
Total New Financing to Small Businesses $51,794,930
Leverage Ratio 6.39x
Transaction Size and Demographics
Median Principal Loan/Investment Size $1,440,502
Minimum Principal Loan/Investment Size $200,000
Maximum Principal Loan/Investment Size $7,397,000
LMI Census Tracts (by Number of Transactions) 35.3%
LMI Census Tracts (by Dollar Amount) 28.8%
Non-Metro Areas (by Number of Transactions) 17.6%
Non-Metro Areas (by Dollar Amount) 27.2%
Business Age and Size
Median Business Age at Loan/Investment 7
Median Business Size (FTEs) 5
Median Business Size (Annual Revenue) $548,307
Total Number of Jobs Created or Retained 225
Jobs Created 212
Jobs Retained 13
Top 3 Industries by Number of Transactions
Health Care and Social Assistance 5
Accommodation and Food Services 3
Other Services (except Public Administration) 2
Wholesale Trade 2
Manufacturing 2
Top 3 Industries by Dollar Amount
Accommodation and Food Services $19,252,000
Wholesale Trade $14,693,924
Health Care and Social Assistance $12,320,356
Lender Participation
Small Lenders* (by Number of Transactions) 29.4%
Small Lenders (by Dollar Amount) 36.9%
* Includes Banks, Credit Unions, CDFIs, and Non-Financial Institution Lenders
with assets less than or equal to $1.22B
New York
Allocation Amount: $55,601,892
Number of Loans/Investments 1,764
SSBCI Original Allocated Funds Expended $42,328,207
SSBCI Recycled Funds Expended $0
Total New Financing to Small Businesses $697,269,194
Leverage Ratio 16.47x
Transaction Size and Demographics
Median Principal Loan/Investment Size $15,525
Minimum Principal Loan/Investment Size $500
Maximum Principal Loan/Investment Size $12,000,000
LMI Census Tracts (by Number of Transactions) 60.7%
LMI Census Tracts (by Dollar Amount) 30.8%
Non-Metro Areas (by Number of Transactions) 1.1%
Non-Metro Areas (by Dollar Amount) 2.1%
Business Age and Size
Median Business Age at Loan/Investment 4
Median Business Size (FTEs) 1
Median Business Size (Annual Revenue) $58,451
Total Number of Jobs Created or Retained 8,208
Jobs Created 3,085
Jobs Retained 5,123
Top 3 Industries by Number of Transactions
Other Services (except Public Administration) 365
Retail Trade 274
Transportation and Warehousing 206
Top 3 Industries by Dollar Amount
Professional, Scientic, and Technical Services $187,081,068
Information $154,384,982
Manufacturing $135,609,191
Lender Participation
Small Lenders* (by Number of Transactions) 90.6%
Small Lenders (by Dollar Amount) 12.3%
* Includes Banks, Credit Unions, CDFIs, and Non-Financial Institution Lenders
with assets less than or equal to $1.22B

SSBCI: Summary of States’ 2016 Annual Reports
41
APPENDIX A
North Carolina
Allocation Amount: $46,269,657
Number of Loans/Investments 769
SSBCI Original Allocated Funds Expended $46,020,998
SSBCI Recycled Funds Expended $8,832,559
Total New Financing to Small Businesses $707,058,639
Leverage Ratio 15.36x
Transaction Size and Demographics
Median Principal Loan/Investment Size $165,000
Minimum Principal Loan/Investment Size $2,500
Maximum Principal Loan/Investment Size $20,000,000
LMI Census Tracts (by Number of Transactions) 18.9%
LMI Census Tracts (by Dollar Amount) 21.0%
Non-Metro Areas (by Number of Transactions) 13.5%
Non-Metro Areas (by Dollar Amount) 12.3%
Business Age and Size
Median Business Age at Loan/Investment 5
Median Business Size (FTEs) 5
Median Business Size (Annual Revenue) $433,000
Total Number of Jobs Created or Retained 12,524
Jobs Created 3,733
Jobs Retained 8,792
Top 3 Industries by Number of Transactions
Health Care and Social Assistance 110
Professional, Scientic, and Technical Services 105
Manufacturing 88
Top 3 Industries by Dollar Amount
Professional, Scientic, and Technical Services $218,146,647
Manufacturing $129,129,913
Retail Trade $63,289,691
Lender Participation
Small Lenders* (by Number of Transactions) 42.0%
Small Lenders (by Dollar Amount) 22.3%
* Includes Banks, Credit Unions, CDFIs, and Non-Financial Institution Lenders
with assets less than or equal to $1.22B
Ohio
Allocation Amount: $55,358,150
Number of Loans/Investments 551
SSBCI Original Allocated Funds Expended $44,498,188
SSBCI Recycled Funds Expended $0
Total New Financing to Small Businesses $177,693,987
Leverage Ratio 3.99x
Transaction Size and Demographics
Median Principal Loan/Investment Size $100,000
Minimum Principal Loan/Investment Size $5,000
Maximum Principal Loan/Investment Size $5,000,000
LMI Census Tracts (by Number of Transactions) 26.7%
LMI Census Tracts (by Dollar Amount) 29.1%
Non-Metro Areas (by Number of Transactions) 14.2%
Non-Metro Areas (by Dollar Amount) 12.3%
Business Age and Size
Median Business Age at Loan/Investment 5
Median Business Size (FTEs) 4
Median Business Size (Annual Revenue) $305,000
Total Number of Jobs Created or Retained 8,245
Jobs Created 3,380
Jobs Retained 4,865
Top 3 Industries by Number of Transactions
Accommodation and Food Services 88
Retail Trade 61
Manufacturing 61
Top 3 Industries by Dollar Amount
Manufacturing $28,219,996
Accommodation and Food Services $24,735,302
Real Estate and Rental and Leasing $23,382,278
Lender Participation
Small Lenders* (by Number of Transactions) 41.9%
Small Lenders (by Dollar Amount) 34.5%
* Includes Banks, Credit Unions, CDFIs, and Non-Financial Institution Lenders
with assets less than or equal to $1.22B

SSBCI: Summary of States’ 2016 Annual Reports
42
APPENDIX A
Oklahoma
Allocation Amount: $13,227,911
Number of Loans/Investments 49
SSBCI Original Allocated Funds Expended $12,347,911
SSBCI Recycled Funds Expended $0
Total New Financing to Small Businesses $85,645,841
Leverage Ratio 6.94x
Transaction Size and Demographics
Median Principal Loan/Investment Size $633,717
Minimum Principal Loan/Investment Size $80,000
Maximum Principal Loan/Investment Size $3,000,000
LMI Census Tracts (by Number of Transactions) 81.6%
LMI Census Tracts (by Dollar Amount) 81.1%
Non-Metro Areas (by Number of Transactions) 6.1%
Non-Metro Areas (by Dollar Amount) 2.5%
Business Age and Size
Median Business Age at Loan/Investment 3
Median Business Size (FTEs) 3
Median Business Size (Annual Revenue) $37,948
Total Number of Jobs Created or Retained 796
Jobs Created 743
Jobs Retained 53
Top 3 Industries by Number of Transactions
Professional, Scientic, and Technical Services 30
Manufacturing 7
Health Care and Social Assistance 5
Top 3 Industries by Dollar Amount
Professional, Scientic, and Technical Services $65,985,654
Manufacturing $9,214,221
Information $4,877,000
Lender Participation
Small Lenders* (by Number of Transactions) 0.0%
Small Lenders (by Dollar Amount) 0.0%
* Includes Banks, Credit Unions, CDFIs, and Non-Financial Institution Lenders
with assets less than or equal to $1.22B
Oregon
Allocation Amount: $16,590,901
Number of Loans/Investments 265
SSBCI Original Allocated Funds Expended $16,279,449
SSBCI Recycled Funds Expended $1,011,354
Total New Financing to Small Businesses $175,663,114
Leverage Ratio 10.79x
Transaction Size and Demographics
Median Principal Loan/Investment Size $185,000
Minimum Principal Loan/Investment Size $5,000
Maximum Principal Loan/Investment Size $5,914,000
LMI Census Tracts (by Number of Transactions) 34.3%
LMI Census Tracts (by Dollar Amount) 38.2%
Non-Metro Areas (by Number of Transactions) 25.3%
Non-Metro Areas (by Dollar Amount) 24.1%
Business Age and Size
Median Business Age at Loan/Investment 5
Median Business Size (FTEs) 7
Median Business Size (Annual Revenue) $724,583
Total Number of Jobs Created or Retained 1,696
Jobs Created 887
Jobs Retained 809
Top 3 Industries by Number of Transactions
Manufacturing 66
Construction 43
Retail Trade 29
Top 3 Industries by Dollar Amount
Manufacturing $88,193,593
Retail Trade $19,162,116
Construction $11,842,240
Lender Participation
Small Lenders* (by Number of Transactions) 51.7%
Small Lenders (by Dollar Amount) 54.5%
* Includes Banks, Credit Unions, CDFIs, and Non-Financial Institution Lenders
with assets less than or equal to $1.22B

SSBCI: Summary of States’ 2016 Annual Reports
43
APPENDIX A
Pennsylvania
Allocation Amount: $29,017,428
Number of Loans/Investments 189
SSBCI Original Allocated Funds Expended $18,612,869
SSBCI Recycled Funds Expended $1,065,101
Total New Financing to Small Businesses $241,311,321
Leverage Ratio 12.96x
Transaction Size and Demographics
Median Principal Loan/Investment Size $179,850
Minimum Principal Loan/Investment Size $1,000
Maximum Principal Loan/Investment Size $12,750,000
LMI Census Tracts (by Number of Transactions) 43.9%
LMI Census Tracts (by Dollar Amount) 26.5%
Non-Metro Areas (by Number of Transactions) 13.8%
Non-Metro Areas (by Dollar Amount) 7.1%
Business Age and Size
Median Business Age at Loan/Investment 3
Median Business Size (FTEs) 2
Median Business Size (Annual Revenue) $7,425
Total Number of Jobs Created or Retained 3,285
Jobs Created 1,128
Jobs Retained 2,157
Top 3 Industries by Number of Transactions
Accommodation and Food Services 34
Manufacturing 34
Professional, Scientic, and Technical Services 29
Top 3 Industries by Dollar Amount
Professional, Scientic, and Technical Services $80,124,624
Manufacturing $71,001,248
Accommodation and Food Services $21,662,843
Lender Participation
Small Lenders* (by Number of Transactions) 76.2%
Small Lenders (by Dollar Amount) 44.4%
* Includes Banks, Credit Unions, CDFIs, and Non-Financial Institution Lenders
with assets less than or equal to $1.22B
Rhode Island
Allocation Amount: $13,168,350
Number of Loans/Investments 86
SSBCI Original Allocated Funds Expended $8,216,045
SSBCI Recycled Funds Expended $0
Total New Financing to Small Businesses $121,454,210
Leverage Ratio 14.78x
Transaction Size and Demographics
Median Principal Loan/Investment Size $70,545
Minimum Principal Loan/Investment Size $52,000
Maximum Principal Loan/Investment Size $11,500,000
LMI Census Tracts (by Number of Transactions) 66.3%
LMI Census Tracts (by Dollar Amount) 40.1%
Non-Metro Areas (by Number of Transactions) 0.0%
Non-Metro Areas (by Dollar Amount) 0.0%
Business Age and Size
Median Business Age at Loan/Investment 0
Median Business Size (FTEs) 2
Median Business Size (Annual Revenue) $0
Total Number of Jobs Created or Retained 490
Jobs Created 135
Jobs Retained 355
Top 3 Industries by Number of Transactions
Information 26
Professional, Scientic, and Technical Services 24
Manufacturing 11
Top 3 Industries by Dollar Amount
Professional, Scientic, and Technical Services $71,530,850
Manufacturing $24,139,203
Utilities $8,389,112
Lender Participation
Small Lenders* (by Number of Transactions) 0.0%
Small Lenders (by Dollar Amount) 0.0%
* Includes Banks, Credit Unions, CDFIs, and Non-Financial Institution Lenders
with assets less than or equal to $1.22B

SSBCI: Summary of States’ 2016 Annual Reports
44
APPENDIX A
South Carolina
Allocation Amount: $18,071,787
Number of Loans/Investments 205
SSBCI Original Allocated Funds Expended $18,071,787
SSBCI Recycled Funds Expended $9,231,812
Total New Financing to Small Businesses $175,349,359
Leverage Ratio 9.70x
Transaction Size and Demographics
Median Principal Loan/Investment Size $485,000
Minimum Principal Loan/Investment Size $5,000
Maximum Principal Loan/Investment Size $6,000,000
LMI Census Tracts (by Number of Transactions) 22.4%
LMI Census Tracts (by Dollar Amount) 20.1%
Non-Metro Areas (by Number of Transactions) 13.7%
Non-Metro Areas (by Dollar Amount) 14.1%
Business Age and Size
Median Business Age at Loan/Investment 8
Median Business Size (FTEs) 10
Median Business Size (Annual Revenue) $1,300,000
Total Number of Jobs Created or Retained 3,349
Jobs Created 653
Jobs Retained 2,697
Top 3 Industries by Number of Transactions
Health Care and Social Assistance 56
Professional, Scientic, and Technical Services 24
Construction 23
Top 3 Industries by Dollar Amount
Health Care and Social Assistance $62,060,950
Retail Trade $23,148,687
Manufacturing $17,625,602
Lender Participation
Small Lenders* (by Number of Transactions) 52.2%
Small Lenders (by Dollar Amount) 52.1%
* Includes Banks, Credit Unions, CDFIs, and Non-Financial Institution Lenders
with assets less than or equal to $1.22B
South Dakota
Allocation Amount: $13,227,911
Number of Loans/Investments 17
SSBCI Original Allocated Funds Expended $8,187,198
SSBCI Recycled Funds Expended $0
Total New Financing to Small Businesses $65,679,557
Leverage Ratio 8.02x
Transaction Size and Demographics
Median Principal Loan/Investment Size $900,000
Minimum Principal Loan/Investment Size $283,000
Maximum Principal Loan/Investment Size $17,000,000
LMI Census Tracts (by Number of Transactions) 47.1%
LMI Census Tracts (by Dollar Amount) 59.7%
Non-Metro Areas (by Number of Transactions) 17.6%
Non-Metro Areas (by Dollar Amount) 14.4%
Business Age and Size
Median Business Age at Loan/Investment 9
Median Business Size (FTEs) 45
Median Business Size (Annual Revenue) $2,803,919
Total Number of Jobs Created or Retained 712
Jobs Created 401
Jobs Retained 311
Top 3 Industries by Number of Transactions
Manufacturing 4
Retail Trade 3
Health Care and Social Assistance 2
Top 3 Industries by Dollar Amount
Accommodation and Food Services $17,000,000
Health Care and Social Assistance $14,267,610
Retail Trade $9,428,500
Lender Participation
Small Lenders* (by Number of Transactions) 64.7%
Small Lenders (by Dollar Amount) 65.0%
* Includes Banks, Credit Unions, CDFIs, and Non-Financial Institution Lenders
with assets less than or equal to $1.22B

SSBCI: Summary of States’ 2016 Annual Reports
45
APPENDIX A
Tennessee
Allocation Amount: $29,806,278
Number of Loans/Investments 89
SSBCI Original Allocated Funds Expended $29,728,706
SSBCI Recycled Funds Expended $0
Total New Financing to Small Businesses $159,683,309
Leverage Ratio 5.37x
Transaction Size and Demographics
Median Principal Loan/Investment Size $874,425
Minimum Principal Loan/Investment Size $32,000
Maximum Principal Loan/Investment Size $6,534,061
LMI Census Tracts (by Number of Transactions) 41.6%
LMI Census Tracts (by Dollar Amount) 35.1%
Non-Metro Areas (by Number of Transactions) 12.4%
Non-Metro Areas (by Dollar Amount) 11.9%
Business Age and Size
Median Business Age at Loan/Investment 3
Median Business Size (FTEs) 7
Median Business Size (Annual Revenue) $369,310
Total Number of Jobs Created or Retained 1,552
Jobs Created 399
Jobs Retained 1,154
Top 3 Industries by Number of Transactions
Information 40
Professional, Scientic, and Technical Services 19
Manufacturing 12
Top 3 Industries by Dollar Amount
Information $71,969,613
Professional, Scientic, and Technical Services $40,500,303
Retail Trade $16,333,122
Lender Participation
Small Lenders* (by Number of Transactions) 0.0%
Small Lenders (by Dollar Amount) 0.0%
* Includes Banks, Credit Unions, CDFIs, and Non-Financial Institution Lenders
with assets less than or equal to $1.22B
Texas
Allocation Amount: $46,764,445
Number of Loans/Investments 57
SSBCI Original Allocated Funds Expended $41,422,620
SSBCI Recycled Funds Expended $1,699,156
Total New Financing to Small Businesses $553,047,525
Leverage Ratio 13.35x
Transaction Size and Demographics
Median Principal Loan/Investment Size $2,300,000
Minimum Principal Loan/Investment Size $19,000
Maximum Principal Loan/Investment Size $20,000,000
LMI Census Tracts (by Number of Transactions) 24.6%
LMI Census Tracts (by Dollar Amount) 26.8%
Non-Metro Areas (by Number of Transactions) 7.0%
Non-Metro Areas (by Dollar Amount) 1.4%
Business Age and Size
Median Business Age at Loan/Investment 4
Median Business Size (FTEs) 6
Median Business Size (Annual Revenue) $237,000
Total Number of Jobs Created or Retained 1,486
Jobs Created 705
Jobs Retained 781
Top 3 Industries by Number of Transactions
Information 18
Manufacturing 15
Professional, Scientic, and Technical Services 11
Top 3 Industries by Dollar Amount
Professional, Scientic, and Technical Services $163,712,536
Mining, Quarrying, and Oil and Gas Extraction $153,502,422
Information $149,411,317
Lender Participation
Small Lenders* (by Number of Transactions) 10.5%
Small Lenders (by Dollar Amount) 0.1%
* Includes Banks, Credit Unions, CDFIs, and Non-Financial Institution Lenders
with assets less than or equal to $1.22B

SSBCI: Summary of States’ 2016 Annual Reports
46
APPENDIX A
Utah
Allocation Amount: $11,815,036
Number of Loans/Investments 38
SSBCI Original Allocated Funds Expended $8,737,841
SSBCI Recycled Funds Expended $1,298,657
Total New Financing to Small Businesses $61,717,910
Leverage Ratio 7.06x
Transaction Size and Demographics
Median Principal Loan/Investment Size $500,000
Minimum Principal Loan/Investment Size $20,000
Maximum Principal Loan/Investment Size $12,120,000
LMI Census Tracts (by Number of Transactions) 39.5%
LMI Census Tracts (by Dollar Amount) 24.7%
Non-Metro Areas (by Number of Transactions) 10.5%
Non-Metro Areas (by Dollar Amount) 0.3%
Business Age and Size
Median Business Age at Loan/Investment 7
Median Business Size (FTEs) 15
Median Business Size (Annual Revenue) $1,676,322
Total Number of Jobs Created or Retained 1,974
Jobs Created 371
Jobs Retained 1,603
Top 3 Industries by Number of Transactions
Manufacturing 8
Accommodation and Food Services 5
Retail Trade 4
Administrative and Support and Waste Management
and Remediation Services 4
Top 3 Industries by Dollar Amount
Accommodation and Food Services $21,145,000
Manufacturing $19,814,440
Information $8,886,000
Lender Participation
Small Lenders* (by Number of Transactions) 23.7%
Small Lenders (by Dollar Amount) 10.7%
* Includes Banks, Credit Unions, CDFIs, and Non-Financial Institution Lenders
with assets less than or equal to $1.22B
Vermont
Allocation Amount: $13,227,911
Number of Loans/Investments 174
SSBCI Original Allocated Funds Expended $12,998,518
SSBCI Recycled Funds Expended $4,399,583
Total New Financing to Small Businesses $177,226,826
Leverage Ratio 13.63x
Transaction Size and Demographics
Median Principal Loan/Investment Size $496,667
Minimum Principal Loan/Investment Size $22,101
Maximum Principal Loan/Investment Size $20,000,000
LMI Census Tracts (by Number of Transactions) 13.8%
LMI Census Tracts (by Dollar Amount) 32.3%
Non-Metro Areas (by Number of Transactions) 66.7%
Non-Metro Areas (by Dollar Amount) 57.4%
Business Age and Size
Median Business Age at Loan/Investment 10
Median Business Size (FTEs) 8
Median Business Size (Annual Revenue) $1,010,200
Total Number of Jobs Created or Retained 1,954
Jobs Created 1,741
Jobs Retained 213
Top 3 Industries by Number of Transactions
Manufacturing 68
Accommodation and Food Services 38
Retail Trade 13
Top 3 Industries by Dollar Amount
Manufacturing $69,963,156
Accommodation and Food Services $62,704,860
Wholesale Trade $8,428,532
Lender Participation
Small Lenders* (by Number of Transactions) 79.3%
Small Lenders (by Dollar Amount) 69.8%
* Includes Banks, Credit Unions, CDFIs, and Non-Financial Institution Lenders
with assets less than or equal to $1.22B

SSBCI: Summary of States’ 2016 Annual Reports
47
APPENDIX A
Virginia
Allocation Amount: $18,034,394
Number of Loans/Investments 292
SSBCI Original Allocated Funds Expended $17,453,680
SSBCI Recycled Funds Expended $4,685,111
Total New Financing to Small Businesses $115,007,216
Leverage Ratio 6.59x
Transaction Size and Demographics
Median Principal Loan/Investment Size $134,350
Minimum Principal Loan/Investment Size $3,000
Maximum Principal Loan/Investment Size $9,600,000
LMI Census Tracts (by Number of Transactions) 34.2%
LMI Census Tracts (by Dollar Amount) 20.2%
Non-Metro Areas (by Number of Transactions) 24.7%
Non-Metro Areas (by Dollar Amount) 8.5%
Business Age and Size
Median Business Age at Loan/Investment 5
Median Business Size (FTEs) 5
Median Business Size (Annual Revenue) $289,500
Total Number of Jobs Created or Retained 5,495
Jobs Created 2,964
Jobs Retained 2,531
Top 3 Industries by Number of Transactions
Professional, Scientic, and Technical Services 31
Manufacturing 28
Other Services (except Public Administration) 28
Top 3 Industries by Dollar Amount
Information $25,075,304
Professional, Scientic, and Technical Services $22,592,564
Manufacturing $12,810,393
Lender Participation
Small Lenders* (by Number of Transactions) 55.1%
Small Lenders (by Dollar Amount) 45.9%
* Includes Banks, Credit Unions, CDFIs, and Non-Financial Institution Lenders
with assets less than or equal to $1.22B
Washington
Allocation Amount: $19,811,721
Number of Loans/Investments 88
SSBCI Original Allocated Funds Expended $17,523,883
SSBCI Recycled Funds Expended $1,455,000
Total New Financing to Small Businesses $178,830,391
Leverage Ratio 10.20x
Transaction Size and Demographics
Median Principal Loan/Investment Size $689,350
Minimum Principal Loan/Investment Size $32,217
Maximum Principal Loan/Investment Size $10,000,000
LMI Census Tracts (by Number of Transactions) 40.9%
LMI Census Tracts (by Dollar Amount) 56.5%
Non-Metro Areas (by Number of Transactions) 13.6%
Non-Metro Areas (by Dollar Amount) 24.8%
Business Age and Size
Median Business Age at Loan/Investment 6
Median Business Size (FTEs) 13
Median Business Size (Annual Revenue) $702,337
Total Number of Jobs Created or Retained 2,085
Jobs Created 854
Jobs Retained 1,231
Top 3 Industries by Number of Transactions
Manufacturing 31
Construction 12
Professional, Scientic, and Technical Services 11
Top 3 Industries by Dollar Amount
Manufacturing $80,780,781
Professional, Scientic, and Technical Services $26,969,345
Other Services (except Public Administration) $20,303,413
Lender Participation
Small Lenders* (by Number of Transactions) 71.6%
Small Lenders (by Dollar Amount) 69.3%
* Includes Banks, Credit Unions, CDFIs, and Non-Financial Institution Lenders
with assets less than or equal to $1.22B
SSBCI: Summary of States’ 2016 Annual Reports
48
APPENDIX A
West Virginia
Allocation Amount: $13,227,911
Number of Loans/Investments 67
SSBCI Original Allocated Funds Expended $12,624,119
SSBCI Recycled Funds Expended $310,059
Total New Financing to Small Businesses $102,530,815
Leverage Ratio 8.12x
Transaction Size and Demographics
Median Principal Loan/Investment Size $457,000
Minimum Principal Loan/Investment Size $40,000
Maximum Principal Loan/Investment Size $7,500,000
LMI Census Tracts (by Number of Transactions) 35.8%
LMI Census Tracts (by Dollar Amount) 50.9%
Non-Metro Areas (by Number of Transactions) 32.8%
Non-Metro Areas (by Dollar Amount) 32.7%
Business Age and Size
Median Business Age at Loan/Investment 4
Median Business Size (FTEs) 4
Median Business Size (Annual Revenue) $256,278
Total Number of Jobs Created or Retained 1,321
Jobs Created 776
Jobs Retained 545
Top 3 Industries by Number of Transactions
Manufacturing 22
Professional, Scientic, and Technical Services 9
Health Care and Social Assistance 6
Top 3 Industries by Dollar Amount
Manufacturing $47,175,484
Accommodation and Food Services $13,952,823
Retail Trade $13,602,561
Lender Participation
Small Lenders* (by Number of Transactions) 41.8%
Small Lenders (by Dollar Amount) 45.8%
* Includes Banks, Credit Unions, CDFIs, and Non-Financial Institution Lenders
with assets less than or equal to $1.22B
Wisconsin
Allocation Amount: $22,363,554
Number of Loans/Investments 77
SSBCI Original Allocated Funds Expended $13,748,452
SSBCI Recycled Funds Expended $0
Total New Financing to Small Businesses $151,849,967
Leverage Ratio 11.04x
Transaction Size and Demographics
Median Principal Loan/Investment Size $500,000
Minimum Principal Loan/Investment Size $12,800
Maximum Principal Loan/Investment Size $7,986,000
LMI Census Tracts (by Number of Transactions) 28.6%
LMI Census Tracts (by Dollar Amount) 38.1%
Non-Metro Areas (by Number of Transactions) 7.8%
Non-Metro Areas (by Dollar Amount) 5.7%
Business Age and Size
Median Business Age at Loan/Investment 4
Median Business Size (FTEs) 8
Median Business Size (Annual Revenue) $225,000
Total Number of Jobs Created or Retained 1,629
Jobs Created 1,056
Jobs Retained 573
Top 3 Industries by Number of Transactions
Manufacturing 35
Professional, Scientic, and Technical Services 26
Information 10
Top 3 Industries by Dollar Amount
Manufacturing $67,157,562
Professional, Scientic, and Technical Services $57,593,977
Information $17,080,010
Lender Participation
Small Lenders* (by Number of Transactions) 0.0%
Small Lenders (by Dollar Amount) 0.0%
* Includes Banks, Credit Unions, CDFIs, and Non-Financial Institution Lenders
with assets less than or equal to $1.22B

SSBCI: Summary of States’ 2016 Annual Reports
49
APPENDIX A
Appendix A: Participating Municipalities
Alaska—Anchorage
Allocation Amount: $13,168,350
Number of Loans/Investments 19
SSBCI Original Allocated Funds Expended $1,700,137
SSBCI Recycled Funds Expended $0
Total New Financing to Small Businesses $6,657,375
Leverage Ratio 3.92x
Transaction Size and Demographics
Median Principal Loan/Investment Size $125,000
Minimum Principal Loan/Investment Size $21,875
Maximum Principal Loan/Investment Size $2,400,000
LMI Census Tracts (by Number of Transactions) 26.3%
LMI Census Tracts (by Dollar Amount) 65.5%
Non-Metro Areas (by Number of Transactions) 0.0%
Non-Metro Areas (by Dollar Amount) 0.0%
Business Age and Size
Median Business Age at Loan/Investment 0
Median Business Size (FTEs) 3
Median Business Size (Annual Revenue) $0
Total Number of Jobs Created or Retained 67
Jobs Created 51
Jobs Retained 16
Top 3 Industries by Number of Transactions
Manufacturing 7
Professional, Scientic, and Technical Services 5
Information 3
Top 3 Industries by Dollar Amount
Wholesale Trade $3,920,000
Manufacturing $1,017,750
Agriculture, Forestry, Fishing and Hunting $705,000
Lender Participation
Small Lenders* (by Number of Transactions) 0.0%
Small Lenders (by Dollar Amount) 0.0%
* Includes Banks, Credit Unions, CDFIs, and Non-Financial Institution Lenders
with assets less than or equal to $1.22B
North Dakota—Carrington
Allocation Amount: $3,433,709
Number of Loans/Investments 21
SSBCI Original Allocated Funds Expended $3,014,524
SSBCI Recycled Funds Expended $300,000
Total New Financing to Small Businesses $8,003,882
Leverage Ratio 2.66x
Transaction Size and Demographics
Median Principal Loan/Investment Size $390,000
Minimum Principal Loan/Investment Size $20,000
Maximum Principal Loan/Investment Size $1,000,000
LMI Census Tracts (by Number of Transactions) 9.5%
LMI Census Tracts (by Dollar Amount) 7.4%
Non-Metro Areas (by Number of Transactions) 81.0%
Non-Metro Areas (by Dollar Amount) 84.3%
Business Age and Size
Median Business Age at Loan/Investment 2
Median Business Size (FTEs) 3
Median Business Size (Annual Revenue) $185,000
Total Number of Jobs Created or Retained 119
Jobs Created 37
Jobs Retained 82
Top 3 Industries by Number of Transactions
Retail Trade 4
Other Services (except Public Administration) 3
Administrative and Support and Waste Management
and Remediation Services 3
Manufacturing 3
Top 3 Industries by Dollar Amount
Manufacturing $2,090,000
Retail Trade $1,589,117
Health Care and Social Assistance $995,000
Lender Participation
Small Lenders* (by Number of Transactions) 71.4%
Small Lenders (by Dollar Amount) 55.3%
* Includes Banks, Credit Unions, CDFIs, and Non-Financial Institution Lenders
with assets less than or equal to $1.22B

SSBCI: Summary of States’ 2016 Annual Reports
50
APPENDIX A
North Dakota—Mandan
Allocation Amount: $9,734,641
Number of Loans/Investments 44
SSBCI Original Allocated Funds Expended $9,734,641
SSBCI Recycled Funds Expended $4,497,861
Total New Financing to Small Businesses $84,060,392
Leverage Ratio 8.64x
Transaction Size and Demographics
Median Principal Loan/Investment Size $871,250
Minimum Principal Loan/Investment Size $17,114
Maximum Principal Loan/Investment Size $17,600,000
LMI Census Tracts (by Number of Transactions) 31.8%
LMI Census Tracts (by Dollar Amount) 20.4%
Non-Metro Areas (by Number of Transactions) 31.8%
Non-Metro Areas (by Dollar Amount) 18.6%
Business Age and Size
Median Business Age at Loan/Investment 2
Median Business Size (FTEs) 11
Median Business Size (Annual Revenue) $1,370,200
Total Number of Jobs Created or Retained 708
Jobs Created 506
Jobs Retained 202
Top 3 Industries by Number of Transactions
Accommodation and Food Services 12
Retail Trade 8
Other Services (except Public Administration) 5
Top 3 Industries by Dollar Amount
Accommodation and Food Services $24,963,772
Manufacturing $22,773,068
Retail Trade $8,359,647
Lender Participation
Small Lenders* (by Number of Transactions) 77.3%
Small Lenders (by Dollar Amount) 69.9%
* Includes Banks, Credit Unions, CDFIs, and Non-Financial Institution Lenders
with assets less than or equal to $1.22B
Wyoming—Laramie
Allocation Amount: $13,168,350
Number of Loans/Investments 82
SSBCI Original Allocated Funds Expended $12,777,481
SSBCI Recycled Funds Expended $1,010,955
Total New Financing to Small Businesses $58,748,371
Leverage Ratio 4.60x
Transaction Size and Demographics
Median Principal Loan/Investment Size $200,000
Minimum Principal Loan/Investment Size $10,000
Maximum Principal Loan/Investment Size $13,490,581
LMI Census Tracts (by Number of Transactions) 17.1%
LMI Census Tracts (by Dollar Amount) 13.1%
Non-Metro Areas (by Number of Transactions) 62.2%
Non-Metro Areas (by Dollar Amount) 42.8%
Business Age and Size
Median Business Age at Loan/Investment 2
Median Business Size (FTEs) 2
Median Business Size (Annual Revenue) $246,679
Total Number of Jobs Created or Retained 719
Jobs Created 366
Jobs Retained 353
Top 3 Industries by Number of Transactions
Retail Trade 25
Accommodation and Food Services 11
Mining, Quarrying, and Oil and Gas Extraction 8
Top 3 Industries by Dollar Amount
Information $13,661,581
Accommodation and Food Services $9,367,424
Health Care and Social Assistance $8,625,204
Lender Participation
Small Lenders* (by Number of Transactions) 63.4%
Small Lenders (by Dollar Amount) 67.0%
* Includes Banks, Credit Unions, CDFIs, and Non-Financial Institution Lenders
with assets less than or equal to $1.22B

SSBCI: Summary of States’ 2016 Annual Reports
51
APPENDIX A
Appendix A: Participating Territories
American Samoa
Allocation Amount: $10,500,000
Number of Loans/Investments 0
SSBCI Original Allocated Funds Expended $171,178
SSBCI Recycled Funds Expended $0
Total New Financing to Small Businesses $0
Leverage Ratio 0.00x
Transaction Size and Demographics
Median Principal Loan/Investment Size $0
Minimum Principal Loan/Investment Size $0
Maximum Principal Loan/Investment Size $0
LMI Census Tracts (by Number of Transactions) 0.0%
LMI Census Tracts (by Dollar Amount) 0.0%
Non-Metro Areas (by Number of Transactions) 0.0%
Non-Metro Areas (by Dollar Amount) 0.0%
Business Age and Size
Median Business Age at Loan/Investment 0
Median Business Size (FTEs) 0
Median Business Size (Annual Revenue) $0
Total Number of Jobs Created or Retained 0
Jobs Created 0
Jobs Retained 0
Top 3 Industries by Number of Transactions
N/A 0
N/A 0
N/A 0
Top 3 Industries by Dollar Amount
N/A $0
N/A $0
N/A $0
Lender Participation
Small Lenders* (by Number of Transactions) 0.0%
Small Lenders (by Dollar Amount) 0.0%
* Includes Banks, Credit Unions, CDFIs, and Non-Financial Institution Lenders
with assets less than or equal to $1.22B
Guam
Allocation Amount: $13,227,911
Number of Loans/Investments 42
SSBCI Original Allocated Funds Expended $5,797,210
SSBCI Recycled Funds Expended $0
Total New Financing to Small Businesses $10,048,996
Leverage Ratio 1.73x
Transaction Size and Demographics
Median Principal Loan/Investment Size $100,000
Minimum Principal Loan/Investment Size $2,600
Maximum Principal Loan/Investment Size $1,642,500
LMI Census Tracts (by Number of Transactions) 31.0%
LMI Census Tracts (by Dollar Amount) 55.1%
Non-Metro Areas (by Number of Transactions) 92.9%
Non-Metro Areas (by Dollar Amount) 98.3%
Business Age and Size
Median Business Age at Loan/Investment 1
Median Business Size (FTEs) 3
Median Business Size (Annual Revenue) $193,837
Total Number of Jobs Created or Retained 788
Jobs Created 523
Jobs Retained 265
Top 3 Industries by Number of Transactions
Accommodation and Food Services 9
Retail Trade 8
Professional, Scientic, and Technical Services 6
Top 3 Industries by Dollar Amount
Retail Trade $2,665,000
Accommodation and Food Services $2,303,000
Arts, Entertainment, and Recreation $2,142,500
Lender Participation
Small Lenders* (by Number of Transactions) 38.1%
Small Lenders (by Dollar Amount) 35.6%
* Includes Banks, Credit Unions, CDFIs, and Non-Financial Institution Lenders
with assets less than or equal to $1.22B

SSBCI: Summary of States’ 2016 Annual Reports
52
APPENDIX A
Northern Mariana Islands
Allocation Amount: $12,733,082
Number of Loans/Investments 38
SSBCI Original Allocated Funds Expended $4,380,368
SSBCI Recycled Funds Expended $0
Total New Financing to Small Businesses $8,866,171
Leverage Ratio 2.02x
Transaction Size and Demographics
Median Principal Loan/Investment Size $150,000
Minimum Principal Loan/Investment Size $25,000
Maximum Principal Loan/Investment Size $1,500,000
LMI Census Tracts (by Number of Transactions) 0.0%
LMI Census Tracts (by Dollar Amount) 0.0%
Non-Metro Areas (by Number of Transactions) 89.5%
Non-Metro Areas (by Dollar Amount) 88.2%
Business Age and Size
Median Business Age at Loan/Investment 4
Median Business Size (FTEs) 5
Median Business Size (Annual Revenue) $175,019
Total Number of Jobs Created or Retained 842
Jobs Created 422
Jobs Retained 420
Top 3 Industries by Number of Transactions
Accommodation and Food Services 13
Retail Trade 4
Wholesale Trade 4
Manufacturing 4
Top 3 Industries by Dollar Amount
Accommodation and Food Services $3,561,500
Wholesale Trade $1,040,671
Manufacturing $950,000
Lender Participation
Small Lenders* (by Number of Transactions) 28.9%
Small Lenders (by Dollar Amount) 19.5%
* Includes Banks, Credit Unions, CDFIs, and Non-Financial Institution Lenders
with assets less than or equal to $1.22B
Puerto Rico
Allocation Amount: $14,605,823
Number of Loans/Investments 40
SSBCI Original Allocated Funds Expended $14,605,823
SSBCI Recycled Funds Expended $12,010,800
Total New Financing to Small Businesses $64,896,535
Leverage Ratio 4.44x
Transaction Size and Demographics
Median Principal Loan/Investment Size $1,249,013
Minimum Principal Loan/Investment Size $100,000
Maximum Principal Loan/Investment Size $9,050,000
LMI Census Tracts (by Number of Transactions) 25.0%
LMI Census Tracts (by Dollar Amount) 14.0%
Non-Metro Areas (by Number of Transactions) 7.5%
Non-Metro Areas (by Dollar Amount) 5.9%
Business Age and Size
Median Business Age at Loan/Investment 9
Median Business Size (FTEs) 37
Median Business Size (Annual Revenue) $4,559,623
Total Number of Jobs Created or Retained 4,541
Jobs Created 1,803
Jobs Retained 2,738
Top 3 Industries by Number of Transactions
Educational Services 11
Manufacturing 9
Professional, Scientic, and Technical Services 4
Accommodation and Food Services 4
Top 3 Industries by Dollar Amount
Educational Services $17,803,178
Manufacturing $11,155,483
Transportation and Warehousing $9,050,000
Lender Participation
Small Lenders* (by Number of Transactions) 92.5%
Small Lenders (by Dollar Amount) 70.6%
* Includes Banks, Credit Unions, CDFIs, and Non-Financial Institution Lenders
with assets less than or equal to $1.22B

SSBCI: Summary of States’ 2016 Annual Reports
53
APPENDIX A
U.S. Virgin Islands
Allocation Amount: $13,227,911
Number of Loans/Investments 36
SSBCI Original Allocated Funds Expended $7,034,454
SSBCI Recycled Funds Expended $0
Total New Financing to Small Businesses $18,744,390
Leverage Ratio 2.66x
Transaction Size and Demographics
Median Principal Loan/Investment Size $195,000
Minimum Principal Loan/Investment Size $16,000
Maximum Principal Loan/Investment Size $6,000,000
LMI Census Tracts (by Number of Transactions) 13.9%
LMI Census Tracts (by Dollar Amount) 5.3%
Non-Metro Areas (by Number of Transactions) 100.0%
Non-Metro Areas (by Dollar Amount) 100.0%
Business Age and Size
Median Business Age at Loan/Investment 2
Median Business Size (FTEs) 7
Median Business Size (Annual Revenue) $960,000
Total Number of Jobs Created or Retained 506
Jobs Created 161
Jobs Retained 345
Top 3 Industries by Number of Transactions
Health Care and Social Assistance 12
Retail Trade 6
Accommodation and Food Services 5
Top 3 Industries by Dollar Amount
Health Care and Social Assistance $6,701,000
Retail Trade $6,646,000
Arts, Entertainment, and Recreation $2,525,000
Lender Participation
Small Lenders* (by Number of Transactions) 19.4%
Small Lenders (by Dollar Amount) 20.5%
* Includes Banks, Credit Unions, CDFIs, and Non-Financial Institution Lenders
with assets less than or equal to $1.22B

APPENDIX B
54
SSBCI: Summary of States’ 2016 Annual Reports
Appendix B: SSBCI Funds Expended by
State Program
Approved State Program Program Type
Type of Administering
Entity
a
or VCP Strategy
b
Allocation
SSBCI Funds
Expended for Loans
or Investments
SSBCI Funds Expended
for Program
Administration
c
Recycled
Funds
Expended
Percent of
SSBCI Funds
Expended
d
# of
Transactions
Total Financing
Leveraged
Leverage
Ratio
e
Estimated # of Jobs
Median Size
of Business
Supported (FTEs)
Median Age
of Business
Supported (Years)
Percent of Transactions
to be
Created
to be
Retained
in LMI Areas
(by #)
in LMI Areas
(by $)
in Non-Metro
Areas (by #)
in Non-Metro
Areas (by $)
Alabama
Alabama CAP Program CAP Public Agency $1,870,000 $9,873 $163,801 $0 0.5% 8 $197,451 20.00 x 17 23 2.5 1.5 12.5% 28.7% 25.0% 26.2%
Alabama Loan Guarantee Program Loan Guarantee Public Agency $27,703,076 $27,561,498 $582,912 $46,584,781 99.5% 568 $224,211,265 8.13 x 2,361 4,050 3 3 34.2% 33.7% 43.8% 31.8%
Alabama Loan Participation Program Loan Participation Public Agency $1,870,000 $923,575 $0 49.4% 6 $6,585,750 7.13 x 26 56 9.5 7.5 33.3% 39.0% 0.0% 0.0%
Total $31,443,076 $28,494,946 $746,712 $46,584,781 93.0% 582 $230,994,466 7.90 x 2,404 4,129 3 3 33.8% 33.8% 43.1% 30.9%
Alaska—Anchorage
49th State Venture Fund Venture Capital State Agency; Fund $13,168,350 $1,289,625 $410,512 $0 9.8% 19 $6,657,375 5.16 x 51 16 3 0 26.3% 65.5% 0.0% 0.0%
Total $13,168,350 $1,289,625 $410,512 $0 12.9% 19 $6,657,375 3.92 x 51 16 3 0 26.3% 65.5% 0.0% 0.0%
American Samoa
American Samoa Venture Fund Venture Capital SSE $10,500,000 $0 $171,178 $0 0.0% 0 $0 N/A 0 0 N/A N/A N/A N/A N/A N/A
Total $10,500,000 $0 $171,178 $0 1.6% 0 $0 0.00 x 0 0 0 0 0.0% N/A 0.0% N/A
Arizona
Arizona Expansion Fund Loan Participation Quasi-Public Agency $18,286,556 $17,620,283 $666,273 $2,201,144 96.4% 61 $82,710,192 4.69 x 2,445 1,479 15 5 50.8% 37.9% 1.6% 9.0%
Total $18,286,556 $17,620,283 $666,273 $2,201,144 100.0% 61 $82,710,192 4.52 x 2,445 1,479 15 5 50.8% 37.9% 1.6% 9.0%
Arkansas
Arkansas Capital Access Program CAP Quasi-Public Agency $101,083 $31,438 $10,084 $20,712 31.1% 121 $1,536,148 48.86 x 155 235 2 2 34.7% 32.9% 21.5% 27.7%
Disadvantaged Business Enterprise/ Small Business Loan
Guaranty Program
Loan Guarantee Quasi-Public Agency $720,071 $709,173 $980,677 98.5% 15 $2,310,500 3.26 x 53 28 10 10 53.3% 60.0% 6.7% 1.7%
Bond Guaranty/ Loan Participation Program Loan Participation Quasi-Public Agency $4,690,312 $4,577,211 $76,789 97.6% 14 $67,044,000 14.65 x 459 59 4.5 2 21.4% 16.0% 57.1% 50.2%
Arkansas Development Finance Authority Co-investment
Fund
Venture Capital SSE $3,595,156 $3,474,521 $392,281 $650,000 96.6% 18 $27,766,759 7.99 x 230 0 15.5 3 50.0% 75.9% 0.0% 0.0%
Risk Capital Matching Fund Venture Capital SSE $1,297,352 $1,233,035 $462,923 95.0% 13 $96,769,187 78.48 x 55 7 8 4 84.6% 98.3% 0.0% 0.0%
Seed and Angel Capital Network Venture Capital Fund $2,823,937 $2,457,985 $0 87.0% 103 $28,395,865 11.55 x 457 38 2 1 47.6% 53.6% 1.0% 0.1%
Total $13,227,911 $12,483,364 $402,365 $2,191,101 97.4% 284 $223,822,458 17.37 x 1,409 367 2 1 43.0% 64.4% 12.7% 15.2%
California
California Capital Access Program (CalCAP) CAP Public Agency $19,574,379 $15,205,344 $2,198,276 $275,147 77.7% 8,908 $337,388,689 22.19 x 4,753 40,739 2 5 52.2% 46.9% 0.9% 1.1%
California Collateral Support Program (CalCSP) Collateral Support Public Agency $65,021,717 $55,434,096 $0 85.3% 135 $155,875,524 2.81 x 906 3,251 15 9 41.5% 33.7%
2.2% 0.9%
California Small Business Loan Guarantee Program Loan Guarantee Private Agency $83,802,979 $64,987,597 $1,980,571 $10,535,309 77.5% 1,243 $558,642,369 8.60 x 8,574 34,310 11 6 37.8% 37.1% 1.4% 0.7%
California Commercial Property Assessed Clean Energy Loan Participation Public Agency $0 $0 $0 0.0% 0 $0 N/A 0 0 N/A N/A N/A N/A N/A N/A
Total $168,399,074 $135,627,037 $4,178,847 $10,810,456 83.0% 10,286 $1,051,906,582 7.52 x 14,233 78,300 2 5 50.3% 39.8% 0.9% 0.8%
Colorado
Colorado Capital Access Program CAP Quasi-Public Agency $12,658 $12,166 $0 $0 96.1% 18 $603,283 49.59 x 18 0 2 1 100.0% 100.0% 100.0% 100.0%
Colorado Cash Collateral Support Program Collateral Support Quasi-Public Agency $17,298,779 $16,759,250 $462,831 $3,858,552 96.9% 201 $134,457,960 8.02 x 971 482 2 4 38.8% 37.2% 36.3% 18.7%
Total $17,311,437 $16,771,416 $462,831 $3,858,552 99.6% 219 $135,061,244 7.84 x 989 482 2 4 43.8% 37.5% 41.6% 19.1%
a Public, Quasi-Public, Private.
b Funds, SSE, State Agency, Co-investment Model.
c Non-CAP administration is not allocated to specic programs and is reported at the program category level.
d The percent expended for each state includes SSBCI funds expended for program administration; however, the percent expended shown for each approved state program does not include
funds expended for program administration.
e The overall leverage ratio for each state includes SSBCI funds expended for program administration; however, the leverage ratio shown for each approved state program does not include
funds expended for program administration.
(continued)
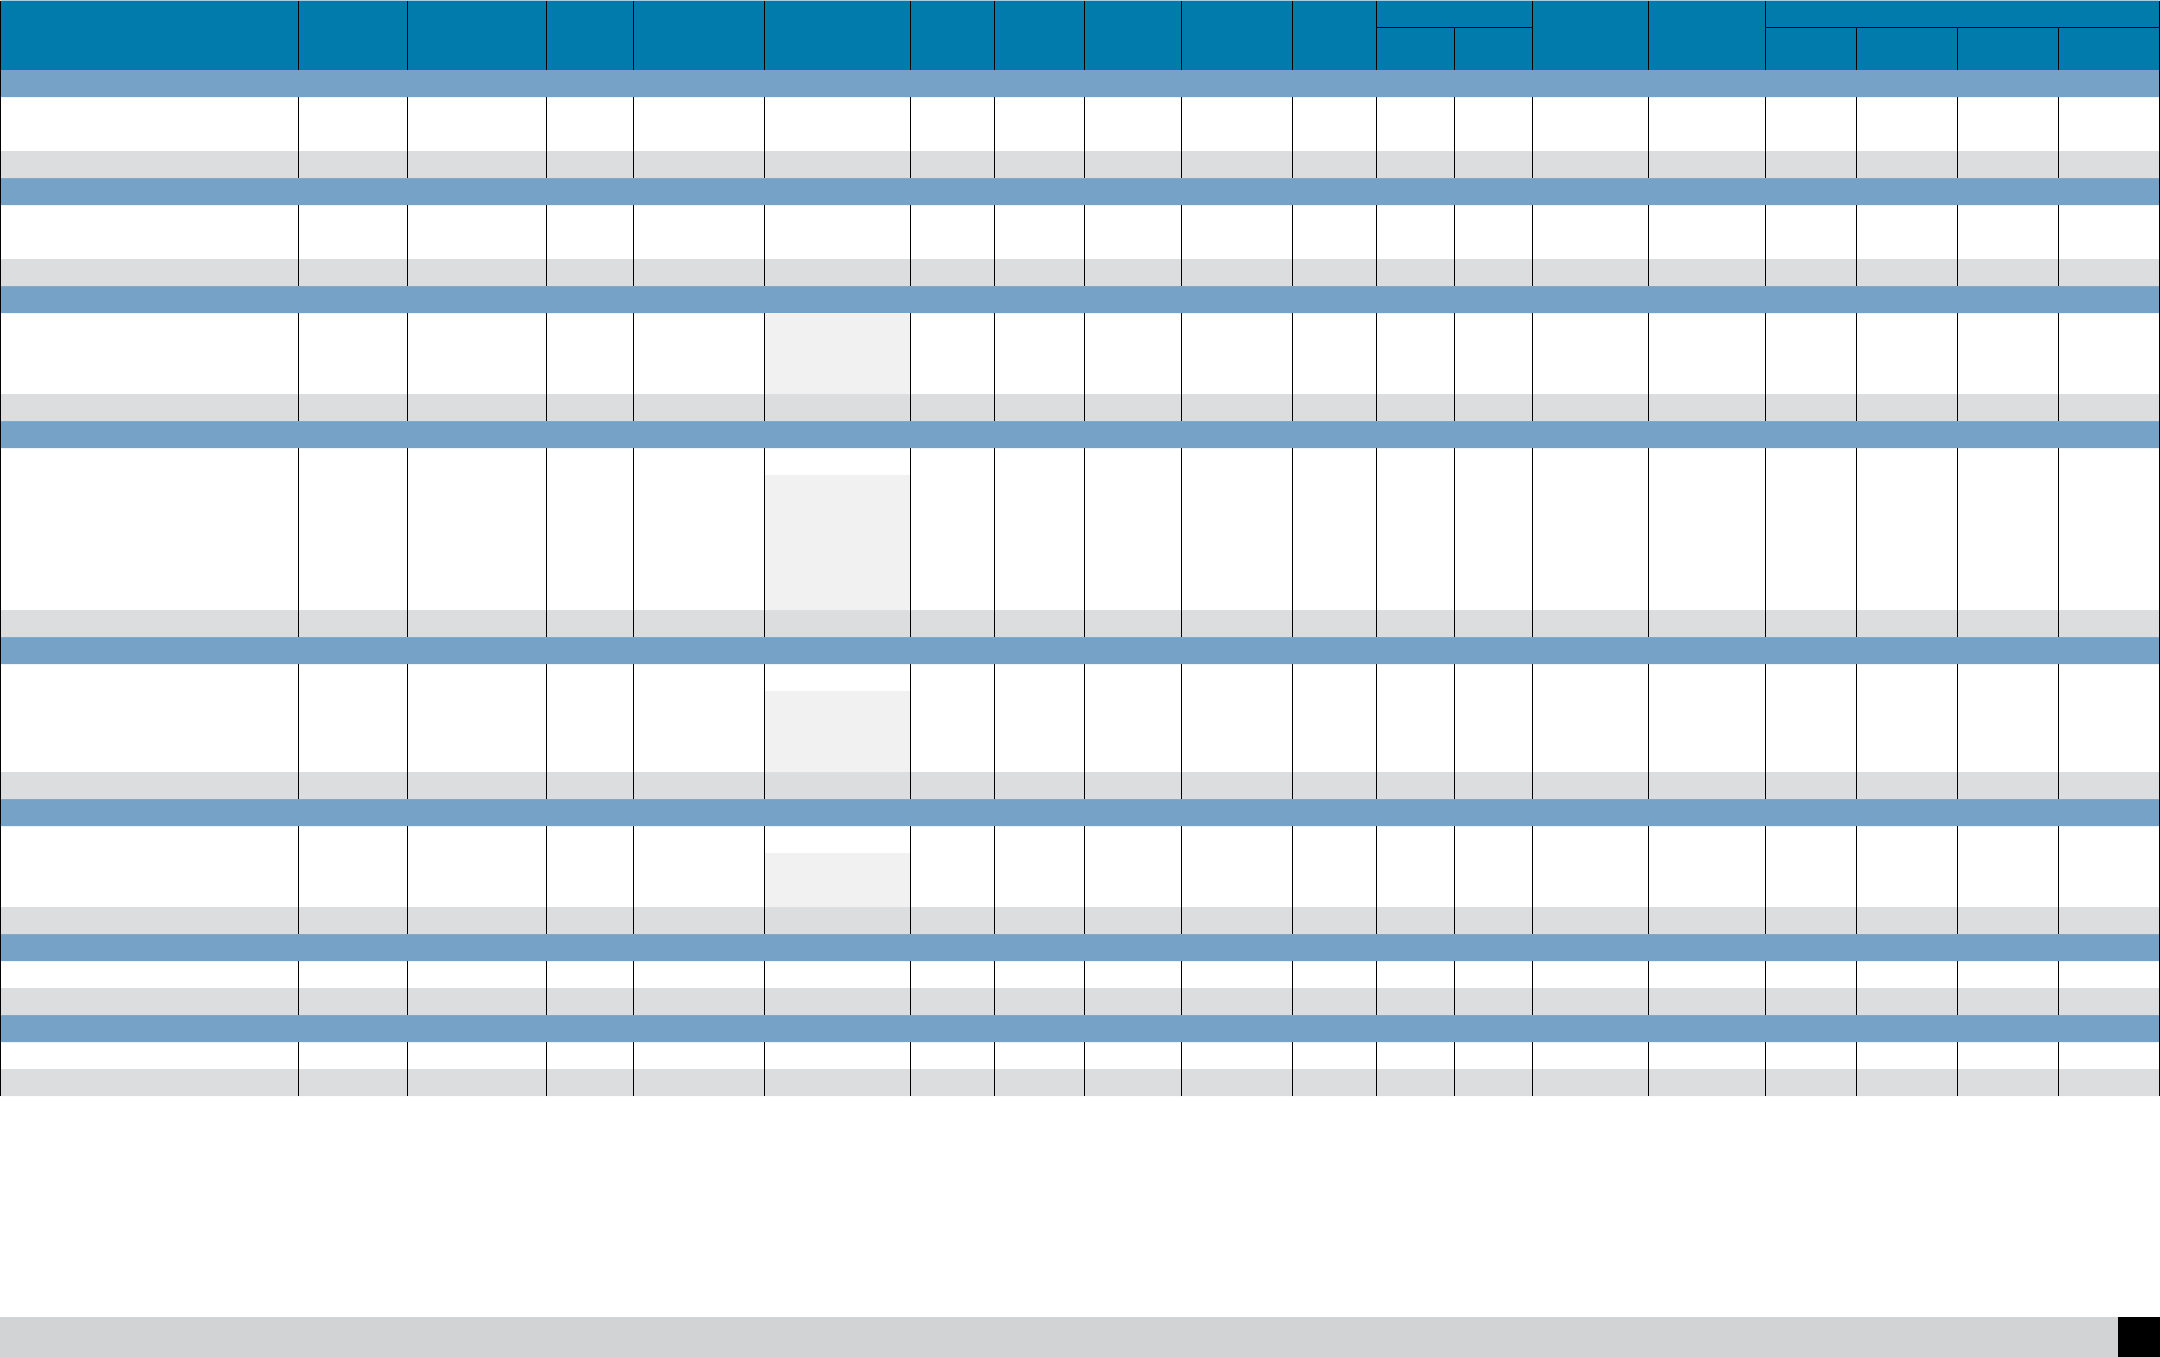
APPENDIX B
55
SSBCI: Summary of States’ 2016 Annual Reports
Approved State Program Program Type
Type of Administering
Entity
a
or VCP Strategy
b
Allocation
SSBCI Funds
Expended for Loans
or Investments
SSBCI Funds Expended
for Program
Administration
c
Recycled
Funds
Expended
Percent of
SSBCI Funds
Expended
d
# of
Transactions
Total Financing
Leveraged
Leverage
Ratio
e
Estimated # of Jobs
Median Size
of Business
Supported (FTEs)
Median Age
of Business
Supported (Years)
Percent of Transactions
to be
Created
to be
Retained
in LMI Areas
(by #)
in LMI Areas
(by $)
in Non-Metro
Areas (by #)
in Non-Metro
Areas (by $)
Connecticut
Connecticut Capital Access Program (CT-CAP) CAP Quasi-Public Agency $4,299 $0 $4,299 $0 0.0% 0 $0 N/A 0 0 N/A N/A N/A N/A N/A N/A
Seed and Early Stage Investment Fund (SESIF) Venture Capital SSE $13,356,989 $11,793,317 $3,509 $0 88.3% 19 $72,775,738 6.17 x 96 175 5 5 36.8% 23.7% 0.0% 0.0%
Total $13,361,288 $11,793,317 $7,808 $0 88.3% 19 $72,775,738 6.17 x 96 175 5 5 36.8% 23.7% 0.0% 0.0%
Delaware
Delaware Access Program CAP Public Agency $1,000,000 $174,855 $0 $0 17.5% 90 $5,080,697 29.06 x 269 500 3 3 23.3% 24.5% 25.6% 18.6%
DSF Participation and Loan Program Loan Participation Public Agency $12,227,911 $9,059,275 $0 $0 74.1% 37 $57,942,426 6.40 x 300 537 4 2 40.5% 24.7% 37.8% 62.9%
Total $13,227,911 $9,234,130 $0 $0 69.8% 127 $63,023,122 6.83 x 569 1,037 3 3 28.3% 24.7% 29.1% 59.3%
District of Columbia
DC Collateral Support Program Collateral Support Public Agency $8,227,911 $7,128,199 $0 86.6% 26 $16,938,500 2.38 x 158 555 11.5 7 46.2% 64.6% 0.0% 0.0%
DC Loan Participation Program Loan Participation Public Agency $2,000,000 $750,000 $147,080 $0 37.5% 3 $1,500,000 2.00 x 0 49 8 25 33.3% 33.3% 0.0% 0.0%
Innovation Finance Program Venture Capital Co-Investment Model $3,000,000 $885,000 $0 29.5% 4 $1,830,000 2.07 x 7 22 7 1.5 50.0% 19.7% 0.0% 0.0%
Total $13,227,911 $8,763,199 $147,080 $0 67.4% 33 $20,268,500 2.27 x 165 626 9 7 45.5% 58.3% 0.0% 0.0%
Florida
Florida Capital Access Program CAP Public Agency $500,000 $32,249 $324,767 $0 6.4% 95 $1,227,634 38.07 x 59 248 1.5 2 35.8% 22.0% 1.1% 0.3%
Florida Export Support Program Loan Guarantee Private Agency $5,000,000 $2,303,000 $0 46.1% 9 $7,840,000 3.40 x 27 67 5 6 11.1% 7.7% 0.0% 0.0%
Loan Guarantee Program Loan Guarantee Private Agency $33,600,000 $13,806,213 $8,572,426 41.1% 51 $77,341,670 5.60 x 1,493 226 18 10 43.1% 38.8% 5.9% 2.0%
Direct Loan Program Loan Participation Public Agency $0 $0 $2,279,211 $0 0.0% 0 $0 N/A 0 0 N/A N/A N/A N/A N/A N/A
Loan Participation Program Loan Participation Private Agency $32,504,081 $32,504,081 $24,342,546 100.0% 68 $167,459,317 5.15 x 983 56 3.5 2.5 30.9% 28.8% 5.9% 8.3%
Florida Venture Capital Program Venture Capital Fund $26,500,000 $24,980,147 $0 94.3% 55 $135,522,121 5.43 x 738 476 7 5 65.5% 46.6% 0.0% 0.0%
Total $98,104,081 $73,625,689 $2,603,979 $32,914,972 77.7% 278 $389,390,741 5.11 x 3,300 1,073 4 4 41.0% 36.5% 2.9% 4.0%
Georgia
Georgia Capital Access Program CAP Public Agency $0 $0 $0 $0 0.0% 0 $0 N/A 0 0 N/A N/A N/A N/A N/A N/A
Georgia Small Business Credit Guarantee Program Loan Guarantee Private Agency $12,808,507 $10,199,840 $30,000 79.6% 382 $72,843,444 7.14 x 1,063 1,275 4 5 29.1% 27.5% 4.7% 5.9%
Georgia Funding for CDFIs Loan Participation Private Agency $20,000,000 $19,758,228 $1,756,277 $4,491,550 98.8% 81 $129,335,043 6.55 x 816 394 6 5 48.1% 37.8% 28.4% 17.6%
Georgia Loan Participation Program Loan Participation Public Agency $15,216,241 $11,457,702 $0 75.3% 36 $74,006,674 6.46 x 321 158 6 3.5 47.2% 35.6% 30.6% 17.9%
Total $48,024,748 $41,415,770 $1,756,277 $4,521,550 89.9% 499 $276,185,161 6.40 x 2,200 1,827 4 5 33.5% 34.5% 10.4% 14.6%
Guam
Guam Capital Access Program CAP Quasi-Public Agency $658,417 $0 $14,223 $0 0.0% 0 $0 N/A 0 0 N/A N/A N/A N/A N/A N/A
Guam Credit Guarantee Program Loan Guarantee Quasi-Public Agency $9,935,823 $5,314,385
$468,602
$0 53.5% 42 $10,048,996 1.89 x 523 265 3 1 31.0% 55.1% 92.9% 98.3%
Guam Loan Participation Program Loan Participation Quasi-Public Agency $2,633,671 $0 $0 0.0% 0 $0 N/A 0 0 N/A N/A N/A N/A N/A N/A
Total $13,227,911 $5,314,385 $482,825 $0 43.8% 42 $10,048,996 1.73 x 523 265 3 1 31.0% 55.1% 92.9% 98.3%
Hawaii
HSDC Venture Capital Investment Program Venture Capital Fund $13,227,911 $5,236,849 $239,834 $0 39.6% 120 $181,849,084 34.72 x 159 520 3 0 28.3% 25.1% 10.0% 3.2%
Total $13,227,911 $5,236,849 $239,834 $0 41.4% 120 $181,849,084 33.20 x 159 520 3 0 28.3% 25.1% 10.0% 3.2%
Idaho
Collateral Support Program Collateral Support Quasi-Public Agency $13,195,667 $12,655,537 $481,006 $10,559,488 95.9% 315 $208,186,678 16.45 x 1,051 2,030 8 6 26.7% 28.9% 30.5% 27.7%
Total $13,195,667 $12,655,537 $481,006 $10,559,488 99.6% 315 $208,186,678 15.85 x 1,051 2,030 8 6 26.7% 28.9% 30.5% 27.7%
(continued)

APPENDIX B
56
SSBCI: Summary of States’ 2016 Annual Reports
Approved State Program Program Type
Type of Administering
Entity
a
or VCP Strategy
b
Allocation
SSBCI Funds
Expended for Loans
or Investments
SSBCI Funds Expended
for Program
Administration
c
Recycled
Funds
Expended
Percent of
SSBCI Funds
Expended
d
# of
Transactions
Total Financing
Leveraged
Leverage
Ratio
e
Estimated # of Jobs
Median Size
of Business
Supported (FTEs)
Median Age
of Business
Supported (Years)
Percent of Transactions
to be
Created
to be
Retained
in LMI Areas
(by #)
in LMI Areas
(by $)
in Non-Metro
Areas (by #)
in Non-Metro
Areas (by $)
Illinois
Capital Access Program CAP Public Agency $30,000 $20,470 $0 $0 68.2% 12 $644,898 31.50 x 54 47 1.5 6 16.7% 12.4% 0.0% 0.0%
Collateral Support Program Collateral Support Public Agency $1,622,500 $1,622,500
$2,889,283
$0 100.0% 5 $16,626,215 10.25 x 113 50 35 7 0.0% 0.0% 20.0% 76.6%
Conditional Direct Loan Program Loan Participation Public Agency $500,000 $500,000 $0 100.0% 1 $3,698,573 7.40 x 35 0 0 10 100.0% 100.0% 0.0% 0.0%
Participation Loan Program Loan Participation Public Agency $70,516,215 $59,291,702 $4,450,000 84.1% 198 $512,877,716 8.65 x 2,363 1,197 13 6 36.4% 49.3% 15.7% 7.3%
Venture Capital Program Venture Capital Public Agency $6,051,000 $6,051,000 $0 100.0% 24 $129,975,502 21.48 x 392 176 4 2.5 16.7% 30.0% 0.0% 0.0%
Total $78,719,715 $67,485,672 $2,889,283 $4,450,000 89.4% 240 $663,822,904 9.43 x 2,957 1,470 10 6 32.9% 44.5% 13.3% 7.5%
Indiana
Indiana Capital Access Program CAP Quasi-Public Agency $400,000 $393,528 $0 $0 98.4% 140 $9,632,054 24.48 x 165 344 3 4 32.1% 24.9% 8.6% 8.2%
State Venture Capital Program Venture Capital Co-Investment Model; SSE $34,094,392 $19,159,498 $685,625 $0 56.2% 101 $58,270,436 3.04 x 448 338 6 3 28.7% 17.8% 5.0% 6.9%
Total $34,494,392 $19,553,026 $685,625 $0 58.7% 241 $67,902,490 3.36 x 613 681 5 4 30.7% 18.8% 7.1% 7.1%
Iowa
Iowa Capital Access Program CAP Private Agency $9,624 $9,624 $0 $0 100.0% 3 $215,563 22.40 x 5 1 1 20 0.0% 0.0% 100.0% 100.0%
Iowa Small Business Loan Program Loan Participation Private Agency $31,455 $31,455
$157,709
$0 100.0% 14 $416,400 13.24 x 13 15 1 0 50.0% 56.6% 14.3% 17.4%
Iowa Demonstration Fund Program Venture Capital State Agency $13,082,082 $8,200,000 $0 62.7% 28 $45,234,800 5.52 x 285 188 6.5 3 17.9% 5.8% 7.1% 1.5%
Total $13,123,161 $8,241,080 $157,709 $0 64.0% 45 $45,866,763 5.46 x 303 204 4 2 26.7% 6.3% 15.6% 2.2%
Kansas
Kansas Capital Multiplier Loan Fund Loan Participation Quasi-Public Agency $9,277,406 $8,642,818
$346,080
$1,255,243 93.2% 66 $169,732,883 19.64 x 648 434 7.75 3 37.9% 42.6% 40.9% 49.9%
Kansas Capital Multiplier Venture Fund Venture Capital Co-Investment Model $3,950,505 $3,782,045 $0 95.7% 26 $61,838,293 16.35 x 600 87 4.5 2 30.8% 39.9% 23.1% 19.4%
Total $13,227,911 $12,424,863 $346,080 $1,255,243 96.5% 92 $231,571,176 18.13 x 1,248 521 6.75 3 35.9% 41.9% 35.9% 41.8%
Kentucky
Kentucky Capital Access Program CAP Public Agency $6,102 $3,102 $2,202 $0 50.8% 2 $105,306 33.95 x 15 2 28 10 50.0% 62.0% 0.0% 0.0%
Kentucky Collateral Support Program Collateral Support Public Agency $15,280,920 $14,328,089
$103,063
$0 93.8% 155 $115,601,318 8.07 x 1,103 1,280 5 6 44.5% 53.8% 45.2% 47.7%
Kentucky Loan Participation Program Loan Participation Public Agency $271,029 $271,029 $0 100.0% 4 $6,445,147 23.78 x 4 16 6 3 25.0% 6.4% 100.0%
100.0%
Total $15,558,051 $14,602,221 $105,265 $0 94.5% 161 $122,151,772 8.31 x 1,122 1,298 5 5 44.1% 51.3% 46.0% 50.4%
Louisiana
Small Business Loan Guarantee Loan Guarantee Public Agency $7,639,228 $5,109,272
$203,365
$0 66.9% 42 $26,949,773 5.27 x 452 432 6 2 23.8% 26.6% 16.7% 30.7%
Louisiana Seed Capital Program Venture Capital Fund $4,775,767 $3,510,000 $0 73.5% 43 $28,696,084 8.18 x 466 368 3 2 14.0% 7.3% 0.0% 0.0%
Total $12,414,995 $8,619,272 $203,365 $0 71.1% 85 $55,645,857 6.31 x 918 800 4 2 18.8% 16.6% 8.2% 14.8%
Maine
Economic Recovery Loan Fund Loan Participation Quasi-Public Agency $3,727,911 $1,693,021 $0 45.4% 7 $16,577,011 9.79 x 26 129 14 2 28.6% 47.8% 42.9% 37.1%
Regional Economic Development Revolving Loan Program Loan Participation Quasi-Public Agency $4,683,165 $3,003,394 $252,948 $0 64.1% 41 $23,075,955 7.68 x 170 165 3 2 26.8% 18.3% 36.6% 18.6%
Small Enterprise Growth Fund Venture Capital SSE $4,816,835 $3,374,512 $0 70.1% 26 $17,704,428 5.25 x 138 398 10 5 23.1% 32.4% 7.7% 4.1%
Total $13,227,911 $8,070,926 $252,948 $0 62.9% 74 $57,357,394 6.89 x 334 692 6 3 25.7% 31.2% 27.0% 19.5%
Maryland
MIDFA Loan Guarantee Public Agency $827,778 $724,164
$320,500
$0 87.5% 7 $11,671,500 16.12 x 93 234 9 10 42.9% 89.1% 0.0% 0.0%
MSBDFA Loan Guaranty Loan Guarantee Public Agency $1,485,000 $232,250 $0 15.6% 11 $2,043,000 8.80 x 65 107 1 2 36.4% 57.4% 0.0% 0.0%
DHCD - Neighborhood Business Works Program Loan Participation Public Agency $1,500,000 $925,000 $0 61.7% 3 $13,525,962 14.62 x 157 8 2 1 33.3% 84.0% 0.0% 0.0%
Maryland Venture Fund IV Venture Capital SSE $19,212,931 $11,923,356 $0 62.1% 34 $378,004,910 31.70 x 758 829 17 6 20.6% 36.2% 0.0% 0.0%
Total $23,025,709 $13,804,770 $320,500 $0 61.3% 55 $405,245,372 28.69 x 1,073 1,178 15 6 27.3% 39.4% 0.0% 0.0%
(continued)

APPENDIX B
57
SSBCI: Summary of States’ 2016 Annual Reports
Approved State Program Program Type
Type of Administering
Entity
a
or VCP Strategy
b
Allocation
SSBCI Funds
Expended for Loans
or Investments
SSBCI Funds Expended
for Program
Administration
c
Recycled
Funds
Expended
Percent of
SSBCI Funds
Expended
d
# of
Transactions
Total Financing
Leveraged
Leverage
Ratio
e
Estimated # of Jobs
Median Size
of Business
Supported (FTEs)
Median Age
of Business
Supported (Years)
Percent of Transactions
to be
Created
to be
Retained
in LMI Areas
(by #)
in LMI Areas
(by $)
in Non-Metro
Areas (by #)
in Non-Metro
Areas (by $)
Massachusetts
Capital Access Program CAP Public Agency $1,500,000 $1,249,809 $249,274 $63,592 83.3% 912 $40,814,149 32.66 x 728 5,428 3 5 24.8% 23.1% 2.5% 3.4%
MBDC Loan Participation Loan Participation Private Agency $5,013,000 $4,922,379
$183,556
$1,642,121 98.2% 16 $58,828,000 11.95 x 93 1,491 35 23 18.8% 29.9% 6.3% 5.1%
MGCC Loan Participation Loan Participation Quasi-Public Agency $14,001,536 $13,909,518 $2,723,057 99.3% 87 $33,265,150 2.39 x 474 3,739 22 18 33.3% 35.4% 1.1% 2.0%
Total $20,514,536 $20,081,705 $432,831 $4,428,770 100.0% 1,015 $132,907,299 6.48 x 1,295 10,658 4 6 25.4% 29.2% 2.5% 3.8%
Michigan
CAP Program CAP Quasi-Public Agency $2,200,000 $1,563,282 $0 $0 71.1% 790 $79,538,921 50.88 x 1,238 3,958 3 5 31.0% 27.0% 43.8% 36.8%
Michigan Business Growth Fund/ Collateral Support Collateral Support Quasi-Public Agency $44,166,888 $43,808,853
$2,203,003
$23,143,627 99.2% 89 $322,788,748 7.37 x 3,672 472 29 15 31.5% 28.8% 22.5% 22.0%
Michigan Loan Guarantee Program Loan Guarantee Quasi-Public Agency $2,000,000 $305,955 $0 15.3% 38 $5,483,330 17.92 x 172 155 3 3.5 63.2% 64.6% 2.6% 2.0%
Michigan Business Growth Fund/ Loan Participations Loan Participation Quasi-Public Agency $25,148,889 $24,796,758 $3,544,575 98.6% 34 $99,512,700 4.01 x 1,292 133 15.5 15 61.8% 75.4% 58.8% 72.3%
Small Business Mezzanine Fund Venture Capital Fund $6,000,000 $2,607,109 $0 43.5% 11 $17,935,799 6.88 x 124 0 15 3 45.5% 42.9% 0.0% 0.0%
Total $79,515,777 $73,081,957 $2,203,003 $26,688,202 94.7% 962 $525,259,498 6.98 x 6,498 4,718 4 5 33.6% 38.2% 40.2% 32.8%
Minnesota
Capital Access Program CAP Public Agency $500,000 $385,238 $22,524 $0 77.0% 94 $24,315,169 63.12 x 345 737 2 6 47.9% 37.3% 18.1% 30.2%
General Loan Guarantee Program Loan Guarantee Public Agency $1,470,215 $1,397,115 $0 95.0% 9 $39,703,319 28.42 x 121 182 22 2 66.7% 51.2% 44.4% 47.0%
Emerging Entrepreneurs Fund Loan Participation Public Agency $6,862,908 $6,153,075 $432,085 $543,943 89.7% 166 $69,828,759 11.35 x 679 1,439 2 2.5 52.4% 35.4% 16.3% 24.9%
Angel Loan Fund Venture Capital Co-Investment Model $6,700,000 $3,496,700 $0 52.2% 23 $41,071,157 11.75 x 157 179 4 4 39.1% 38.2% 0.0% 0.0%
Total $15,533,123 $11,432,128 $454,609 $543,943 76.5% 292 $174,918,405 14.72 x 1,302 2,537 2 4 50.3% 39.9% 16.4% 24.8%
Mississippi
Small Business Loan Guaranty Program Loan Guarantee Public Agency $13,227,911 $11,753,551 $4,100 $0 88.9% 119 $85,139,656 7.24 x 796 212 2 1 27.7% 24.8% 47.1% 59.6%
Total $13,227,911 $11,753,551 $4,100 $0 88.9% 119 $85,139,656 7.24 x 796 212 2 1 27.7% 24.8% 47.1% 59.6%
Missouri
Grow Missouri Loan Fund Loan Participation Quasi-Public Agency $2,206,742 $2,094,293
$910,907
$0 94.9% 3 $16,960,711 8.10 x 31 111 22 10 33.3% 44.9% 0.0% 0.0%
Missouri IDEA Fund Venture Capital SSE $24,845,359 $20,781,781 $284,101 83.6% 90 $356,884,466 17.17 x 1,217 253 2 3 47.8% 34.9% 2.2% 0.7%
Total $27,052,101 $22,876,073 $910,907 $284,101 87.9% 93 $373,845,177 15.72 x 1,248 364 2 3 47.3% 35.3% 2.2% 0.6%
Montana
Loan Participation Program Loan Participation Public Agency $12,819,143 $12,303,853 $465,953 $0 96.0% 50 $120,918,506 9.83 x 825 185 10 10.5 30.0% 33.4% 56.0% 35.5%
Total $12,819,143 $12,303,853 $465,953 $0 99.6% 50 $120,918,506 9.47 x 825 185 10 10.5 30.0% 33.4% 56.0% 35.5%
Nebraska
Nebraska Progress Loan Fund Loan Participation Public Agency $9,240,980 $9,000,000
$473,604
$1,513,156 97.4% 15 $69,688,437 7.74 x 304 106 6 4 33.3% 25.6% 80.0% 93.7%
Nebraska Progress Seed Fund Venture Capital SSE $3,927,370 $2,961,500 $0 75.4% 39 $20,955,890 7.08 x 48 89 3 0 61.5% 44.9% 10.3% 14.2%
Total $13,168,350 $11,961,500 $473,604 $1,513,156 94.4% 54 $90,644,327 7.29 x 352 195 3 0 53.7% 30.0% 29.6% 75.3%
Nevada
Nevada Collateral Support Program Collateral Support Public Agency $8,293,599 $6,020,406 $0 72.6% 15 $23,205,560 3.85 x 276 198 7 3 26.7% 11.0% 6.7% 26.2%
Nevada Microenterprise Initiative Loan Participation Public Agency $500,000 $0 $417,062 $0 0.0% 0 $0 N/A 0 0 N/A N/A N/A N/A N/A N/A
Battle Born Growth Escalator (BBGE) Venture Capital SSE $5,000,000 $2,600,000 $0 52.0% 7 $15,720,000 6.05 x 207 103 9 2 42.9% 37.3% 0.0% 0.0%
Total $13,793,599 $8,620,406 $417,062 $0 65.5% 22 $38,925,560 4.31 x 483 301 8 2 31.8% 21.6% 4.5% 15.6%
New Hampshire
Capital Access Program CAP Quasi-Public Agency $454,895 $454,887 $0 $0 100.0% 300 $14,169,520 31.15 x 242 1,672 2 6 38.0% 25.8% 60.0% 46.0%
Collateral Shortfall Program Collateral Support Quasi-Public Agency $2,594,851 $2,594,851
$51,000
$0 100.0% 7 $31,380,195 12.09 x 92 320 50 31 0.0% 0.0% 28.6% 46.5%
Loan Guarantee Reserves Loan Guarantee Quasi-Public Agency $2,813,821 $2,813,820 $0 100.0% 8 $40,995,807 14.57 x 31 769 31 20 12.5% 3.7% 37.5% 29.3%
Aid to Local Development Organizations Loan Participation Quasi-Public Agency $4,815,400 $4,764,400 $0 98.9% 20 $28,943,087 6.07 x 226 1,000 20 4 25.0% 11.7% 15.0% 1.9%
Venture Capital Fund Venture Capital Fund $2,489,383 $1,975,763 $0 79.4% 15 $61,442,726 31.10 x 170 270 10 2 53.3% 60.2% 46.7% 39.8%
Total $13,168,350 $12,603,720 $51,000 $0 96.1% 350 $176,931,335 13.98 x 761 4,031 3 6 36.6% 25.7% 55.7% 32.8%
(continued)

APPENDIX B
58
SSBCI: Summary of States’ 2016 Annual Reports
Approved State Program Program Type
Type of Administering
Entity
a
or VCP Strategy
b
Allocation
SSBCI Funds
Expended for Loans
or Investments
SSBCI Funds Expended
for Program
Administration
c
Recycled
Funds
Expended
Percent of
SSBCI Funds
Expended
d
# of
Transactions
Total Financing
Leveraged
Leverage
Ratio
e
Estimated # of Jobs
Median Size
of Business
Supported (FTEs)
Median Age
of Business
Supported (Years)
Percent of Transactions
to be
Created
to be
Retained
in LMI Areas
(by #)
in LMI Areas
(by $)
in Non-Metro
Areas (by #)
in Non-Metro
Areas (by $)
New Jersey
New Jersey Credit Guarantee Program Loan Guarantee Quasi-Public Agency $3,227,500 $2,227,500
$0
$0 69.0% 7 $4,455,000 2.00 x 49 49 7 20 0.0% 0.0% 0.0% 0.0%
New Jersey Direct Loan Program Loan Participation Quasi-Public Agency $9,250,000 $7,384,500 $0 79.8% 8 $23,038,000 3.12 x 184 297 12 12 37.5% 47.8% 0.0% 0.0%
New Jersey Loan Participation Program Loan Participation Quasi-Public Agency $16,071,686 $10,313,900 $0 64.2% 20 $37,589,044 3.64 x 224 644 26 15.5 35.0% 31.3% 0.0% 0.0%
New Jersey Venture Capital Fund Program Venture Capital Fund $5,345,965 $5,345,965 $0 100.0% 38 $58,524,010 10.95 x 504 174 21 2 5.3% 4.4% 0.0% 0.0%
Total $33,895,151 $25,271,865 $0 $0 74.6% 73 $123,606,054 4.89 x 961 1,164 17 3 16.4% 20.5% 0.0% 0.0%
New Mexico
New Mexico Loan Participation Program Loan Participation Public Agency $8,227,911 $7,837,387
$262,284
$385,072 95.3% 17 $51,794,930 6.61 x 212 13 5 7 35.3% 28.8% 17.6% 27.2%
New Mexico Micro Fund-of-Funds Venture Capital Public Agency $5,000,000 $0 $0 0.0% 0 $0 N/A 0 0 N/A N/A N/A N/A N/A N/A
Total $13,227,911 $7,837,387
$262,284
$385,072 61.2% 17 $51,794,930 6.39 x 212 13 5 7 35.3% 28.8% 17.6% 27.2%
New York
New York Capital Access Program CAP Public Agency $7,923,570 $2,703,021 $250,026 $0 34.1% 1,580 $50,290,401 18.61 x 2,198 4,084 1 4 65.5% 48.6% 0.6% 2.6%
Bonding Guarantee Assistance Program Loan Guarantee Public Agency $10,405,173 $6,985,000
$779,654
$0 67.1% 19 $35,400,000 5.07 x 0 0 8 11 26.3% 25.4% 0.0% 0.0%
Innovate New York Fund Venture Capital Fund $37,273,149 $31,610,506 $0 84.8% 165 $611,578,793 19.35 x 887 1,039 5 3 18.8% 29.7% 5.5% 2.2%
Total $55,601,892 $41,298,527 $1,029,680 $0 76.1% 1,764 $697,269,194 16.47 x 3,085 5,123 1 4 60.7% 30.8% 1.1% 2.1%
North Carolina
North Carolina Capital Access Program CAP Private Agency $1,761,319 $690,269 $1,071,050 $66,478 39.2% 377 $34,828,561 50.46 x 1,473 3,043 4 3 17.0% 8.6% 7.7% 8.2%
North Carolina Loan Participation Program Loan Participation Private Agency $34,208,338 $33,546,961
$614,794
$8,766,080 98.1% 303 $351,437,318 10.48 x 1,704 4,670 9 9 17.5% 21.8% 23.8% 18.5%
North Carolina Venture Capital Fund-of-Funds Program Venture Capital Fund $10,300,000 $10,097,924 $0 98.0% 89 $320,792,760 31.77 x 556 1,079 6 4 31.5% 21.5% 3.4% 5.8%
Total $46,269,657 $44,335,154 $1,685,844 $8,832,559 99.5% 769 $707,058,639 15.36 x 3,733 8,792 5 5 18.9% 21.0% 13.5% 12.3%
North Dakota—Carrington
Credit Guarantee Program Collateral Support Private Agency $3,279,078 $2,763,850
$125,674
$300,000 84.3% 20 $7,153,882 2.59 x 33 80 3.5 2 10.0% 8.3% 80.0% 82.4%
Seed Capital Network Program Venture Capital Fund $154,631 $125,000 $0 80.8% 1 $850,000 6.80 x 4 2 1 6 0.0% 0.0% 100.0% 100.0%
Total $3,433,709 $2,888,850 $125,674 $300,000 87.8% 21 $8,003,882 2.66 x 37 82 3 2 9.5% 7.4% 81.0% 84.3%
North Dakota—Mandan
Loan Participation Program
Loan Participation Private Agency $9,734,641 $9,495,593 $239,048 $4,497,861 97.5% 44 $84,060,392 8.85 x 506 202 11 1.5 31.8% 20.4% 31.8% 18.6%
Total $9,734,641 $9,495,593 $239,048 $4,497,861 100.0% 44 $84,060,392 8.64 x 506 202 11 1.5 31.8% 20.4% 31.8% 18.6%
Northern Mariana Islands
CNMI Collateral Support Program Collateral Support Public Agency $8,478,157 $3,614,471
$163,629
$0 42.6% 31 $7,360,500 2.04 x 234 394 5 5 0.0% 0.0% 90.3% 89.8%
CNMI Loan Purchase Participation Program Loan Participation Public Agency $4,254,925 $602,268 $0 14.2% 7 $1,505,671 2.50 x 188 26 4 1 0.0% 0.0% 85.7% 80.1%
Total $12,733,082 $4,216,739 $163,629 $0 34.4% 38 $8,866,171 2.02 x 422 420 5 4 0.0% 0.0% 89.5% 88.2%
Ohio
Ohio Capital Access Program CAP Public Agency $521,451 $490,247 $0 $0 94.0% 245 $13,990,772 28.54 x 1,103 1,733 4 5 21.6% 23.4% 13.9% 13.8%
Small Business Collateral Enhancement Collateral Support Public Agency $46,386,699 $35,034,450
$1,386,641
$0 75.5% 299 $139,527,252 3.98 x 2,159 3,054 5 6 30.1% 22.6% 14.4% 13.2%
Targeted Investment Program Venture Capital State Agency $8,450,000 $7,593,725 $0 89.9% 7 $24,175,963 3.18 x 118 78 11 5 57.1% 69.9% 14.3% 6.2%
Total $55,358,150 $43,118,421 $1,386,641 $0 80.4% 551 $177,693,987 3.99 x 3,380 4,865 4 5 26.7% 29.1% 14.2% 12.3%
Oklahoma
Accelerate Oklahoma Fund Venture Capital SSE $13,227,911 $11,902,192 $445,719 $0 90.0% 49 $85,645,841 7.20 x 743 53 3 3 81.6% 81.1% 6.1% 2.5%
Total $13,227,911 $11,902,192 $445,719 $0 93.3% 49 $85,645,841 6.94 x 743 53 3 3 81.6% 81.1% 6.1% 2.5%
Oregon
Capital Access Program CAP Public Agency $166,197 $143,031 $16,416 $0 86.1% 88 $8,549,563 59.77 x 196 447 4 3 25.0% 18.1% 10.2% 3.1%
Credit Enhancement Fund Loan Guarantee Public Agency $12,924,704 $12,258,079
$501,254
$911,354 94.8% 163 $142,139,140 11.60 x 532 344 9 7 39.3% 36.0% 33.7% 25.4%
Oregon Business Development Fund Loan Participation Public Agency $3,500,000 $3,360,669 $100,000 96.0% 14 $24,974,411 7.43 x 159 18 15 7.5 35.7% 57.7% 21.4% 24.0%
Total $16,590,901 $15,761,779 $517,670 $1,011,354 98.1% 265 $175,663,114 10.79 x 887 809 7 5 34.3% 38.2% 25.3% 24.1%
(continued)

APPENDIX B
59
SSBCI: Summary of States’ 2016 Annual Reports
Approved State Program Program Type
Type of Administering
Entity
a
or VCP Strategy
b
Allocation
SSBCI Funds
Expended for Loans
or Investments
SSBCI Funds Expended
for Program
Administration
c
Recycled
Funds
Expended
Percent of
SSBCI Funds
Expended
d
# of
Transactions
Total Financing
Leveraged
Leverage
Ratio
e
Estimated # of Jobs
Median Size
of Business
Supported (FTEs)
Median Age
of Business
Supported (Years)
Percent of Transactions
to be
Created
to be
Retained
in LMI Areas
(by #)
in LMI Areas
(by $)
in Non-Metro
Areas (by #)
in Non-Metro
Areas (by $)
Pennsylvania
Machinery and Equipment Loan Fund Loan Participation Public Agency $9,000,000 $3,413,000 $0 37.9% 2 $6,993,734 2.05 x 0 193 96.5 64 50.0% 16.8% 0.0% 0.0%
Pennsylvania Community Development Bank Program Loan Participation Public Agency $6,512,500 $4,790,972 $597,648 73.6% 109 $38,679,489 8.07 x 390 528 1 2 54.1% 46.8% 13.8% 11.7%
Pennsylvania Economic Development Finance Authority
Program
Loan Participation Public Agency $8,504,928 $5,209,481 $294,395 $288,738 61.3% 33 $61,380,476 11.78 x 512 1,175 10 6 24.2% 15.6% 21.2% 8.0%
Ben Franklin Technology Partners and Life Sciences
Greenhouse Partners
Venture Capital SSE $5,000,000 $4,905,022 $178,715 98.1% 45 $134,257,622 27.37 x 226 261 3 4 33.3% 26.1% 8.9% 5.8%
Total $29,017,428 $18,318,475 $294,395 $1,065,101 64.1% 189 $241,311,321 12.96 x 1,128 2,157 2 3 43.9% 26.5% 13.8% 7.1%
Puerto Rico
Loan Participation Loan Participation Quasi-Public Agency $13,605,823 $13,605,823
$0
$12,010,800 100.0% 39 $55,846,535 4.10 x 1,503 2,637 35 9 25.6% 16.3% 7.7% 6.9%
Venture Capital Venture Capital SSE $1,000,000 $1,000,000 $0 100.0% 1 $9,050,000 9.05 x 300 101 101 1 0.0% 0.0% 0.0% 0.0%
Total $14,605,823 $14,605,823 $0 $12,010,800 100.0% 40 $64,896,535 4.44 x 1,803 2,738 37 8.5 25.0% 14.0% 7.5% 5.9%
Rhode Island
Small Business Loan Fund Loan Participation Quasi-Public Agency $2,168,350 $300,000 $0 13.8% 2 $4,730,000 15.77 x 5 67 33.5 42.5 0.0% 0.0% 0.0% 0.0%
Betaspring Venture Capital Fund $2,000,000 $1,869,284 $238,024 $0 93.5% 53 $15,969,371 8.54 x 18 105 2 0 83.0% 71.4% 0.0% 0.0%
Slater Technology Fund Venture Capital SSE $9,000,000 $5,808,737 $0 64.5% 31 $100,754,839 17.35 x 112 183 5 2 41.9% 37.1% 0.0% 0.0%
Total $13,168,350 $7,978,021 $238,024 $0 62.4% 86 $121,454,210 14.78 x 135 355 2 0 66.3% 40.1% 0.0% 0.0%
South Carolina
South Carolina Capital Access Program CAP Private Agency $130,716 $130,716 $0 $0 100.0% 44 $6,717,112 51.39 x 82 686 15.5 6 25.0% 24.3% 11.4% 12.5%
South Carolina Loan Participation Program Loan Participation Private Agency $17,941,071 $17,941,071 $0 $9,231,812 100.0% 161 $168,632,247 9.40 x 571 2,011 10 8 21.7% 19.9% 14.3% 14.2%
Total $18,071,787 $18,071,787 $0 $9,231,812 100.0% 205 $175,349,359 9.70 x 653 2,697 10 8 22.4% 20.1% 13.7% 14.1%
South Dakota
South Dakota Works Loan Program Loan Participation Public Agency $13,227,911 $7,988,045 $199,153 $0 60.4% 17 $65,679,557 8.22 x 401 311 45 9 47.1% 59.7% 17.6% 14.4%
Total $13,227,911 $7,988,045 $199,153 $0 61.9% 17 $65,679,557 8.02 x 401 311 45 9 47.1% 59.7% 17.6% 14.4%
Tennessee
INCITE Fund Venture Capital Co-Investment Model $29,806,278 $28,684,688 $1,044,019 $0 96.2% 89 $159,683,309 5.57 x 399 1,154 7 3 41.6% 35.1% 12.4% 11.9%
Total $29,806,278 $28,684,688 $1,044,019 $0 99.7% 89 $159,683,309 5.37 x 399 1,154 7 3 41.6% 35.1% 12.4% 11.9%
Texas
CDFIs for Texas-Loan Participation Programs Loan Participation Public Agency $2,600,000 $146,000
$1,455,210
$0 5.6% 6 $292,000 2.00 x 10 2 0 0 66.7% 86.6% 50.0% 27.4%
Jobs for Texas-Venture Capital Venture Capital Fund $44,164,445 $39,821,411 $1,699,156 90.2% 51 $552,755,525 13.88 x 695 779 7 6 19.6% 26.7% 2.0% 1.3%
Total $46,764,445 $39,967,411 $1,455,210 $1,699,156 88.6% 57 $553,047,525 13.35 x 705 781 6 4 24.6% 26.8% 7.0% 1.4%
U.S. Virgin Islands
Collateral Support Collateral Support Public Agency $1,770,387 $1,194,825 $0 67.5% 20 $3,257,390 2.73 x 56 128 5 1.5 15.0% 4.9% 100.0% 100.0%
Loan Guarantees Loan Guarantee Public Agency $10,985,112 $5,555,872 $283,757 $0 50.6% 16 $15,487,000 2.79 x 10⁵ 217 11.5 4 12.5% 5.3% 100.0% 100.0%
Payment, Surety, and Performance Bonding Program Loan Guarantee Public Agency $472,413 $0 $0 0.0% 0 $0 N/A 0 0 N/A N/A N/A N/A N/A N/A
Total $13,227,911 $6,750,697 $283,757 $0 53.2% 36 $18,744,390 2.66 x 161 345 7 2 13.9% 5.3% 100.0% 100.0%
Utah
Utah Small Business Loan Guarantee Program Loan Guarantee Private Agency $3,953,182 $2,151,382 $1,298,657 54.4% 28 $31,730,340 14.75 x 271 1,500 14.5 7 39.3% 20.1% 14.3% 0.6%
Utah Small Business Loan Participation Program Loan Participation Private Agency $6,466,865 $5,171,927 $464,531 $0 80.0% 6 $21,250,000 4.11 x 90 91 15 8.5 50.0% 18.1% 0.0% 0.0%
Equity Investment Program Venture Capital Fund $1,394,989 $950,001 $0 68.1% 4 $8,737,570 9.20 x 11 12 16.5 2 25.0% 57.3% 0.0% 0.0%
Total $11,815,036 $8,273,310 $464,531 $1,298,657 74.0% 38 $61,717,910 7.06 x 371 1,603 15 7 39.5% 24.7% 10.5% 0.3%
Vermont
Commercial Participation Program Loan Participation Quasi-Public Agency $8,078,008 $7,848,615
$0
$4,399,583 97.2% 70 $125,136,946 15.94 x 1,191 201 17.5 16 14.3% 41.0% 61.4% 53.7%
Small Business Participation Program Loan Participation Quasi-Public Agency $5,149,903 $5,149,903 $0 100.0% 104 $52,089,880 10.11 x 550 12 4 8.5 13.5% 11.5% 70.2% 66.2%
Total $13,227,911 $12,998,518 $0 $4,399,583 98.3% 174 $177,226,826 13.63 x 1,741 213 8 10 13.8% 32.3% 66.7% 57.4%
(contiruned)

APPENDIX B
60
SSBCI: Summary of States’ 2016 Annual Reports
Approved State Program Program Type
Type of Administering
Entity
a
or VCP Strategy
b
Allocation
SSBCI Funds
Expended for Loans
or Investments
SSBCI Funds Expended
for Program
Administration
c
Recycled
Funds
Expended
Percent of
SSBCI Funds
Expended
d
# of
Transactions
Total Financing
Leveraged
Leverage
Ratio
e
Estimated # of Jobs
Median Size
of Business
Supported (FTEs)
Median Age
of Business
Supported (Years)
Percent of Transactions
to be
Created
to be
Retained
in LMI Areas
(by #)
in LMI Areas
(by $)
in Non-Metro
Areas (by #)
in Non-Metro
Areas (by $)
Virginia
Virginia Capital Access Program CAP Public Agency $400,000 $285,279 $0 $0 71.3% 134 $9,486,435 33.25 x 1,419 1,133 4 5 39.6% 39.0% 35.8% 24.2%
Cash Collateral Program Collateral Support Public Agency $14,134,394 $13,313,871 $4,685,111 94.2% 126 $59,494,228 4.47 x 817 1,098 5 6 34.9% 24.3% 19.0% 12.6%
Economic Development Loan Fund Loan Participation Public Agency $500,000 $500,000 $476,998 $0 100.0% 1 $3,000,000 6.00 x 10 65 65 5 100.0% 100.0% 0.0% 0.0%
Center for Innovative Technology (CIT) GAP Fund Venture Capital SSE $3,000,000 $2,877,532 $0 95.9% 31 $43,026,553 14.95 x 718 235 6 2 6.5% 4.9% 0.0% 0.0%
Total $18,034,394 $16,976,682 $476,998 $4,685,111 96.8% 292 $115,007,216 6.59 x 2,964 2,531 5 5 34.2% 20.2% 24.7% 8.5%
Washington
Capital Access Program CAP Public Agency $91,772 $47,750 $44,022 $0 52.0% 4 $945,034 19.79 x 20 15 14.5 4.5 25.0% 21.2% 0.0% 0.0%
Collateral Support Program Collateral Support Public Agency $5,497,434 $2,721,389 $0 49.5% 10 $20,520,115 7.54 x 72 215 26.25 11 50.0% 42.6% 20.0% 16.2%
Craft3 Fund Loan Participation Private Agency $9,222,515 $9,222,515 $488,207 $1,455,000 100.0% 50 $106,226,763 11.52 x 691 942 18 12.5 56.0% 85.0% 20.0% 38.6%
W Fund Venture Capital Fund $5,000,000 $5,000,000 $0 100.0% 24 $51,138,479 10.23 x 71 59 3 1 8.3% 3.6% 0.0% 0.0%
Total $19,811,721 $16,991,654 $532,229 $1,455,000 88.5% 88 $178,830,391 10.20 x 854 1,231 12.5 6 40.9% 56.5% 13.6% 24.8%
West Virginia
West Virginia Collateral Support Program Collateral Support Quasi-Public Agency $818,823 $788,600
$350,019
$0 96.3% 5 $5,059,800 6.42 x 29 99 14 16 40.0% 39.1% 80.0% 98.9%
West Virginia Loan Guarantee Program Loan Guarantee Quasi-Public Agency $70,388 $58,000 $0 82.4% 2 $320,000 5.52 x 14 25 11.5 5.5 50.0% 56.3% 50.0% 43.8%
Subordinated Debt Program Loan Participation Quasi-Public Agency $5,388,998 $4,960,000 $180,000 92.0% 21 $41,581,044 8.38 x 386 149 9 1 23.8% 7.3% 47.6% 57.7%
Seed Capital Co-investment Fund Venture Capital SSE $6,949,702 $6,467,500 $130,059 93.1% 39 $55,569,971 8.59 x 347 273 3 4 41.0% 84.5% 17.9% 7.9%
Total $13,227,911 $12,274,100 $350,019 $310,059 95.4% 67 $102,530,815 8.12 x 776 545 4 4 35.8% 50.9% 32.8% 32.7%
Wisconsin
WHEDA Guarantee Loan Guarantee Quasi-Public Agency $1,363,554 $0
$573,761
$0 0.0% 0 $0 N/A 0 0 N/A N/A N/A N/A N/A N/A
Wisconsin Equity Fund Venture Capital SSE; Fund $21,000,000 $13,174,691 $0 62.7% 77 $151,849,967 11.53 x 1,056 573 8 4 28.6% 38.1% 7.8% 5.7%
Total $22,363,554 $13,174,691 $573,761 $0 61.5% 77 $151,849,967 11.04 x 1,056 573 8 4 28.6% 38.1% 7.8% 5.7%
Wyoming—Laramie
Credit Guarantee Program Collateral Support Private Agency $12,606,719 $11,843,688
$481,962
$1,010,955 93.9% 71 $57,844,710 4.88 x 363 353 2 1 19.7% 13.3% 71.8% 43.4%
Seed Capital Network Program
Venture Capital Fund $561,631 $451,831 $0 80.4% 11 $903,662 2.00 x 3 0 0 3 0.0% 0.0% 0.0% 0.0%
Total $13,168,350 $12,295,519 $481,962 $1,010,955 97.0% 82 $58,748,371 4.60 x 366 353 2 2 17.1% 13.1% 62.2% 42.8%
Total $1,460,130,382 $1,159,318,196 $35,381,617 $204,998,540 81.8% 21,963 $10,687,673,733 *8.95 x 79,193 161,476 3 5 42.9% 34.5% 10.9% 14.3%
* The SSBCI overall leverage ratio includes SSBCI funds expended for program administration

SSBCI: Summary of States’ 2016 Annual Reports
61
APPENDIX C
Appendix C: Top 50 SSBCI Lenders by Dollar
Amount Loaned and by Number of Loans
Top 50 SSBCI Lenders by Dollar Amount Loaned
(Cumulative through 2016)
Rank Lender Name States Number of Loans Amount Loaned
Average Amount
Loaned
1 Fifth Third Bank FL; IL; KY; MI;OH 117 $127,565,785 $1,090,306
2 Pacic Enterprise Bank CA 296 $124,283,158 $419,876
3 Yadkin Bank NC 129 $102,541,583 $794,896
4 Huntington National Bank IN; KY; MI; OH 347 $93,499,247 $269,450
5 Pacic Premier Bank CA 282 $58,295,579 $206,722
6 Zions First National Bank ID; UT 78 $55,860,398 $716,159
7 Wells Fargo Bank, National Association CA; KS; NM; SD; VA 18 $55,606,185 $3,089,233
8 ServisFirst Bank AL 53 $54,437,666 $1,027,126
9 NewBridge Bank NC 81 $52,198,617 $644,427
10 Columbia State Bank (dba West Coast Bank and Bank of Astoria) OR 72 $49,908,347 $693,171
11 Bank of Guam CA; GU; MP 82 $44,906,167 $547,636
12 Washington Trust Bank CO; ID 53 $44,273,735 $835,353
13 TD Bank, National Association DE; NH; NJ; VT 15 $38,446,568 $2,563,105
14 Bridge Bank, National Association CA 18 $37,685,600 $2,093,644
15 The Biltmore Bank of Arizona AZ 16 $35,658,706 $2,228,669
16 South State Bank GA; SC 60 $35,021,642 $583,694
17 Manufacturers and Traders Trust Company DE; MD; NJ; VA 12 $33,261,000 $2,771,750
18 City National Bank CA 23 $30,863,000 $1,341,870
19 Amarillo National Bank KS 3 $30,685,569 $10,228,523
20 D.L. Evans Bank ID; UT 31 $30,038,373 $968,980
21 Plaza Bank CA 72 $29,466,025 $409,250
22 AmericanWest Bank CA; UT 19 $28,104,740 $1,479,197
23 ANB Bank (formerly Capital West Bank) CO; WY-L 13 $28,064,129 $2,158,779
24 Celtic Bank Corporation CA 16 $27,750,000 $1,734,375
25 Torrey Pines Bank dba Western Alliance Bank CA 58 $27,671,672 $477,098
26 mBank MI 8 $27,576,237 $3,447,030
27 Village Bank and Trust IL 21 $27,251,165 $1,297,675
28 First Community Bank SC 29 $27,147,570 $936,123
29 North State Bank NC 41 $26,638,439 $649,718
30 Palmetto Bank SC 56 $26,631,685 $475,566
31 First Northern Bank of Dixon CA 28 $24,451,070 $873,253
32 Citizens Business Bank (formerly American Security Bank) CA 61 $23,623,581 $387,272
33 Reunion Bank of Florida FL; IL; KY; MI;OH 9 $23,439,000 $2,604,333
34 NBT Bank, National Association NH; VT 5 $23,168,720 $4,633,744
35 California Credit Union CA 26 $22,630,402 $870,400
36 The PrivateBank and Trust Company MI 2 $22,500,000 $11,250,000

SSBCI: Summary of States’ 2016 Annual Reports
62
APPENDIX C
Rank Lender Name States Number of Loans Amount Loaned
Average Amount
Loaned
37
Glacier Bank (dba Citizens Community Bank, 1st Bank,
and Mountain West Bank) ID; MT; WA; WY-L 48 $21,899,020 $456,230
38 Southern States Bank AL 45 $21,636,322 $480,807
39 Citizens Bank NI 4 $21,293,000 $5,323,250
40 Access National Bank VA 27 $20,800,800 $770,400
41 First Citizens Bank and Trust Company, Inc. SC 23 $20,262,973 $880,999
42 FirstMerit Bank, National Association IL; MI; OH 31 $19,287,727 $622,185
43 Centennial Bank FL 2 $19,229,650 $9,614,825
44 Ameris Bank FL; GA; SC 16 $19,116,100 $1,194,756
45 Bell State Bank & Trust ND-M 2 $19,050,000 $9,525,000
46 121 Financial Credit Union FL 12 $18,616,814 $1,551,401
47 Macon Bank, Inc. or Entegra Bank NC; SC 35 $17,923,172 $512,091
48 Valley Business Bank CA 30 $17,537,028 $584,568
49 Peoples National Bank, N.A. IL 5 $17,450,400 $3,490,080
50 Bank of Cascades ID;OR 13 $17,017,849 $1,309,065
Note: This chart does not include private lenders that are contractors for the state.
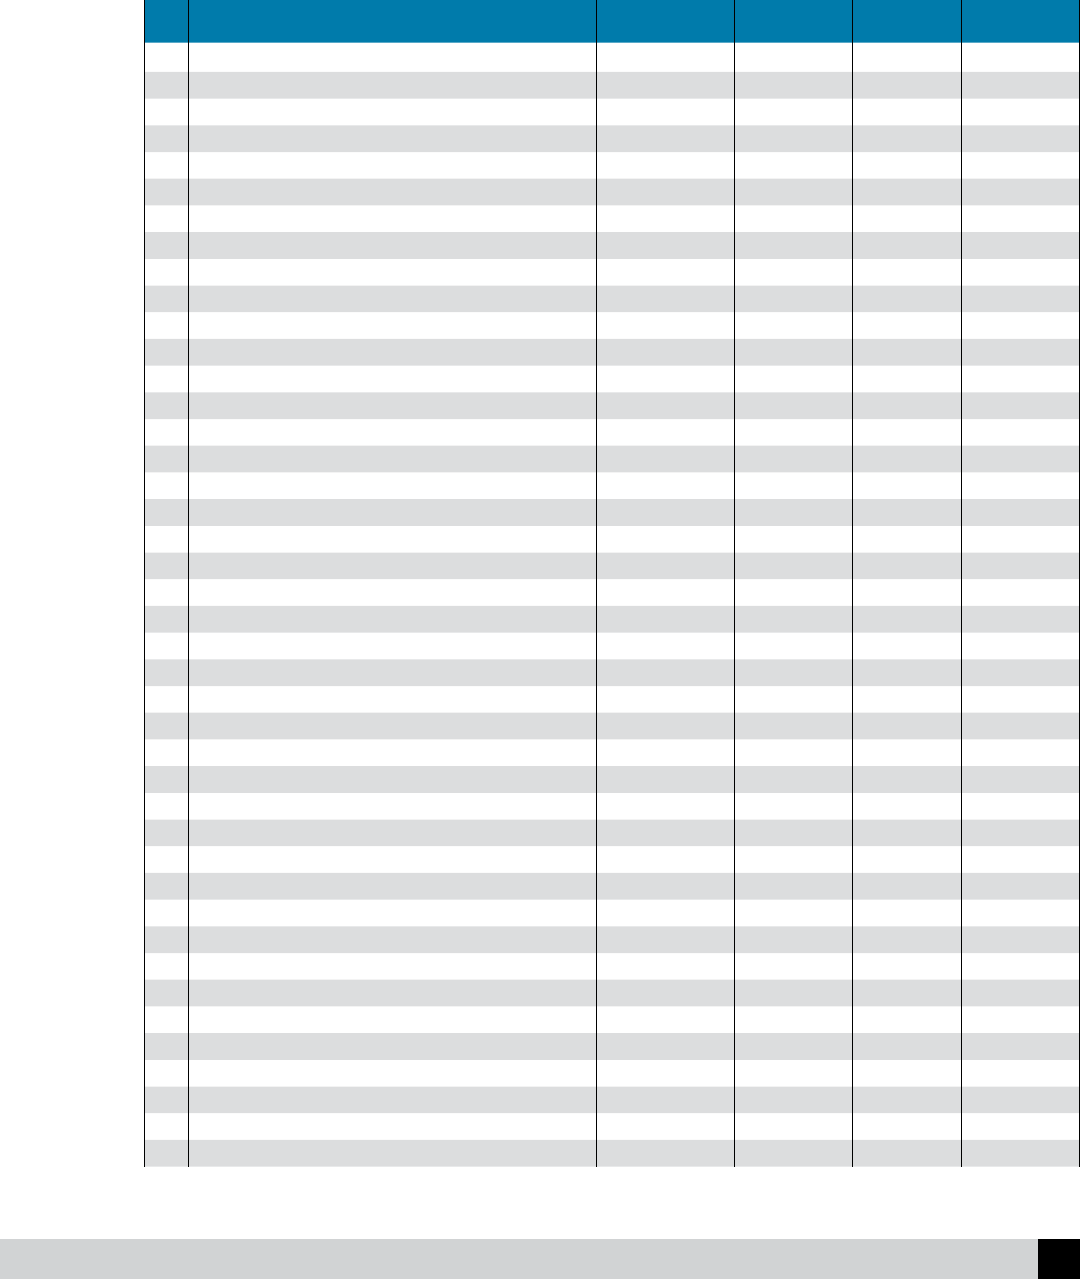
SSBCI: Summary of States’ 2016 Annual Reports
63
APPENDIX C
Top 50 SSBCI Lenders by Number of Loans
(Cumulative through 2016)
Rank Lender Name States Number of Loans Amount Loaned
Average Amount
Loaned
1 Murphy Bank CA 631 $16,254,199 $25,759
2 Huntington National Bank IN; KY; MI; OH 347 $93,499,247 $269,450
3 Pacic Enterprise Bank CA 296 $124,283,158 $419,876
4 Pacic Premier Bank CA 282 $58,295,579 $206,722
5 Chemical Bank MI 177 $10,534,846 $59,519
6 Yadkin Bank NC 129 $102,541,583 $794,896
7 Mutual Bank MA 120 $3,956,821 $32,974
8 Fifth Third Bank FL; IL; KY; MI;OH 117 $127,565,785 $1,090,306
9 Commercial Bank MI 109 $7,930,427 $72,756
10 Branch Banking and Trust Company FL; NC; NJ; VA 103 $10,950,085 $106,312
11 Independent Bank MI 95 $6,065,741 $63,850
12 Bank of Guam CA; GU; MP 82 $44,906,167 $547,636
13 NewBridge Bank NC 81 $52,198,617 $644,427
14 Cape Cod Five MA 81 $3,189,197 $39,373
15 Zions First National Bank ID; UT 78 $55,860,398 $716,159
16 Columbia State Bank (dba West Coast Bank and Bank of Astoria) OR 72 $49,908,347 $693,171
17 Plaza Bank CA 72 $29,466,025 $409,250
18 Hillsdale County National Bank MI 72 $4,108,489 $57,062
19 First-Citizens Bank & Trust Company NC; VA 69 $3,669,570 $53,182
20 Isabella Bank MI 67 $4,106,483 $61,291
21 Enterprise Bank and Trust Company MA; NH 65 $3,913,511 $60,208
22 Community First Bank of Indiana IN; KY; MI; OH 64 $4,104,898 $64,139
23 Lake-Osceola State Bank MI 64 $3,422,193 $53,472
24 Seamens Bank MA 62 $2,091,128 $33,728
25 Citizens Business Bank (formerly American Security Bank) CA 61 $23,623,581 $387,272
26 South State Bank GA; SC 60 $35,021,642 $583,694
27 Torrey Pines Bank dba Western Alliance Bank CA 58 $27,671,672 $477,098
28 Mutual Federal Savings MA 57 $2,003,700 $35,153
29 Palmetto Bank SC 56 $26,631,685 $475,566
30 Select Bank & Trust Company NC 56 $9,224,509 $164,723
31 ServisFirst Bank AL 53 $54,437,666 $1,027,126
32 Washington Trust Bank CO; ID 53 $44,273,735 $835,353
33 Community Guaranty Savings Bank NH 53 $1,294,334 $24,421
34 Florence Savings Bank MA 49 $1,599,350 $32,640
35 Glacier Bank (dba Citizens Community Bank, 1st Bank, and Mountain West Bank) ID; MT; WA; WY-L 48 $21,899,020 $456,230
36 Wilmington Savings Fund Society, FSB DE 48 $12,355,111 $257,398
37 Citizens Savings Bank OH 48 $6,942,789 $144,641
38 First Colebrook Bank NH 47 $5,043,461 $107,308
39 Pacic Continental Bank OR 46 $5,564,758 $120,973
40 Southern States Bank AL 45 $21,636,322 $480,807
41 EVB VA 44 $6,119,571 $139,081
42 North State Bank NC 41 $26,638,439 $649,718
SSBCI: Summary of States’ 2016 Annual Reports
64
APPENDIX C
Rank Lender Name States Number of Loans Amount Loaned
Average Amount
Loaned
43 Sunwest Bank CA; ID 40 $10,972,650 $274,316
44 Rockland Trust MA 39 $1,338,096 $34,310
45 CornerStone Bank, National Association VA 38 $2,868,346 $75,483
46 Westeld Bank MA 37 $288,552 $7,799
47 Macon Bank, Inc. or Entegra Bank NC; SC 36 $18,423,172 $511,755
48 Peoples Bank of Alabama AL 36 $15,537,340 $431,593
49 The Village Bank MA 35 $17,923,172 $512,091
50 DeMotte State Bank IN 33 $2,061,500 $62,470
Note: This chart does not include private lenders that are contractors for the state.

SSBCI: Summary of States’ 2016 Annual Reports
65
APPENDIX D
Appendix D: Top 25 SSBCI CDFIs by Amount
Loaned and by Number of Loans
Top 25 SSBCI CDFI Lenders by Dollar Amount Loaned
(Cumulative through 2016)
Rank Lender Name States Number of Loans Amount Loaned
Average Amount
Loaned
1 Craft3 WA 52 $109,556,763 $2,106,861
2 Opportunity Fund Northern California CA 6,302 $85,790,915 $13,613
3 Southwest Georgia United Empowerment Zone, Inc. (SWGAU) GA 8 $37,229,700 $4,653,713
4 Access to Capital for Entrepreneurs (ACE) GA 20 $33,004,716 $1,650,236
5 Great Falls Development Authority, Inc. MT 2 $31,442,078 $15,721,039
6 Northland Foundation MN 41 $26,290,732 $641,237
7 Albany Community Together, Inc. (ACT!) GA 18 $25,842,375 $1,435,688
8 Benecial State Bank CA; OR 32 $23,575,231 $736,726
9 Metropolitan Consortium of Community Developers MN 110 $23,288,072 $211,710
10 Small Business Assistance Corporation GA 22 $22,789,582 $1,035,890
11 Clearinghouse Community Development Financial Institution AZ; CA 5 $20,695,000 $4,139,000
12 United Bank AL 178 $20,536,292 $115,372
13 Philadelphia Industrial Development Corporation PA 3 $20,208,625 $6,736,208
14 The Progress Fund PA 34 $17,591,310 $517,391
15 Community First Fund PA 15 $17,014,506 $1,134,300
16 Renaissance Economic Development Corporation NY 472 $15,385,195 $32,596
17 ACCION San Diego CA 670 $15,064,758 $22,485
18 Natural Capital Investment Fund, Inc. NC; WV 21 $14,425,293 $686,919
19 BankPlus MS 18 $13,455,408 $747,523
20 Community Bank of the Bay CA 20 $13,331,955 $666,598
21 PriorityOne Bank MS 17 $11,824,950 $695,585
22 Metropolitan Economic Development Association MN 17 $10,130,750 $595,926
23 Industrial Bank DC 10 $10,096,000 $1,009,600
24
Mountain Association for Community Economic Development, Inc.
(MACED) KY 20 $9,919,110 $495,956
25 Kentucky Highlands Investment Corporation KY 8 $9,905,000 $1,238,125

SSBCI: Summary of States’ 2016 Annual Reports
66
APPENDIX D
Top 25 Largest SSBCI CDFI Lenders by Number of Loans
(Cumulative through 2016)
Rank Lender Name States Number of Loans Amount Loaned
Average Amount
Loaned
1 Opportunity Fund Northern California CA 6,302 $85,790,915 $13,613
2 ACCION San Diego CA 670 $15,064,758 $22,485
3 Center for Community Development for New Americans, Inc. NY 552 $3,418,000 $6,192
4 Renaissance Economic Development Corporation NY 472 $15,385,195 $32,596
5 TMC Development Working Solutions CA 223 $5,134,512 $23,025
6 ACCION East, Inc. FL; NY 188 $1,511,643 $8,041
7 Fresno Community Development Financial Institution CA 185 $4,434,563 $23,971
8 United Bank AL 178 $20,536,292 $115,372
9 BOC Capital Corp. NY 170 $5,610,512 $33,003
10 Opening Doors, Inc. CA 130 $900,982 $6,931
11 Metropolitan Consortium of Community Developers MN 110 $23,288,072 $211,710
12 FORGE, Inc. AR 107 $1,259,128 $11,768
13 OBDC Small Business Finance CA 102 $2,751,035 $26,971
14
Excelsior Growth Fund, an aliate of NYBDC Local Development
Corporation NY 85 $6,752,400 $79,440
15 The Support Center NC 69 $2,402,157 $34,814
16 Economic and Community Development Institute (ECDI) OH 62 $2,940,029 $47,420
17 Craft3 WA 52 $109,556,763 $2,106,861
18 California Coastal Rural Development Corporation CA 48 $1,927,000 $40,146
19 First State Community Loan Fund DE 43 $2,630,612 $61,177
20 Community Capital New York, Inc NY 42 $1,646,383 $39,200
21 Economic Opportunities Fund PA 41 $372,450 $9,084
22 Northland Foundation MN 41 $26,290,732 $641,237
23 Community Financial Resource Center CA 41 $88,900 $2,168
24 Pan American Bank CA 38 $5,062,495 $133,224
25 ACCION New Mexico AZ; CO 35 $2,970,113 $84,860

SSBCI: Summary of States’ 2016 Annual Reports
67
APPENDIX E
Appendix E: SSBCI Program Types
Capital Access Programs
SSBCI Metrics for Capital Access Programs All States Except California California All States
Key Data
Number of CAP Programs 20 1 21
SSBCI Allocation ($ millions) $20 $20 $40
SSBCI Allocation (% of Total Allocation) 1.4% 1.3% 2.7%
Transactions (#) 5,057 8,908 13,965
SSBCI Original Funds Expended ($ millions) $11 $17 $28
SSBCI Program Funds Expended ($ millions) $9 $15 $24
SSBCI Administrative Funds Expended ($ millions) $2 $2 $4
SSBCI Recycled Funds Expended ($) $150,782 $275,147 $425,929
Average Loan Size ($) $47,900 $36,900 $40,900
Average New Financing ($) $59,900 $37,900 $45,900
Program Outputs
Percent Expended 54% 89% 71%
Leverage Ratio* 27.53 x 19.39 x 22.54 x
Program Outcomes
Total Jobs Supported 34,134 45,492 79,626
Jobs Created 9,800 4,753 14,553
Jobs Retained 24,334 40,739 65,073
SSBCI Loans in LMI Communities (% of total number of loans) 40% 52% 48%
Top Three Industries Assisted: Retail Trade Retail Trade Retail Trade
Other Services (except Public Administration) Accommodation and Food Services Accommodation and Food Services
Accommodation and Food Services Transportation and Warehousing Transportation and Warehousing
* Includes Administrative Expenses

SSBCI: Summary of States’ 2016 Annual Reports
68
APPENDIX E
Loan Guarantee Programs
SSBCI Metrics for Loan Guarantee Programs
Key Data:
Number of LGP Programs* 18
SSBCI Allocation ($ millions) $246
SSBCI Allocation (% of Total Allocation) 17%
Transactions (#) 2,779
SSBCI Original Funds Expended ($ millions) $182
SSBCI Program Funds Expended ($ millions) $176
SSBCI Administrative Funds Expended ($ millions)* $6
SSBCI Recycled Funds Expended ($ millions) $69
Average Loan Size ($) $453,000
Average New Financing ($) $502,000
Program Outputs:
Percent Expended 74%
Leverage Ratio** 7.66 x
Program Outcomes:
Total Jobs Supported 61,240
Jobs Created 16,793
Jobs Retained 44,447
SSBCI Loans in LMI Communities (% of total number of loans) 35%
Top Three Industries Assisted: Manufacturing
Construction
Retail Trade
* Administrative expenses are weighted estimates prorated by proportion of program
transactions to total other credit support transactions
** Includes weighted administrative expenses
Collateral Support
SSBCI Metrics for Collateral Support Programs
Key Data:
Number of CSP Programs* 17
SSBCI Allocation ($ millions) $269
SSBCI Allocation (% of Total Allocation) 18%
Transactions (#) 1,530
SSBCI Original Funds Expended ($ millions) $238
SSBCI Program Funds Expended ($ millions) $232
SSBCI Administrative Funds Expended ($ millions)* $6
SSBCI Recycled Funds Expended ($ millions) $44
Average Loan Size ($) $730,000
Average New Financing ($) $866,000
Program Outputs:
Percent Expended 89%
Leverage Ratio** 5.57 x
Program Outcomes:
Total Jobs Supported 26,164
Jobs Created 12,105
Jobs Retained 14,059
SSBCI Loans in LMI Communities (% of total number of loans) 32%
Top Three Industries Assisted: Manufacturing
Accommodation
and Food Services
Retail Trade
* Administrative expenses are weighted estimates prorated by proportion of program
transactions to total other credit support transactions
** Includes weighted administrative expenses

SSBCI: Summary of States’ 2016 Annual Reports
69
APPENDIX E
Loan Participation Programs
SSBCI Metrics for Loan Participation Programs
Key Data:
Number of LPP Programs* 37
SSBCI Allocation ($ millions) $474
SSBCI Allocation (% of Total Allocation) 32%
Transactions (#) 2,065
SSBCI Original Funds Expended ($ millions) $419
SSBCI Program Funds Expended ($ millions) $408
SSBCI Administrative Funds Expended ($ millions)* $11
SSBCI Recycled Funds Expended ($ millions) $89
Average Loan Size ($ millions) $1.2
Average New Financing ($ millions) $1.5
Program Outputs:
Percent Expended 88%
Leverage Ratio** 7.53 x
Program Outcomes:
Total Jobs Supported 49,381
Jobs Created 22,173
Jobs Retained 27,208
SSBCI Loans in LMI Communities (% of total number of loans) 33%
Top Three Industries Assisted: Manufacturing
Accommodation and
Food Services
Health Care and
Social Assistance
* Administrative expenses are weighted estimates prorated by proportion of program
transactions to total other credit support transactions
** Includes weighted administrative expenses
Venture Capital Programs
SSBCI Metrics for Venture Capital Programs
Key Data:
Number of VC Programs 41
SSBCI Allocation ($ millions) $431
SSBCI Allocation (% of Total Allocation) 30%
Transactions (#) 1,623
SSBCI Original Funds Expended ($ millions) $327
SSBCI Program Funds Expended ($ millions) $319
SSBCI Administrative Funds Expended ($ millions)* $7
SSBCI Recycled Funds Expended ($ millions) $3
Average Loan Size ($ millions) $1.3
Average New Financing ($ millions) $2.6
Program Outputs:
Percent Expended 76%
Leverage Ratio** 12.76 x
Program Outcomes:
Total Jobs Supported 24,258
Jobs Created 13,569
Jobs Retained 10,689
SSBCI Investments in LMI Communities
(% of total number of investments) 36%
Top Three Industries Assisted:
Professional, Scientic,
and Technical Services
Information
Manufacturing
* Administrative expenses are weighted estimates prorated by proportion of program
transactions to total other credit support transactions
** Includes weighted administrative expenses

SSBCI: Summary of States’ 2016 Annual Reports
70
Acknowledgements
Since 2010, the U.S. Treasury has supported the State Small Business Credit Initiative in partnership
with state agencies and their contractors. The program beneted from the work of many talented and
dedicated individuals.
We wish to thank the following people for their contributions to SSBCI and this report.
Treasury and Former Treasury Team
Cyrus Amir-Mokri
Peter Bieger
Tam Carlock
Danielle Christensen
James Clark
Linda Clark
Tim Colon
Drew Colbert
Dan Cruz
Steve Davidson
Dan Dorman
Amias Gerety
Don Graves
Jodie Harris
Cli Kellogg
Maureen Klovers
Kipp Kranbuhl
Jamie Lipsey
Phyllis Love
Jessica Milano
Mary Miller
Opal Moore
Ruthanne Murray
Richard Oettinger
Karin Peabody
Sarah Reed
Katie Reilly
David Rixter
Roberto Rodriguez
Jared Sawyer
Zakaria Shaikh
Mark Stevens
Anita Washington
Technical Support
John Alex
Abou Bakayoko
Brendan Bu
Diane Casey-Landry
David Cervantes
Eric Cromwell
Dennis Downer
Sarah Gutschow
Ron Kelly
David McGrady
Donna Nails
Brandon Poole
Ken Poole
Christina Prevalsky
Marty Romitti
Dan Schmisseur
George Surgeon
Somaree Taru
Kay Williams
Terry Valladares
Jerey Stout
Director, State Small Business Credit Initiative

