
GE Healthcare
Physician’s Guide
to GE Stress Systems
2051167-002 ENG Revision C

2 Physician’s Guide Revision C
2051167-002 2014-01-07
CASE and MAC are trademarks owned by GE Medical Systems
Information Technologies GmbH, a General Electric Company going to
market as GE Healthcare.
All other trademarks contained herein are the property of their
respective owners.
Revision History
This manual is subject to the GE Medical Systems Information
Technologies change order service.
The revision code, a letter that follows the document part number,
changes with every manual update.
The initial version of the manual has the letter A.
© Copyright 2001–2013 General Electric Company. All rights reserved.
Part No. Revision Code Date Comment
2009352-001 Rev A 2001-12 Initial Release
2009352-001 Rev B 2003-08 ECO 073369
2009352-001 Rev C 2005-06 ECO 080698
2009352-001 Rev D 2010-02 Replaced by 2051167-002 Rev A
2051167-002 Rev A 2010-02 New: Exercise Test
Interpretation, Audio
Assessment, four new exercise
measurements.
Updated: Interpreting/Correcting
TWA.
2051167-002 Rev B 2012-01 New: Exercise induced
arrhythmias.
Exercise Test Interpretation:
Statement texts are more
moderate and more descriptive.
Audio Assessment: Channels
exchanged
2051167-002 Rev C 2014-01 New: Exercise devices in
exercise test interpretation (XTI).
Graphical XTI output

Revision C Physician’s Guide 3
2051167-002
Contents
1 Introduction . . . . . . . . . . . . . . . . . . . . . . . . . . . . . . . . . . . . . . . . 7
Computerized Stress ECG Analysis and Interpretation . . . . . . . . . . . . . . . . . . . . . . . . . 7
2 Acquisition of the ECG Signal . . . . . . . . . . . . . . . . . . . . . . . . . 9
ECG Signal Acquisition with GE Stress Systems . . . . . . . . . . . . . . . . . . . . . . . . . . . . . . 9
Characteristics of the ECG Signal . . . . . . . . . . . . . . . . . . . . . . . . . . . . . . . . . . . . . . . . . . 11
Digitization of the ECG Signal . . . . . . . . . . . . . . . . . . . . . . . . . . . . . . . . . . . . . . . . . . . . . 13
Environmental Noise Elimination . . . . . . . . . . . . . . . . . . . . . . . . . . . . . . . . . . . . . . . . . . 14
3 Conditioning the ECG Signal . . . . . . . . . . . . . . . . . . . . . . . . 15
The Importance of Noise-Free ECGs . . . . . . . . . . . . . . . . . . . . . . . . . . . . . . . . . . . . . . . 15
Filtering . . . . . . . . . . . . . . . . . . . . . . . . . . . . . . . . . . . . . . . . . . . . . . . . . . . . . . . . . . . . . . . 16
Noise Filters . . . . . . . . . . . . . . . . . . . . . . . . . . . . . . . . . . . . . . . . . . . . . . . . . . . . . . . 16
Baseline Roll Filters . . . . . . . . . . . . . . . . . . . . . . . . . . . . . . . . . . . . . . . . . . . . . . . . . 17
50/60-Hz Line Filters . . . . . . . . . . . . . . . . . . . . . . . . . . . . . . . . . . . . . . . . . . . . . . . . . 17
Cubic Spline Baseline Correction . . . . . . . . . . . . . . . . . . . . . . . . . . . . . . . . . . . . . . . . . . 18
FRF (Finite impulse response Residual Filtering) Algorithm . . . . . . . . . . . . . . . . . . . . 19
4 Signal Processing . . . . . . . . . . . . . . . . . . . . . . . . . . . . . . . . . 21
Mathematical Algorithms . . . . . . . . . . . . . . . . . . . . . . . . . . . . . . . . . . . . . . . . . . . . . . . . . 21
Intelligent Lead Switch Algorithm . . . . . . . . . . . . . . . . . . . . . . . . . . . . . . . . . . . . . . . . . . 22
Detection of Cyclic Artifact Algorithm . . . . . . . . . . . . . . . . . . . . . . . . . . . . . . . . . . . . . . 23
QRS Detection . . . . . . . . . . . . . . . . . . . . . . . . . . . . . . . . . . . . . . . . . . . . . . . . . . . . . . . . . . 24
Correlation and Alignment . . . . . . . . . . . . . . . . . . . . . . . . . . . . . . . . . . . . . . . . . . . . . . . . 25
Incremental Updating . . . . . . . . . . . . . . . . . . . . . . . . . . . . . . . . . . . . . . . . . . . . . . . . . . . . 26
Relearn . . . . . . . . . . . . . . . . . . . . . . . . . . . . . . . . . . . . . . . . . . . . . . . . . . . . . . . . . . . . . . . . 26
Pace Enhance . . . . . . . . . . . . . . . . . . . . . . . . . . . . . . . . . . . . . . . . . . . . . . . . . . . . . . . . . . 27

4 Physician’s Guide Revision C
2051167-002
5 Measurement Values . . . . . . . . . . . . . . . . . . . . . . . . . . . . . . . 29
Heart Rate . . . . . . . . . . . . . . . . . . . . . . . . . . . . . . . . . . . . . . . . . . . . . . . . . . . . . . . . . . . . . 29
ST Segment Values . . . . . . . . . . . . . . . . . . . . . . . . . . . . . . . . . . . . . . . . . . . . . . . . . . . . . . 30
QRS Onset and Offset Detection . . . . . . . . . . . . . . . . . . . . . . . . . . . . . . . . . . . . . . . . . . . 31
ST Level . . . . . . . . . . . . . . . . . . . . . . . . . . . . . . . . . . . . . . . . . . . . . . . . . . . . . . . . . . . . . . . 31
ST Slope . . . . . . . . . . . . . . . . . . . . . . . . . . . . . . . . . . . . . . . . . . . . . . . . . . . . . . . . . . . . . . . 32
ST Integral . . . . . . . . . . . . . . . . . . . . . . . . . . . . . . . . . . . . . . . . . . . . . . . . . . . . . . . . . . . . . 33
ST Index . . . . . . . . . . . . . . . . . . . . . . . . . . . . . . . . . . . . . . . . . . . . . . . . . . . . . . . . . . . . . . . 33
R-Wave Amplitude . . . . . . . . . . . . . . . . . . . . . . . . . . . . . . . . . . . . . . . . . . . . . . . . . . . . . . 33
QRS Width . . . . . . . . . . . . . . . . . . . . . . . . . . . . . . . . . . . . . . . . . . . . . . . . . . . . . . . . . . . . . 33
ST/HR Slope . . . . . . . . . . . . . . . . . . . . . . . . . . . . . . . . . . . . . . . . . . . . . . . . . . . . . . . . . . . 34
ST/HR Index . . . . . . . . . . . . . . . . . . . . . . . . . . . . . . . . . . . . . . . . . . . . . . . . . . . . . . . . . . . . 35
Recovery ST Level . . . . . . . . . . . . . . . . . . . . . . . . . . . . . . . . . . . . . . . . . . . . . . . . . . . . . . 36
ST/HR Hysteresis . . . . . . . . . . . . . . . . . . . . . . . . . . . . . . . . . . . . . . . . . . . . . . . . . . . . . . . 37
Arrhythmia Detection . . . . . . . . . . . . . . . . . . . . . . . . . . . . . . . . . . . . . . . . . . . . . . . . . . . . 39
Arrhythmia Detection Performance . . . . . . . . . . . . . . . . . . . . . . . . . . . . . . . . . . . . . . . . 42
Exercise-Induced Wide QRS Tachycardia . . . . . . . . . . . . . . . . . . . . . . . . . . . . . . . . . . . 43
Exercise-Induced Supraventricular Tachycardia . . . . . . . . . . . . . . . . . . . . . . . . . . . . . . 44
Duke Treadmill Score . . . . . . . . . . . . . . . . . . . . . . . . . . . . . . . . . . . . . . . . . . . . . . . . . . . . 45
METS . . . . . . . . . . . . . . . . . . . . . . . . . . . . . . . . . . . . . . . . . . . . . . . . . . . . . . . . . . . . . . . . . 46
Actual Load . . . . . . . . . . . . . . . . . . . . . . . . . . . . . . . . . . . . . . . . . . . . . . . . . . . . . . . . . . . . 48
HR Recovery . . . . . . . . . . . . . . . . . . . . . . . . . . . . . . . . . . . . . . . . . . . . . . . . . . . . . . . . . . . 49
FVE Recovery . . . . . . . . . . . . . . . . . . . . . . . . . . . . . . . . . . . . . . . . . . . . . . . . . . . . . . . . . . 50
Chronotropic Response . . . . . . . . . . . . . . . . . . . . . . . . . . . . . . . . . . . . . . . . . . . . . . . . . . 51
Blood Pressure . . . . . . . . . . . . . . . . . . . . . . . . . . . . . . . . . . . . . . . . . . . . . . . . . . . . . . . . . 52
Double Product / Rate Pressure Product (RPP) . . . . . . . . . . . . . . . . . . . . . . . . . . . . . . . 52
Heart Rate Values . . . . . . . . . . . . . . . . . . . . . . . . . . . . . . . . . . . . . . . . . . . . . . . . . . . . . . . 52
Dynamic ST Scan . . . . . . . . . . . . . . . . . . . . . . . . . . . . . . . . . . . . . . . . . . . . . . . . . . . . . . . 52
ST Criteria . . . . . . . . . . . . . . . . . . . . . . . . . . . . . . . . . . . . . . . . . . . . . . . . . . . . . . . . . . . . . 53
PWC Calculation . . . . . . . . . . . . . . . . . . . . . . . . . . . . . . . . . . . . . . . . . . . . . . . . . . . . . . . . 53
Target Load . . . . . . . . . . . . . . . . . . . . . . . . . . . . . . . . . . . . . . . . . . . . . . . . . . . . . . . . . . . . 53
6 T-Wave Alternans (TWA) . . . . . . . . . . . . . . . . . . . . . . . . . . . . 57
Intended Use . . . . . . . . . . . . . . . . . . . . . . . . . . . . . . . . . . . . . . . . . . . . . . . . . . . . . . . . . . . 57
Introduction . . . . . . . . . . . . . . . . . . . . . . . . . . . . . . . . . . . . . . . . . . . . . . . . . . . . . . . . . . . . 58
The TWA Algorithm . . . . . . . . . . . . . . . . . . . . . . . . . . . . . . . . . . . . . . . . . . . . . . . . . . . . . . 60
Cubic Alignment . . . . . . . . . . . . . . . . . . . . . . . . . . . . . . . . . . . . . . . . . . . . . . . . . . . . . . . . 62
TWA Calculation . . . . . . . . . . . . . . . . . . . . . . . . . . . . . . . . . . . . . . . . . . . . . . . . . . . . . . . . 63

Revision C Physician’s Guide 5
2051167-002
Interpreting/Correcting TWA Results . . . . . . . . . . . . . . . . . . . . . . . . . . . . . . . . . . . . . . . 64
TWA Settings . . . . . . . . . . . . . . . . . . . . . . . . . . . . . . . . . . . . . . . . . . . . . . . . . . . . . . . . . . . 66
7 Exercise Test Interpretation (XTI) . . . . . . . . . . . . . . . . . . . . . 67
Description of the Exercise Test Interpretation Program . . . . . . . . . . . . . . . . . . . . . . . 67
Limitations of the Exercise Test Interpretation (XTI) Program . . . . . . . . . . . . . . . . . . . 70
Examples for complete interpretation . . . . . . . . . . . . . . . . . . . . . . . . . . . . . . . . . . . . . . 71
Rules . . . . . . . . . . . . . . . . . . . . . . . . . . . . . . . . . . . . . . . . . . . . . . . . . . . . . . . . . . . . . . . . . 72
Rules for risk assessment . . . . . . . . . . . . . . . . . . . . . . . . . . . . . . . . . . . . . . . . . . . . . 72
Rules for functional response assessment . . . . . . . . . . . . . . . . . . . . . . . . . . . . . . . . 73
Rules for ischemia assessment (coronary artery disease) . . . . . . . . . . . . . . . . . . . . 76
Rules for overall statements . . . . . . . . . . . . . . . . . . . . . . . . . . . . . . . . . . . . . . . . . . . 77
Technical Rules . . . . . . . . . . . . . . . . . . . . . . . . . . . . . . . . . . . . . . . . . . . . . . . . . . . . . 78
Graphical XTI output . . . . . . . . . . . . . . . . . . . . . . . . . . . . . . . . . . . . . . . . . . . . . . . . . . . . . 79
8 Audio Assessment of Exercise Tests . . . . . . . . . . . . . . . . . . 83
Fast Assessment . . . . . . . . . . . . . . . . . . . . . . . . . . . . . . . . . . . . . . . . . . . . . . . . . . . . . . . 83
Examples . . . . . . . . . . . . . . . . . . . . . . . . . . . . . . . . . . . . . . . . . . . . . . . . . . . . . . . . . 84
9 Resting ECG Interpretation and Pre Test Risk
Assessment . . . . . . . . . . . . . . . . . . . . . . . . . . . . . . . . . . . . . . 87
AHA Coronary Heart Disease Risk and Stroke Risk Prediction . . . . . . . . . . . . . . . . . . 87
Coronary Heart Disease Risk Prediction . . . . . . . . . . . . . . . . . . . . . . . . . . . . . . . . . 87
Stroke Risk Prediction . . . . . . . . . . . . . . . . . . . . . . . . . . . . . . . . . . . . . . . . . . . . . . . . 88
Definitions of Terms and Measurements . . . . . . . . . . . . . . . . . . . . . . . . . . . . . . . . . . 89
10 Exercise Testing . . . . . . . . . . . . . . . . . . . . . . . . . . . . . . . . . . . 91
General . . . . . . . . . . . . . . . . . . . . . . . . . . . . . . . . . . . . . . . . . . . . . . . . . . . . . . . . . . . . . . . . 91
Role of Stress Testing in Reducing Cost of Healthcare . . . . . . . . . . . . . . . . . . . . . . . . 92
A Clinical Approach to Exercise Testing . . . . . . . . . . . . . . . . . . . . . . . . . . . . . . . . . . . . 94
Concepts Useful in Interpreting Exercise Tests . . . . . . . . . . . . . . . . . . . . . . . . . . . . . . 95
Percentage of Predicted Maximal Heart Rate (MHR) Achieved . . . . . . . . . . . . . . . . 95
Total Exercise Time . . . . . . . . . . . . . . . . . . . . . . . . . . . . . . . . . . . . . . . . . . . . . . . . . . 95
Total METS . . . . . . . . . . . . . . . . . . . . . . . . . . . . . . . . . . . . . . . . . . . . . . . . . . . . . . . . 95
Functional Aerobic Impairment . . . . . . . . . . . . . . . . . . . . . . . . . . . . . . . . . . . . . . . . . 96
Percent of Predicted O2 Consumption Achieved . . . . . . . . . . . . . . . . . . . . . . . . . . . 96
Symptoms and Signs . . . . . . . . . . . . . . . . . . . . . . . . . . . . . . . . . . . . . . . . . . . . . . . . 98

6 Physician’s Guide Revision C
2051167-002
Electrocardiographic Response to Exercise . . . . . . . . . . . . . . . . . . . . . . . . . . . . . . . 98
Heart Rate and Blood Pressure . . . . . . . . . . . . . . . . . . . . . . . . . . . . . . . . . . . . . . . . 98
Exercise Test Interpretation . . . . . . . . . . . . . . . . . . . . . . . . . . . . . . . . . . . . . . . . . . . . . . 100
The ST Segment Response . . . . . . . . . . . . . . . . . . . . . . . . . . . . . . . . . . . . . . . . . . 100
Problems in the Interpretation of ST Segment Responses to Exercise . . . . . . . . . 101
Sensitivity, Specificity, Predictive Value, and Pretest Likelihood . . . . . . . . . . . . . . . 102
Other Exercise Variables . . . . . . . . . . . . . . . . . . . . . . . . . . . . . . . . . . . . . . . . . . . . 103
Computer Processing of the Exercise ECG . . . . . . . . . . . . . . . . . . . . . . . . . . . . . . . . . 104
11 Reports . . . . . . . . . . . . . . . . . . . . . . . . . . . . . . . . . . . . . . . . . 107
In-Test and Final Reports . . . . . . . . . . . . . . . . . . . . . . . . . . . . . . . . . . . . . . . . . . . . . . . . 107
12 Glossary . . . . . . . . . . . . . . . . . . . . . . . . . . . . . . . . . . . . . . . . 109
Abbreviations and Definitions . . . . . . . . . . . . . . . . . . . . . . . . . . . . . . . . . . . . . . . . . . . . 109
13 Bibliography . . . . . . . . . . . . . . . . . . . . . . . . . . . . . . . . . . . . . 117
Relevant Literature . . . . . . . . . . . . . . . . . . . . . . . . . . . . . . . . . . . . . . . . . . . . . . . . . . . . . 117

Revision C Physician’s Guide 7
2051167-002
1 Introduction
Computerized Stress ECG Analysis and
Interpretation
The first analysis of the ECG signal on a digital computer was performed
by Taback in 1959
3
. At that time he and his group reported the benefits
of this revolutionary technology as: an ability to make more precise
measurements, a reduction in the distortion of the ECG signal, and
accessibility to storage techniques.
Computerization of the stress ECG has evolved greatly since that
original attempt. There are four generally recognized benefits to the
computerization of the ECG signal:
1. The advanced signal-processing techniques make it possible to
present clean electrocardiograph tracings in the presence of severe
artifact and noise.
2. Computer-generated measurements are consistent and eliminate
the well documented interobserver variability.
3. Properly constructed algorithms have the ability to accurately
recognize and remove aberrant beats from the signal processing.
4. The application of computers is making it possible to generate more,
and better, criteria for positive exercise tests, for example, automatic
Exercise Test Interpretation, Duke Treadmill Score, and ST/HR
Criteria.
The Physician’s Guide to GE Stress Systems has been written to provide
the practitioner with a conceptual insight into GE’s innovative methods
of signal processing and exercise test interpretation. Our hope is that it
will enhance the application of computerized exercise
electrocardiography to your practice.
The software that is at the heart of GE stress systems is in its third
decade of continued development. While it encompasses many aspects of
advanced signal processing, data is presented in formats that preserve
continuity with traditional clinical methods.
The functionalities described in this guide are provided by the
GE software package HEART Exercise containing the XTI exercise
test interpretation feature. It is installed in different GE Stress Systems
and has a separate, device-independent 510K FDA approval. The
specifics presented in this guide refer to GE Stress Systems, e.g., CASE,
CardioSoft*, CS*, MAC 1200, and MAC 1600. They describe the
capabilities of GE stress products. Depending on whether the device is a

8 Physician’s Guide Revision C
2051167-002
Introduction: Computerized Stress ECG Analysis and Interpretation
high end or a low end product, or whether options have been purchased
or not, some of the functions described may not be available on your
device. Consult your operator’s manual for details.
Note
Please note that the products CardioSoft and CS may not be
available in some countries.

Revision C Physician’s Guide 9
2051167-002
2 Acquisition of the
ECG Signal
ECG Signal Acquisition with GE Stress Systems
GE stress systems simultaneously acquire all 12 leads of the
conventional ECG. Eight of the leads are acquired directly (I, II, and V1
through V6). The remaining four (III, aVR, aVL, and aVF) are derived
via Einthoven’s law.
Figure 2.1 Frontal plane leads shown with reference to Einthoven’s triangle
Because of the inherent relationship of the standard limb leads to each
other, Einthoven stated that at any given instant during the cardiac
cycle, the sum of the potentials of leads I and III equals the potential of
lead II. (This complies with American Heart Association
recommendations
1
.)
Most report formats show only a portion of a 10-second ECG strip. For
example, the standard 12-lead presentation displays only 2.5 seconds
from each of the four lead groups. Regardless of the data seen on hard
copy reports, GE stress systems simultaneously acquire and process the
complete database of 12 leads for the duration of the complete procedure.
RA LA
LEAD I
LEAD II
LEAD III
LL

10 Physician’s Guide Revision C
2051167-002
Acquisition of the ECG Signal: ECG Signal Acquisition with GE Stress Systems
Note
For those clinicians interested in testing with more or less than the
conventional 12-lead electrocardiogram, GE systems provide the
capability for simultaneous acquisition of 3, 6 or 15 leads. Consult
your operator’s manual for details.
GE systems with color capability indicate the signal quality of the
applied electrodes on-screen, using different colors:
green: the electrode is properly applied
yellow: poor signal quality
red: electrode disconnected, high impedance, or lead break
white: not used
Sometimes pacemaker spikes are not visible in the ECG signal. This can
occur when the spikes have a low amplitude, e.g., less than 2 mV, and a
short duration, e.g., less than 0.1 ms. GE stress systems are able to
detect small pacemaker pulses and provide the possibility to enhance
them, i.e., the user can enable the pace enhance function.

Revision C Physician’s Guide 11
2051167-002
Acquisition of the ECG Signal: Characteristics of the ECG Signal
Characteristics of the ECG Signal
The raw electrocardiograph signal is obtained in analog form. An analog
signal is defined as a continuous signal which varies in amplitude with
time. Figures 2.2 and 2.3 illustrate analog signals.
Figure 2.2 A 2-Hz analog signal
The frequency of an analog signal is defined as the number of complete
cycles that occur per second. The frequency of a signal is labeled in Hertz
(Hz). Figure 2.2 is an example of a low-frequency wave. Notice that it
does not repeat rapidly. The frequency is 2 Hz (2cycles per second).
Figure 2.3 10-Hz analog signal
A higher frequency wave is shown in Figure 2.3. It is compressed and
repeats more often. The frequency is 10 Hz.
Figure 2.4 presents a raw (analog) ECG signal. The typical ECG
representation of the cardiac cycle consists of various waveforms that
vary in frequency. The general frequency characteristics of ECG data
are presented in Table 2.1.
AMPLITUDE
3
2
1
TIME
1.0
.50
0
AMPLITUDE
3
2
1
TIME
1.0
.50
0

12 Physician’s Guide Revision C
2051167-002
Acquisition of the ECG Signal: Characteristics of the ECG Signal
Figure 2.4 The ECG waveform shown as a continuous analog signal with both amplitude
and time components
Table 2.1 General frequency characteristics of an ECG signal
ST Segment — 0.05 Hz to 5 Hz
Baseline Roll — < 1 Hz
P Wave — < 5 Hz
T Wave — < 5 Hz
QRS Complex — 10 to 40 Hz
Muscle Artifact — > 35 Hz
AMPLITUDE
TIME

Revision C Physician’s Guide 13
2051167-002
Acquisition of the ECG Signal: Digitization of the ECG Signal
Digitization of the ECG Signal
Digitizing an analog signal such as the ECG requires periodic sampling
at fixed time intervals.
Figure 2.5 shows the effects of analog-to-digital conversion. Note how
the sampling rate affects the resolution of the signal. In general, the
greater the sampling rate the better the resolution.
Figure 2.5 The effects of different sampling rates on the analog-to-digital conversion of the
ECG signal (Froelicher, V. F., Exercise and the Heart 3
rd
edition
2
)
Incoming analog signals are digitized with GE’s unique patient
acquisition module. Data is acquired at a rate of more than 1,000
samples per second resulting in values every 0.05 mm at standard chart
writer speed. (GE systems comply with and exceed American Heart
Association recommendations.)
100 samples/second
10 samples/second
with phase shift
10 samples/second

14 Physician’s Guide Revision C
2051167-002
Acquisition of the ECG Signal: Environmental Noise Elimination
Environmental Noise Elimination
To acquire cardiac waveforms accurately, we have taken great care to
design our systems to exclude environmental noise. For the purposes of
this publication, we will define environmental noise as that artifact
which originates outside of the system. Several noise-exclusion
mechanisms are employed.
Let us first discuss noise generated by signals external to the patient’s
body; that is, in addition to the small voltages generated by the
myocardium, the ECG equipment receives signals coming from electrical
equipment in the environment. These signals are called common mode
because all of the leads on the body “see” them: they are common to all of
them. A common mode signal can be many times greater than the ECG.
Therefore, it is important to eliminate.
The ability of the electrocardiograph to reject this signal is called
common mode rejection. Due to practical limitations, it is not possible to
entirely eliminate the common mode signal. However, we are able to
greatly reduce it. The amount of reduction is called the common mode
rejection ratio.
With GE’s common mode rejection ratio only 1 part in a million is left.
For example, if the common mode signal is 100 volts, only 100 microvolts
would be left in the ECG recording.
In addition to the high quality rejection circuitry, there is another way to
minimize the deleterious effects of the common mode signal. Imagine we
could perfectly couple the system and patient together; both system and
patient would experience the same common mode signal. In absolute
terms, the common mode signal would still exist, but the acquisition
hardware would not see it in relation to the patient’s body.
GE achieves this by taking the acquisition function out of the system
hardware. Acquisition is performed within the patient cable. Since the
patient acquisition module is small and close to the patient’s body, it can
track the common mode signal of the patient. There is almost no voltage
difference between them. This, in addition to the use of the right leg
electrode, results in almost no common mode signal relative to the
patient acquisition module.
Finally, as a result of the digitization of the ECG signal within the
patient acquisition module, analog cable noise is eliminated. Thus,
regardless of cable movement or length, GE systems receive the cleanest
data possible for processing.

Revision C Physician’s Guide 15
2051167-002
3 Conditioning the ECG
Signal
The Importance of Noise-Free ECGs
A fundamental requirement of any system designed for exercise
electrocardiography is the ability to present noise-free ECGs without
distortion of the waveforms. In the absence of aggressive filtering, this
presents a formidable challenge as measurements of the smallest ECG
wave (the ST segment) in minute increments (tenths of millimeters)
under trying circumstances (strenuous exercise) are attempted.
The diagnostic value of stress testing is enhanced by computer-assisted
systems. GE systems aim at producing accurate measurements through
an improved signal-to-noise ratio in the ECG recorded during exercise.
Signal-to-noise improvements are achieved by the application of filters
and/or signal processing algorithms.

16 Physician’s Guide Revision C
2051167-002
Conditioning the ECG Signal: Filtering
Filtering
Filters, in the traditional sense, are mechanisms for removing certain
frequencies of an analog signal. Low-pass filters permit the passage of
frequencies below a specified value to be reflected in the waveform.
Conversely, high-pass filters permit only those frequencies above the
specified value to be included in the process.
The American Heart Association requires diagnostic ECG
instrumentation to be capable of recording waveforms with a fidelity of
0.05 to 150 Hz, or more challengingly, instead of 150 Hz, it must be
capable of processing triangle pulses of 1.5 mV (15 mm) amplitude and
20 ms width, according to ANSI/AAMI standard EC11
74
. GE stress
systems exceed the American Heart Association specifications. The
plurality of GE’s stress systems, such as CASE, have a non aggressive
low-frequency response of 0.01 Hz, in order to prevent artifactual ST
segment abnormalities
5,8
.
Noise Filters
The QRS complex represents the high-frequency component of the
electrocardiogram. Low-pass filters of 20, 40, and 100 Hz are user
selectable on GE stress systems for the purpose of attenuating muscle
noise from the baseline. Figure 3.1 illustrates the effects of successively
more aggressive low-pass filters on the ECG signal. These filters
significantly reduce muscle artifact and have essentially no effect on the
low-frequency components of the ST segment. R-wave amplitude,
however, will be attenuated with the 20-Hz and 40-Hz filters.
Figure 3.1 The effects of successively more aggressive low-pass filters on the ECG signal
(H. Blackburn (ed), Measurement in Exercise Electrocardiography: The Ernst
Simonson Conference. Charles C. Thomas Publisher, Springfield 1969
4
.
Froelicher V.F, Exercise and the Heart: 3
rd
edition
2
)
100Hz
60 Hz
50Hz
40 Hz
30 Hz
20 Hz
10 Hz
5 Hz
1 Hz

Revision C Physician’s Guide 17
2051167-002
Conditioning the ECG Signal: Filtering
Baseline Roll Filters
Filters at the low end of the frequency spectrum of electrocardiographs
are called baseline roll filters. Those as aggressive as 0.25 Hz or even
0.5 Hz effectively reduce baseline roll due to respiration. However, some
potentially introduce a phase shift in the QRS complex resulting in
artificial changes in the region of the ST segment. Filters such as these
should never be employed in instruments designed to reproduce
physiologic ST segment changes. GE systems exceed AHA
recommendations by employing a non-aggressive high-pass filter at the
low end of the frequency range. Instead, baseline roll is controlled with
the implementation of a baseline correction algorithm. (See “Cubic
Spline Baseline Correction” on page 18 and “FRF (Finite impulse
response Residual Filtering) Algorithm” on page 19.)
GE’s incrementally updated median QRS complexes are presented at the
full diagnostic frequency response. Regardless of the noise and baseline
roll filters chosen for the ECG data, ST-segment and R-wave amplitude
measurements are made on unfiltered data. This provides the highest
level of accuracy possible with the greatest reproducibility.
50/60-Hz Line Filters
Despite all of the methods used to reject common mode signals, power
line interference (often referred to as 50/60 Hz “buzz”) will continue to be
part of the acquired signal. This is due to magnetic field induction of
differential signals in loops formed by a lead connection to the body.
Since digitization takes place at the patient, lead wire length is very
short, minimizing these signals. Nevertheless, GE uses a line frequency
filter, removing any remaining 50/60-Hz buzz.
This filter must know the line frequency, 50 or 60 Hz, at which the
system operates. The appropriate filter is preset at the factory prior to
shipment. Your system removes the line frequency noise by monitoring
for, locking in on, and subtracting the opposite sinusoidal wave. This
filter has a dramatic effect. Notice its operation on the following signal
below.
Figure 3.2 The elimination of AC line frequency interference with application of a 50/60-Hz
line filter.

18 Physician’s Guide Revision C
2051167-002
Conditioning the ECG Signal: Cubic Spline Baseline Correction
Cubic Spline Baseline Correction
GE’s stress systems feature a cubic spline algorithm for removing
baseline roll. This is employed as an alternative to aggressive baseline
filtering. The technical details of this method are described in
“Electrocardiogram Baseline Noise Estimation and Removal Using
Cubic Splines and State-Space Computation Techniques”, Computers
and Biomedical Research
7
.
The cubic spline algorithm requires that three consecutive isoelectric
points be reliably detected. The onset of the QRS is ideal for this
purpose. At low heart rates, a point in the isoelectric area between the T
and P waves is used in addition. The three consecutive points are used to
establish and estimate the baseline roll. This estimate is then subtracted
from the original ECG to yield a baseline-roll-reduced ECG with no
waveform phase distortion. Figure 3.3 demonstrates the capability of the
cubic spline.
Figure 3.3 Application of the cubic spline to an ECG signal that exhibits respiratory induced
baseline roll.
As three isoelectric points are required for the cubic polynomial to
operate, the ECG is delayed 2 seconds, for example rhythm reports
recorded with the spline engaged are delayed by these 2 seconds.
3 seconds

Revision C Physician’s Guide 19
2051167-002
Conditioning the ECG Signal: FRF (Finite impulse response Residual Filtering) Algorithm
FRF (Finite impulse response Residual Filtering)
Algorithm
Most GE stress systems feature the FRF algorithm for removing noise
and baseline roll. This is employed as an alternative to aggressive noise
and baseline filtering. Also it is an alternative to the Cubic Spline
Baseline Correction which only reduces the baseline roll. The method
was published in “Artifact Processing during Exercise Testing”, Journal
of Electrocardiology
13
.
The FRF algorithm reduces the artifacts in the ECG stream, but with
much less distortion of the QRS complexes. It consists of a block that
updates the median beat and a function that subtracts the median beat
from the ECG and then outputs a residual signal. The residual signal is
fed into a low-pass filter, a high-pass filter, and finally into a function
that adds the median beat (see Figure 3.4).
Figure 3.4 Block diagram of the FRF algorithm
The median beat is continuously updated only if the current QRS
complex correlates with the median beat. The chosen correlation limits
guarantee continuous updating. The subtraction function subtracts the
median beat only if there is a reasonable accordance between median
beat and current beat. If the current beat is a PVC, for example, no
subtraction is done. The median beat is subtracted from the QRS onset
to the T end. The P wave is not subtracted. In cases of PSVCs, atrial
fibrillation, atrial flutter, AV block II (Wenckebach, Mobitz), and AV
block III, for example, a subtraction of the P wave of the median beat
would be erroneous.
The result of the subtraction function is the residual signal. This signal
is filtered by a low-pass filter to reduce muscle noise and a high-pass
filter to reduce baseline wander. The cutoff frequencies of the filters are
set to values that avoid unacceptable distortion of the remaining P
waves and PVCs in the residual signal. The constant delay of the filters
enables the addition function to add the median beat to the filtered
residual signal at the exact position, i.e., the position where it was
subtracted before. The addition function does not add the P waves. If a
median beat is not available or in case of a pace ECG, the filters are
switched off.

20 Physician’s Guide Revision C
2051167-002
Conditioning the ECG Signal: FRF (Finite impulse response Residual Filtering) Algorithm
For your notes

Revision C Physician’s Guide 21
2051167-002
4 Signal Processing
Mathematical Algorithms
Signal processing employs mathematical algorithms to
effectively detect beats,
classify their morphology, and
properly superimpose normally conducted beats.
The most prevalent method of signal processing takes an average of a
defined time window or block of consecutive beats. This process, termed
arithmetic averaging, produces a mean QRS complex.
GE uses a unique noise-rejection algorithm called incremental updating.
This mechanism, sometimes called incremental averaging, produces a
median QRS complex. The technical aspects of this program were
described in Trends in Computer-Processed ECG’s, North Holland Press,
1977.
In a perfect world where stress ECGs would not be affected by random
noise – muscle artifact in particular – one might be hard-pressed to label
a single approach to signal processing as superior. However, under
actual conditions where noise is a fact of life, the median QRS complex
produced by the incremental update process steps to the front.
Signal processing consists of five consecutively applied algorithms:
First, the best leads for QRS detection must be selected.
Second, the incoming beats must be detected, and heart rate updated.
Third, the incoming beats are classified on the basis of RR intervals
and QRS morphology.
Fourth, a correlation and alignment algorithm overlays the
incoming beat to the dominant template for best fit and determines
the degree of agreement between the incoming beat and the
template.
Finally, successfully correlated beats incrementally update the
dominant template.
During exercise testing and especially in the high exercise phase, it
occurs very often that only a few of the applied leads deliver a
reasonable ECG quality.
It is obvious that by selecting only good leads, the QRS complex
detection quality can be improved. Instead of using an algorithm, which
combines leads without taking account of their quality, GE developed a
new algorithm, the Intelligent Lead Switch algorithm.

22 Physician’s Guide Revision C
2051167-002
Signal Processing: Intelligent Lead Switch Algorithm
Intelligent Lead Switch Algorithm
The advantage of the algorithm is a more reliable QRS detection, even in
the high exercise phases. The method was published in “Artifact
Processing during Exercise Testing”, Journal of Electrocardiology
13
.
Initially, after application of all relevant electrodes, the algorithm
selects the two best leads. During exercise testing, the selection process
is restarted when the best leads become disconnected or the signal
quality of the selected best leads becomes insufficient.
During exercise testing the algorithm switches between the two best
leads, always selecting the artifact-free lead. In the presence of special
arrhythmias the algorithm also switches to the lead that is better suited
for QRS complex detection, e.g., in the case of a bigeminy with very big
premature ventricular complexes and small normal complexes or
ventricular tachycardia with very small complexes.
During exercise testing the algorithm looks at the arrhythmia results of
the alternative lead and corrects the result of the current lead if
necessary. This would be the case when a premature ventricular
complex in the current lead is very small (then the algorithm recognizes
a pause), but displayed more clearly in the alternative lead.
The algorithm consists of:
up to 15 independent and equivalent units for QRS detection, ECG
quality evaluation, and event classification
a logical unit for starting/restarting the selection process of the two
best leads, for selecting the results of the best channel, correcting
the event classification of the best channel, and correcting the
trigger points (times where the QRS complexes are located) of the
best channel
The ECG quality is calculated on the basis of the QRS complex
amplitudes, the levels of middle and high frequency noise, and the
electrode status (e.g., connected or disconnected electrodes). Examples
for classified events are pauses, premature supraventricular complexes
and premature ventricular complexes. If a pause is detected in the best
channel, and the algorithm finds premature ventricular complexes in
other channels, it will correct the event classification and the trigger
points of the best channel.

Revision C Physician’s Guide 23
2051167-002
Signal Processing: Detection of Cyclic Artifact Algorithm
Detection of Cyclic Artifact Algorithm
During an exercise test the patient normally walks or runs on a
treadmill or rides a bicycle. In both cases the patient produces cyclic
artifacts. With increasing exercise, the artifacts increase as well.
The origin of those artifacts is muscular activity or changes in electrode
position, caused by the movement of the patient. Electrode position
changes produce artifacts whose frequency content is very often similar
to the QRS complexes. For this reason, the artifacts are very difficult to
detect. Furthermore, they are dangerous because they disturb the
detection of QRS complexes. This can lead to wrong heart rate values, to
wrong arrhythmia results, and to erroneous interpretation of the
exercise test.
Once a cyclic artifact rhythm is detected the information is used as an
input for the Intelligent Lead Switch Algorithm for selection of other
ECG channels with reduced artifact levels, for example, to ECGI and
ECGV6 in Figure 4.1. The method was published in “Novel Signal
Processing Methods for Exercise ECG”, International Journal of
Bioelectromagnetism
14
.
ECG and the cyclic artifacts are two independent rhythms. During
exercise both, the RR intervals and the intervals of the cyclic artifacts,
do not vary very much over a short time range. To identify and separate
the two independent rhythms an algorithm is used which tries to find
independent chains of intervals. Cyclic artifacts are detected when the
algorithm has found another independent chain in addition to the chain
of RR intervals. Leads containing two independent chains are of poor
quality.
Figure 4.1 ECG with cyclic artifacts. In leads ECGV2 to V5 both rhythms are visible, in
ECG leads I and V6 only the ECG rhythm is visible, and in ECG lead V1 only the
cyclic artifacts are visible.

24 Physician’s Guide Revision C
2051167-002
Signal Processing: QRS Detection
QRS Detection
In GE stress systems the QRS complexes are detected independently in
different leads. Then the information about the detected QRS complexes
of every lead is combined in a logical way depending on artifacts,
amplitudes, etc. (see preceding “Intelligent Lead Switch Algorithm” on
page 22). The combined information results in an accurate and reliable
QRS detection, even in the high exercise phase.
Detecting QRS complexes in each individual lead has the advantage of
not loosing any information about the QRS complex, T wave, and P
wave. Since the morphology of the ECG waves is not destroyed, the
discrimination of QRS complexes and artifacts is very high.
QRS detection algorithms used earlier and by the competition transform
the ECG leads and combine them to one signal for QRS detection. All
these transformations eliminate important information with the effect
that QRS detection will be more disturbed by artifacts or will be less
sensitive.
The new QRS detection algorithm adapts to the current QRS complexes,
to T waves, to P waves, and to the overshoots or undershoots of a
pacemaker ECG. The knowledge about the T waves and P waves is used
to avoid the misclassification of a T wave, or a P wave as a QRS complex,
for instance, and provides a higher tolerance to artifacts.

Revision C Physician’s Guide 25
2051167-002
Signal Processing: Correlation and Alignment
Correlation and Alignment
After QRS detection, the correlation and alignment algorithms form the
basis for the incremental update. The process begins by selecting an
incoming beat. This beat becomes the seed for the dominant median
template. The following beat is superimposed on the dominant template.
The beat is aligned horizontally and vertically until the maximum
possible correlation coefficient is attained. If the correlation coefficient is
considered to be insufficient, the incoming beat is classified as an ectopic
beat and is not considered for further processing. If the correlation
coefficient is high, the beat is used to update the dominant median
template. If the process begins by selecting an ectopic beat, the ensuing
normal beats will not correlate. In this case further complexes are
collected. Then the resulting ECG pattern is analyzed for selection of the
correct (normal) beats for the dominant template. This will occur when
ventricular ectopic beats, e.g., bigeminy and trigeminy, are found in the
ECG.
The template is held in a buffer of 1200 milliseconds. The QRS trigger
point is arbitrarily placed at 400 milliseconds into this buffer (see
Figure 4.2). This large buffer ensures that QT and PQ intervals, even
when they are extremely long, can be stored and processed in their
entirety.
Figure 4.2 Placement of the median template into a 1200-millisecond buffer
Figure 4.3 Incoming beat superimposed on the median template and shifted for maximum
alignment
1200 ms
buffer
400 ms
QRS detection
trigger
Incoming beat
Template

26 Physician’s Guide Revision C
2051167-002
Signal Processing: Incremental Updating
Incremental Updating
Whenever the incoming beat correlates with the median template, the
template is updated (positively or negatively) by a fixed increment or a
fraction of the difference between the median template and the incoming
beat, whichever is less. With this process, the median morphology tends
in the direction of consistent, non-random changes in amplitude, for
example, ST segment depression. The process assumes that noise is
random, and the erratic amplitude changes associated with noise are
limited to immeasurably small changes in the median beat.
Relearn
If the QRS morphology changes during stress testing in a normal way,
the median update algorithm will be able to follow these changes.
Occasionally patients present significant changes in QRS morphology.
GE stress systems recognize these changes and “relearn” the median
template. During this process, the ST segment measurement points are
also relearned. An automatic relearn also occurs after reapplying
disconnected electrodes. A manual relearn can be initiated by the user.
When relearning, an incoming beat is established as the dominant
template. If the next beats do not correlate with the first beat, the
relearning procedure starts again. In case of ventricular ectopia, e.g.,
bigeminy and trigeminy, the algorithm is able to select the normal beats
for creating the new dominant median beat.
During the relearn phase, a question mark (?) appears after the ST
measurements of the median complex on the screen. Also, any reports
run during this period will display question marks after the ST
measurements. This indicates that the values may be unreliable during
the relearn phase.
As the system monitors each beat for proper shape discrimination, a
record of the last beats is constantly updated to determine the number of
beats successfully updated. If 20 of the last preceding beats fail to align,
the warning “Median Update Ceased” will appear on the screen, and an
automatic relearn occurs. Prolonged, excessive artifacts may cause this
message to appear. The median beat and the ST measurements remain
on the screen. If within a one-minute period a new median beat cannot
be created, the median beat and the measurements are deleted, and the
automatic relearn function is repeated . The manual relearn may be
used at this time if visual inspection of the raw rhythm shows
discordance with the median.

Revision C Physician’s Guide 27
2051167-002
Signal Processing: Pace Enhance
Pace Enhance
Displaying pacemaker pulses is sometimes difficult. In some cases the
pacemaker pulses are narrow and cannot be displayed; in other cases
they are large and disturb the readability of the ECG. The pace enhance
function solves these problems.
When enabled, the pace enhance function will replace the pacemaker
pulse with a marker of the same polarity as the ECG signal in each lead.
If the pacemaker pulse is small (in the range of ±0.1 mV) a positive
marker is added to the pacemaker pulse.
This is what the pace enhance function does in detail:
It adds a marker (1.5 mV amplitude, 6 ms duration) of the same polarity
as the pacemaker pulse to the ECG electrode signal.
It limits the added sum of pacer pulse and marker to 0.5 mV in the ECG
lead signal.

28 Physician’s Guide Revision C
2051167-002
Signal Processing: Pace Enhance
For your notes

Revision C Physician’s Guide 29
2051167-002
5 Measurement Values
Heart Rate
The heart rate is calculated as a 16-beat sliding average and the display
is updated every second. This provides stability to the rate during sinus
arrhythmia and atrial fibrillation, yet allows rapid tracking of dramatic
rate changes as in paroxysmal tachycardia.
In the initial learn mode, the heart rate is calculated by averaging the
RR intervals of the available beats. The heart rate is displayed when at
least four beats are detected.
Evaluation of the accuracy of the heart rate is based on the results from
annotated databases consisting of exercise ECGs from treadmill tests
and exercise ECGs from bicycle tests.
Table 5.1 Heart rate performance (DOC0996283)
Note
On GE systems, the leads used for the QRS detection are selected
automatically, but they are also user selectable before and during
the stress test. Consult your operator’s manual for details.
The heart rate HR is one of the most important outcomes of an exercise
test. The HR course during exercise contains valuable information about
coronary stenosis
64,79
and cardiovascular mortality risk
33,39,41
. But it is an
indirect method and, therefore, other factors, such as the exercise device
used—treadmill or bicycle—also influence the HR values. Most patients
achieve higher peak HR values on treadmills than on bicycles
87
.
Database average mean error average RMS value
Bicycle ECGs - 0.14 bpm 0.76 bpm
Treadmill ECGs - 0.2 bpm 0.99 bpm

30 Physician’s Guide Revision C
2051167-002
Measurement Values: ST Segment Values
Figure 5.1 Mean values of "HR at peak exercise" of different exercise devices and
pharmacological Adenosine stress test, based on the GE-Healthcare
exercise/stress test database, containing more than 20.000 patients.
ST Segment Values
GE’s methodology involves locating an isoelectric reference (E point) and
the QRS offset (J point), and measuring the ST segment at a user-
defined or heart-rate related distance x past the J point. (See Figure 5.2)
It is identical in approach to the manner with which one would manually
measure the values.
Figure 5.2 GE stress systems measure ST segments by locating an isoelectric reference
(E point), the offset of the QRS complex (J point) and the post-J measurement
point (J+x point) for measuring the ST segment.
E point
J point
x

Revision C Physician’s Guide 31
2051167-002
Measurement Values: QRS Onset and Offset Detection
QRS Onset and Offset Detection
QRS onset precedes the first deflection in the used leads, and QRS offset
occurs where the last steep slopes of depolarization are replaced by the
more or less flat ST segment. The method employed by GE stress
systems uses up to 16 leads, determining the earliest onset and latest
offset in the leads. The isoelectric point (E point) is placed at
10 milliseconds prior to the earliest QRS onset. This avoids the Q and R
waves, yet stays well off the P wave even with decreasing or initially
short P-R intervals.
For stress testing two methods for calculation of the E and J points are
user selectable. The first method calculates the E and J points before the
actual exercise, i.e., in the pre-exercise phase (single calculation). Then,
during exercise, the median beat is aligned between these two points.
The second method continuously recalculates the E and J points with
every incoming beat (continuous calculation). The reasons for using the
first method are historical. The second method, which is the factory
default method, is the correct one, because it is able to adapt the E and J
points when the QRS width changes. In the majority of cases, however,
the QRS width will not change significantly during stress testing.
Waveform measurement is relatively straightforward once QRS onset
and offset are known. All measurements are taken from the median
complexes, providing immunity from noise while at the full diagnostic
frequency.
Note
Both the E and J points are user adjustable on most GE stress
systems. Consult your operator’s manual for details.
ST Level
ST levels are simply the amplitude difference between the isoelectric
reference point (E) and the post-J measurement point (J+x point). The
operator has the possibility to enter a fixed value, e.g., 60 milliseconds
for the distance x, or to select a method for heart-rate adaptive
calculation of the distance x. Two methods for heart-rate-adjusted
calculation are available:
x = RR/16
RR = RR interval. The formula is also used in GE’s 12SL resting
program
x = 3/16 (656/(1 + 0.001 × HR) – 90 ms)
HR = heart rate. The part of the formula in italics is derived from
P.M.Rautaharju et al., Estimation of qt prolongation, Journal of
Electrocardiology, 23:111-117, April 1990
10
Instead of using a heart rate adjusted method, the ST level
measurements may be adjusted by the user at any time. For example, an
ST measurement point of 80 milliseconds post J may be manually swept
forward as heart rates increase.

32 Physician’s Guide Revision C
2051167-002
Measurement Values: ST Slope
ST Slope
An ST slope is measured over an interval established as 1/8 of the
average RR interval to a maximum of 80 milliseconds. The interval
starts at the J point. This definition of slope takes into account the
correlation between heart rate and repolarization time. Effects of the
T wave on ST slope measurement are avoided.
In an algebraic sense, the slope of a given line is defined as the rise
divided by the run. Figure 5.3 illustrates the algebraic determination of
a slope on an ECG with ST-segment depression. Contrary to visual
examination, the slope would be reported as positive.
Figure 5.3 The algebraic determination of this ST slope would report it as positive despite
the presence of 2 millimeters of ST-segment depression
GE systems employ a least squares fit in order to provide a close match
with visual impressions. The actual slope measurement in millivolts per
second is the result of a least squares fit of a straight line in
40-millisecond subintervals in the ST interval from J to 1/8 of the
average RR interval. (See Figure 5.4) The most negative slope is
reported. This provides a close match with visual impressions.
Figure 5.4 By employing a least squares fit for ST slope determination, GE provides a
better match with the visual impression
80ms post JJ point
Baseline
2 mm ST
depression
1/8 RR interval
(up to 80 ms)

Revision C Physician’s Guide 33
2051167-002
Measurement Values: ST Integral
ST Integral
An ST integral is measured over an interval from the QRS offset to the
point where the ST segment crosses the isoelectric line, or to the point
corresponding to 7/16 of the total ST-T duration, whichever occurs first.
An ST integral below the isoelectric line greater than 10 µVs is
considered abnormal. Note: One square mm on electrocardiographic
paper at standard speed (25 mm/s) and calibration (10 mm/mV) is
4µVs.
2
ST Index
An ST index is "1" when the ST depression is 1.0 mm (0.1 mV) or
greater, or the sum of ST segment depression in mm plus the ST down
slope in mV/s is 1.0 or greater. If the conditions above are not fulfilled,
then the ST index is "0". The ST depression is measured in the post J
measurement point (J+x point).
R-Wave Amplitude
The R-wave amplitude is the difference in amplitude between QRS onset
and the first maximum positive value.
QRS Width
The QRS width is the difference between QRS offset (J point) and QRS
onset. During exercise testing, the QRS width is calculated continuously,
but two values are the most important ones: QRS width at the beginning
of the exercise phase and QRS width at peak exercise. These values are
used to detect exercise-induced bundle branch blocks.
Figure 5.5 Exercise-induced LBBB, induced in the exercise phase, lead V6
Exercise-induced bundle branch blocks are rare, but they have the
tendency to become permanent bundle branch blocks.
80

34 Physician’s Guide Revision C
2051167-002
Measurement Values: ST/HR Slope
Continuous calculation of QRS onset and offset is the precondition for
detection of exercise-induced bundle branch blocks. Please make sure
that the settings are correct (example: see Figure 5.6).
Figure 5.6 “Calculation (E, J point)” setting in CASE/CardioSoft/CS for proper detection of
the exercise-induced bundle branch block. J point is the QRS offset, E point is
calculated from the QRS onset by subtracting 10ms.
ST/HR Slope
The ST/HR slope was originally developed by Dr. R. J. Linden at the
University of Leeds, United Kingdom, in the late 1970s
16
. It is reported
to yield more accurate electrocardiographic determination of the
presence and severity of coronary heart disease. While originally applied
only to bicycle ergometry testing, it has recently been adapted for
treadmill exercise by Dr. Paul Kligfield and colleagues at Cornell
University.
15,17,18,19,20,21,22,23
The criteria are based on the near parallel increase of myocardial oxygen
demand and heart rate with increasing effort. Essentially, the exercise
electrocardiogram is evaluated by linear regression analysis of the rate-
related change in ST depression as measured at 60 milliseconds post-J
point. Originally, the 12 classical leads and bipolar lead CM5 were
evaluated. Changes in leads aVR, aVL, and V1 have been found to be
poorly specific and are currently ignored. The addition of lead CM5
improves sensitivity appreciably.
A plot of ST segment depression versus heart rate is drawn for all
measured leads. Linear regression analysis is used to best fit a line
beginning at peak exercise and extending backward through at least
three points until significance is obtained (p < 0.05). The points are
taken from the ST level and heart rate at the end of each 2-minute
exercise stage. The slope of this line is then determined and presented in
units of microvolts/beats per minute. The steepest slope of all the leads
is reported and graphed, if the ST segment depression is ≥50 µV.
The large increments in heart rate between stages of the Bruce protocol
were found to yield an inadequate number of points for proper slope
evaluation. A modification of the Bruce protocol (half work loads in
2-minute exercise stages) more closely approximate the roughly 10 beats
per minute increments found in ergometry testing. This protocol,
developed at Cornell University by Okin, et al.
22
, is reproduced here and
is strongly recommended for the highest predictive accuracy.

Revision C Physician’s Guide 35
2051167-002
Measurement Values: ST/HR Index
Table 5.2 Cornell Treadmill Protocol for ST/HR Slope
Former work
22
established the cut point for normalcy at 2.4µV/bpm.
Patients with three-vessel disease had slopes above 6.0µV/bpm.
ST/HR Index
The ST/HR index was developed by Dr. Paul Kligfield and colleagues at
Cornell University. The ST/HR index is an approximation to the ST/HR
slope and therefore comparable results can be achieved
18
.
Compared with standard test criteria, simple heart rate (HR)
adjustment of ST depression during exercise electrocardiography can
improve the identification and assessment of underlying coronary artery
disease. Since heart rate during exercise drives progressive ST segment
depression in the presence of coronary obstruction that limits flow
reserve, the ST/HR index controls for the increasing metabolic severity
of ischemia that accompanies exercise. Improvement of exercise test
sensitivity with the ST/HR index results from reclassification of
otherwise “equivocal” and even “negative” test responses, including
increased identification of one and two-vessel disease in men and in
women. In addition, in population studies of low and moderate risk
subjects, the ST/HR index can increase the prognostic value of the
exercise electrocardiogram for prediction of cardiac risk and mortality
24
.
In contradiction to ST/HR slope, ST/HR index is much more simpler, is
not restricted to special protocols, does not need a significant regression
line, and always provides a value. It is simply calculated by dividing the
change of the ST depression from the baseline value (exercise start) to
maximum exercise by the change in heart rate over the same time
period. The leads are scanned for the greatest ST/HR index.
Duration of Exercise Stage (min) Speed (mph) Grade (%)
21.70
21.75
21.710
22.111
22.512
23.013
23.414
23.815
24.216
24.617
25.018
25.519

36 Physician’s Guide Revision C
2051167-002
Measurement Values: Recovery ST Level
Figure 5.7 ST/HR index and ST/HR slope
ST/HR index is an approximation of the ST/HR slope
Recovery ST Level
The measurements above do not include the recovery phase. In addition
to the exercise phase, the recovery phase delivers valuable information.
The ST level 0.5 mm at 3 minutes of recovery, for example, is more
reliable and precise than the ST level of 1mm at peak exercise (see
Figure 5.9).

Revision C Physician’s Guide 37
2051167-002
Measurement Values: ST/HR Hysteresis
ST/HR Hysteresis
The ST/HR hysteresis was developed by Dr. Rami Lethinen et al.
37
at
Tampere University, Finland, as an extension of the ST/HR loop
25
. It is a
highly powerful measurement for identification of coronary artery
disease (CAD)
37,90
and prediction of acute myocardial infarction
73
. It is
comprehensive, because it takes both, the exercise and the recovery
phase in account. Precondition for a proper ST/HR hysteresis
measurement is an adequate recovery phase. Proposed are 3 minutes.
ST/HR hysteresis increases the sensitivity and specificity in both men
and women, and is a “more competent method in CAD detection in
women than ST-segment depression and ST/HR index”
44
.
ST/HR hysteresis is calculated by integrating the difference in the ST
segment depression between the exercise and recovery phase over the
HR (heart rate) for up to 3 min of the recovery phase (see Figure 5.8).
After integration, the integral is divided by the HR difference (peak
exercise HR – minimum HR during recovery)
37,40,41
.
Figure 5.8 Significant ST/HR hysteresis. The area between the lower curve (exercise
phase) and the upper curve (recovery phase) divided by the difference of the
peak exercise HR and the minimum HR during 3 minutes recovery is the ST/HR
hysteresis.
Please note: Negative level values, or ST depression values, are above the zero
line. A negative level expressed as a value above the zero line indicates a
positive exercise test.
ST/HR hysteresis is an advanced ST depression measurement, because
it is the average difference of ST depression between recovery and
exercise phase. Consequently the dimension of ST/HR hysteresis is mV
(millivolt) or mm (millimeter).

38 Physician’s Guide Revision C
2051167-002
Measurement Values: ST/HR Hysteresis
The following Figure 5.9 shows the ischemia detection quality
differences of different methods. At a threshold of 0.01 mV, ST/HR
hysteresis achieves a sensitivity of 80% and a specificity of more than
80%. The ST depression at peak exercise at the threshold of 0.1 mV
(1mm) achieves only a sensitivity of 55% with the same specificity.
Figure 5.9 Receiver-operating characteristic curves for the continuous diagnostic variables
and the operating point for the dichotomous heart rate (HR) recovery loop. The
curve symbols refer to the partition values of the variables. Some of these
values are specified, expressed in millivolts for the ST/HR hysteresis and ST
depressions, and in mV/beat/min for the ST/HR index. AUC = area under the
receiver-operating characteristic curve
37
Sometimes ST/HR hysteresis curves are disturbed. This occurs in
patients with pacemaker, atrial fibrillation or exercise induced bundle
branch blocks. Responsible for this phenomenon are abrupt changes in
the ST segment and/or discontinuous changes in the heart rate.
Excessive noise can also disturb the curve.

Revision C Physician’s Guide 39
2051167-002
Measurement Values: Arrhythmia Detection
Arrhythmia Detection
Arrhythmia analysis distinguishes between single-beat events and
multi-beat events. Single-beat events are classified by linking
characteristics such as the current RR interval, the current QRS
morphology, the dominant RR interval, and the dominant QRS
morphology with a rule database. An example for a rule type leading to
the PVC classification is
If
the current RR interval is shortened
and
the next RR interval is a compensatory pause
and
the morphology is different from the dominant QRS morphology
then
the current beat is a PVC.
Multi-beat events result from multiple, consecutive single-beat events.
Two consecutive PVCs, for instance, are a couplet, an alternating
sequence of PVC and normal beat is classified as a ventricular bigeminy
(see Table 5.3).
In addition, three consecutive 4-second sliding windows are checked for
ventricular fibrillation/flutter, rapid ventricular tachycardia and
asystole.

40 Physician’s Guide Revision C
2051167-002
Measurement Values: Arrhythmia Detection
Table 5.3 Arrhythmic events with their acronyms. All events, except artifact and learn
phase, which are not true events, appear in the event window. An event involving
complex ectopy is highlighted. On CASE systems and CardioSoft/CS, for
example, these events are shown in red
When the arrhythmia analysis is started, the system needs
approximately 5seconds of ECG data to establish the thresholds for
QRS detection. The arrhythmia analysis program will analyze two leads
of ECG. These two leads are either selected manually by the user or they
are automatically determined by the program. In the latter case, the
program scans all available leads to find the two best leads. This takes
place at the same time as the determination of the QRS detection
thresholds and prolongs the initial process by 1 second. Then, after
10 beats have been collected, the dominant beat (learned QRS complex)
will be determined. On the full-disclosure ECG, each of these
10 complexes is labeled with an “L”. The first beat after the end of the
learn phase that matches the morphology of the dominant beat, is
displayed in the event window and labeled “QRSL”.
The GE arrhythmia analysis algorithm accepts noisy ECGs, allowing for
almost uninterrupted monitoring and for a high sensitivity in
identifying events. Extremely noisy beats or artifactual beats, however,
are rejected or not accepted for event classification. On the full-
disclosure ECG, these beats are labeled with an “A”. Ventricular
bigeminy is identified as an alternating sequence of normal beats and
PVCs. At least two PVCs must be detected. A ventricular escape beat is
identified when the current RR interval is prolonged and the morphology
differs from that of the dominant beat.
learned QRS complex QRSL
* asystole ASYSTO
* ventricular fibrillation/flutter VFIB
* ventricular tachycardia VTAC
* ventricular run (> 2 PVCs) RUN
* ventricular couplet (2 PVCs) CPLT
atrial fibrillation AFIB
pause of 2 missed beats PAU2
pause of 1 missed beat PAU1
ventricular bigeminy VBIG
paroxysmal supraventricular tachycardia PSVT
pacer error PERR
ventricular escape beat ESC
premature ventricular complex PVC
premature supraventricular complex PSVC
pacemaker capture PCAP
artifact A
learn phase L
* event of complex ectopy

Revision C Physician’s Guide 41
2051167-002
Measurement Values: Arrhythmia Detection
For pacemaker patients (this information should be entered on the
patient demographics screen) the arrhythmia analysis algorithm
analyzes the temporal relationship of pacer pulse and QRS complex.
“Pacemaker capture” is detected when the QRS complex occurs within
300 ms of the pacer pulse. If the QRS complex occurs later than 300 ms
after the pacer pulse or not at all, the event is labeled as “pacer error”.
Atrial fibrillation is detected on the basis of irregular RR intervals and
absence of P-waves. Ventricular fibrillation/flutter is identified by
frequency analysis in consecutive 4-second windows.
Detection of ventricular fibrillation/flutter or rapid ventricular
tachycardia is based on three consecutive 4-second sliding windows. If
the criteria for ventricular fibrillation/flutter or rapid ventricular
tachycardia are fulfilled in at least two of the windows, VFIB or VTAC is
classified. Asystole is detected in the last 4-second sliding window but
only if no fine ventricular fibrillation is detected.
Arrhythmia detection cannot be disabled by the user. Continuous
detection is necessary to prevent abnormals from entering into the
update process. If arrhythmia detection were disabled and enabled
during the stress test, it would be impossible for the system to provide a
complete and correct documentation of arrhythmia events.
During the stress test, the event window shows the most recent event
with its event label, i.e., the new event overwrites the previous one.
However, if events belong to the same category, the first of these events
remains displayed. This prevents the screen display from becoming
unsteady. All events that can be displayed are listed in Table 5.2.
Artifactual QRS complexes (artifact “A”) and QRS complexes from the
learn phase (“L”) do not appear in the event window.
Events with complex ectopy (see Table 5.3) such as a ventricular run,
will be highlighted in the event window.
The event window continuously displays the ventricular ectopics (VE)
per minute. This value is calculated as the sum of all PVCs and ESCs
detected in the past 60-second interval, including the PVCs of
ventricular tachycardias, runs, couplets, and bigeminy. A new PVC or
ESC will thus immediately update the VE/min (ventricular ectopic per
minute) value.
During the stress test, the system can save a full-disclosure ECG for
review of the arrhythmias at the end of the test procedure. The full-
disclosure ECG is sampled at a lower rate sufficient for evaluation of
arrhythmias. For more information, please consult your operator’s
manual.

42 Physician’s Guide Revision C
2051167-002
Measurement Values: Arrhythmia Detection Performance
Arrhythmia Detection Performance
Evaluation of the accuracy of the algorithms is based on the results from
annotated databases. Depending on the intended use of the algorithms,
namely for exercise testing, we compiled a set of annotated databases
with more than 1000 ECGs, consisting of exercise ECGs from treadmill
tests, exercise ECGs from bicycle tests, pacemaker ECGs, the MIT-BIH
database and the AHA database
48
.
To evaluate the QRS detection and the ventricular ectopic performance
we followed the standard ANSI/AAMI EC57, Testing and reporting
performance results of arrhythmia and ST segment measurement
algorithms
48
.
Table 5.4 QRS complex detection performance. (DOC0996283)
sensitivity = true positives / (true positives + false negatives)
pos.predictivity = true positives / (true positives + false positives)
Table 5.5 Ventricular Ectopic Detection Performance (DOC0996283)
sensitivity = true positives / (true positives + false negatives)
pos.predictivity = true positives / (true positives + false positive)
false positive rate = false positives /(correct negatives + false positives)
Database sensitivity pos. predictivity
MIT-BIH 99.8% 99.8%
AHA 99.6% 99.8%
Bicycle ECGs 99.9% 99.96%
Treadmill ECGs 99.9% 99.9%
Database sensitivity pos. predictivity false positive rate
MIT-BIH 92% 94% 0.43%
AHA 94% 97% 0.29%
Bicycle ECGs 80% 93% 0.03%
Treadmill ECGs 77% 84% 0.21%

Revision C Physician’s Guide 43
2051167-002
Measurement Values: Exercise-Induced Wide QRS Tachycardia
Exercise-Induced Wide QRS Tachycardia
Exercise-induced wide QRS tachycardias are rare. They are mostly
ventricular tachycardias. An exercise-induced wide QRS tachycardia is
detected when at least 10 consecutive premature wide complexes with a
heart rate (HR) > 140 bpm occur. The tachycardia is analyzed in both,
exercise and recovery phase.
Figure 5.10 Exercise-induced ventricular tachycardia (VT) occurred in recovery, V5

44 Physician’s Guide Revision C
2051167-002
Measurement Values: Exercise-Induced Supraventricular Tachycardia
Exercise-Induced Supraventricular Tachycardia
Only the recovery phase is analyzed. The exercise phase is not analyzed,
because, from a technical point of view, discriminating between heart
rate increase due to exercise versus supraventricular tachycardia is
difficult. But according to Maurer et. al
81
: "tests in patients with known
or suspected heart disease; 14 of the 22 cases of exercise-induced SVT
were observed during recovery". Thus, the majority of exercise-induced
SVT can be detected during recovery.
Exercise induced SVT are possibly predictive of atrial fibrillation. "Risk
of development of lone atrial fibrillation during long-term follow-up in
subjects with exercise-induced supraventricular tachycardia"
81
.
Figure 5.11 Exercise-induced supraventricular tachycardia in recovery phase

Revision C Physician’s Guide 45
2051167-002
Measurement Values: Duke Treadmill Score
Duke Treadmill Score
The Duke Treadmill Score (DTS) is well validated and clinically useful
for risk assessment in patients with either established or suspected
coronary artery disease for whom the desirability of additional testing
must be determined
9,11,12
. One of the major goals of risk assessment is to
identify the low-risk patients for whom no additional testing is required.
Whereas multiple valid strategies for accomplishing this exists, there is
no consensus on the optimal approach. Cost-containment pressures may
indicate the use of exercise testing as the preferred initial strategy in
patients who are able to exercise and have an interpretable
electrocardiogram.
The Duke Treadmill Score is calculated:
In the formula, exercise time is in minutes, deviation is mm, and angina index is 0,1, or 2.
The Duke Treadmill Score (DTS) is a predictor for mortality
31,39,41
. It is
calculated with the exercise duration in minutes, the maximum exercise-
induced ST deviation in mm, and the exercise angina index. The angina
index has a value of 0 if the patient experienced no angina during the
exercise, 1 if the patient experienced no exercise-limiting angina, and 2
if angina was the reason the patient stopped exercising.
The ST deviation is the amount of exercise-induced ST-segment
deviation observed (the largest elevation or depression after resting
changes have been subtracted). The ST segment deviation during
exercise is the horizontal or downsloping depression or elevation
11
.
Leads aVR, aVL and V1 are excluded. If the amount is less than 1mm,
the value is corrected to 0 (ACC/AHA 2002 Guideline Update for
Exercise Testing
39
).
The score normally has a range from -25 (indicating the highest risk) to
+15 (indicating the lowest risk). For classification the score is divided
into three groups: high risk (score < 10), moderate risk (-10 to +4), and
low risk (
≥ +5). The prognosis of 5 year survival (55–99%) and the
average annual mortality (0.2–9%) is calculated on the basis of the
Nomogram of the Prognostic Relations, described in “Prognostic value of
a treadmill exercise score in outpatients with suspected coronary artery
disease”, and on the data from treadmill exercise testing according to the
Bruce protocol (or the equivalent in multiples of resting oxygen
consumption METS from an alternative protocol).
DTS = exercise duration – 5 × ST deviation
– 4 × exercise angina index

46 Physician’s Guide Revision C
2051167-002
Measurement Values: METS
METS
Exercise capacity can be reported in estimated metabolic equivalents
(METS) of exercise. The translation of exercise duration or workload into
METS (oxygen uptake expressed in multiples of basal oxygen uptake,
3.5 O
2
ml/kg per minute) has the advantage of providing a common
measure of performance regardless of the type of exercise test or protocol
used.
MET level or exercise duration achieved on exercise testing is an
important predictor of adverse cardiac events after myocardial
infarction. This observation appears to hold true for tests performed on
the treadmill and the bicycle ergometer. Failure to achieve 5 METS
during treadmill exercise is associated with a worse prognosis
39
.
The METS calculation for treadmill is applied according to the revised
formula presented in the American College of Sports Medicine’s
Guidelines for Exercise Prescription and Testing, 3
rd
edition, 1986
49
. The
equation for Metabolic Equivalents follows:
where grade is given in percent and speed is given in miles per hour.
If speed is given in km/h the formula is modified to:
The METS calculation for bicycle ergometers is applied according to the
formula presented in the European Heart Journal in 1994
50
.
The METS equation for bicycle ergometers follows:
where load is given in watts and weight is given in kilograms.
MET levels are extrapolated between stages of exercise. One minute of a
stage must be completed to obtain full stage MET values
47,51
. At any
point thereafter, full credit is given for the stage.
Depending on age and gender, limits for poor METS, or poor exercise
capacity, can be estimated according to see Table 5.6.
METS
speed 26.8 0.1 1.8 grade 100⁄×+()×× 3.5+
3.5
---------------------------------------------------------------------------------------------------------------------------------=
METS
speed 43.1 0.1 1.8 grade 100⁄×+()×× 3.5+
3.5
---------------------------------------------------------------------------------------------------------------------------------=
METS
12.3 load× 3.5 weight×+
3.5 weight×
-----------------------------------------------------------------------=

Revision C Physician’s Guide 47
2051167-002
Measurement Values: METS
Table 5.6 Estimated METS thresholds for poor exercise capacity
36
The exercise capacity METS is a powerful predictor of mortality. Myers
et. al wrote: “Exercise capacity is a more powerful predictor of mortality
among men than other established risk factors for cardiovascular
disease
89
”. Figure 5.12 shows that in case of a high METS value,
generally accepted risk factors like hypertension, COPD, diabetes,
smoking, BMI, and cholesterol do not cause a higher number of deaths,
or, in other words, do not increase the relative risk beyond 1.0.
Figure 5.12 Relative Risks of Death from any cause among subjects with various risk factors
who achieved a functional capacity of less than 5 METS or 5 to 8 METS, as
compared with subjects whose functional capacity was more than 8 METS.
Numbers in parentheses are 95 percent confidence intervals for the relative
risks. BMI denotes body-mass index, and COPD chronic obstructive pulmonary
disease, Myers et. al.
89
In a treadmill versus bicycle study, Rahimi et.al.
87
found that METS
values from treadmill exercise tests differ from those obtained in bicycle
exercise tests. Most patients achieve higher METS values on treadmills
than on bicycle ergometers.
Age Women Men
< 29 < 7.5 < 8
30–39 < 7 <7.5
40–49 < 6 < 7
50–59 < 5 < 6
60–69 < 4.5 < 5.5
70–79 < 3.5 < 4.5
> 79 < 2.5 < 3.5

48 Physician’s Guide Revision C
2051167-002
Measurement Values: Actual Load
Actual Load
The actual load is an exercise test outcome when bicycle ergometers are
used and it is very similar to bicycle ergometer METS. METS is simply
the actual load corrected by the patient’s weight.
During a bicycle exercise test the load starts with an initial value of
50 watts, for instance, and then increases gradually by 25 watts every
2 minutes, for instance. Immediately after the change to a new stage,
the patient’s actual load is lower than the load because the patient has
to adapt to the new load.
Actual loads are extrapolated between stages of exercise
52
. One minute
of a stage must be completed to obtain the full target load. At any point
thereafter, full credit is given for the stage
47,51
.

Revision C Physician’s Guide 49
2051167-002
Measurement Values: HR Recovery
HR Recovery
The HR recovery value is the decrease in heart rate in the first minute of
recovery (see Figure 5.13). The change to the recovery phase is initiated
by a user action. To avoid a measurement error due to a delayed user
action, the program goes back up to two minutes and uses the time point
of the maximal heart rate as the beginning of the recovery phase.
HR recovery reflects vagal activity. A low value, or a low decrease,
indicates a high risk for overall mortality.
33,39,41
Figure 5.13 Heart rate decrease of more than 25 bpm in the first minute of recovery
The lower the heart rate decrease in the first minute, the higher the risk
(see Figure 5.14).
Figure 5.14 Estimates of the Relative Risk of death within six years according to Heart Rate
Recovery one minute after peak exercise. Dashed lines represent the
95 percent confidence interval.
33
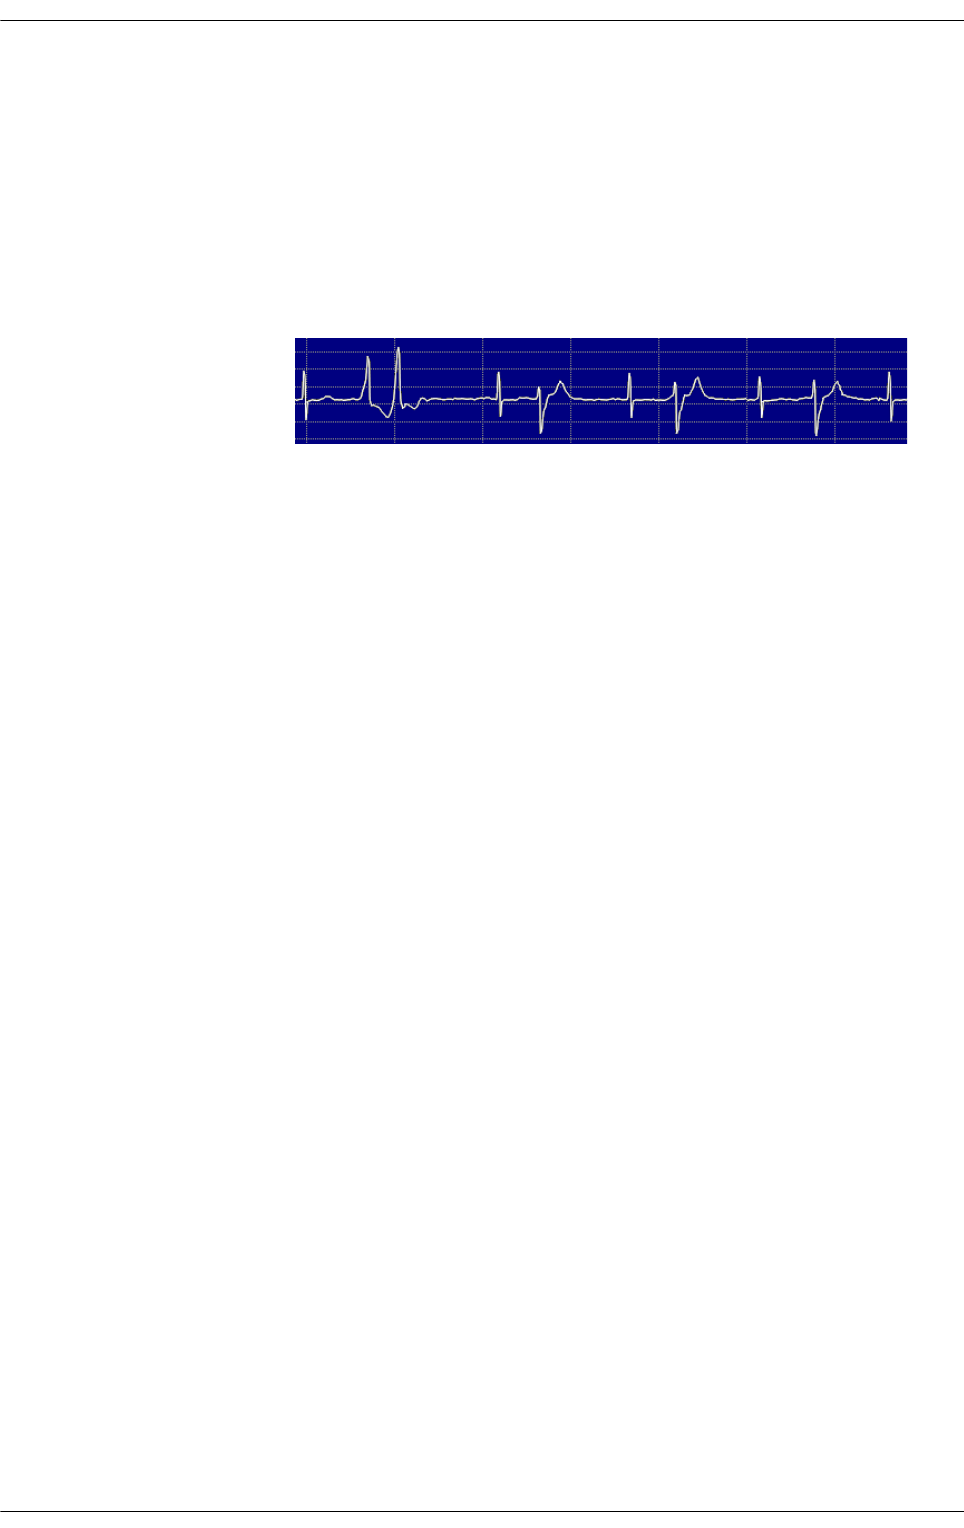
50 Physician’s Guide Revision C
2051167-002
Measurement Values: FVE Recovery
FVE Recovery
Frequent ventricular ectopics in the recovery phase of an exercise test
(FVE recovery) is a good predictor of mortality. Frequent ventricular
ectopy during recovery after exercise is a better predictor of an increased
risk of death than ventricular ectopy occurring only during exercise.
Frequent ventricular ectopics occur with frequent ventricular premature
beats, ventricular couplets, ventricular runs, ventricular bigeminy, and
ventricular tachycardia
34
.
Figure 5.15 Example of frequent ventricular ectopics
FVE recovery values become questionable in patients having frequent
ventricular ectopics in the pretest phase. In those cases the FVE
recovery value is followed by a question mark and is excluded from
mortality prediction
34
.
Note
Ventricular couplets, ventricular runs, ventricular bigeminy and
ventricular tachycardia consist of ventricular ectopic beats.

Revision C Physician’s Guide 51
2051167-002
Measurement Values: Chronotropic Response
Chronotropic Response
A patient’s chronotropic response, or percentage of "HR reserve used", is
calculated using the heart rate at rest (HR
rest
) and at peak exercise
(HR
peak
). The following equation calculates the percentage of HR reserve
used during the exercise test.
%HR
reserve used
= 100 x (HR
peak
- HR
rest
) / (220 - age - HR
rest
)
35
Chronotropic incompetence is identified, when the percentage of HR
reserve used is below 80% (or 62% for patients on ß-blockers).
41
“The HR response to exercise is related to several parameters including
age, resting HR, functional capacity, cardiac function, extent of coronary
artery disease, and the autonomic nervous system”
79
. HR reserve used is
related to the same parameters; however, it has been normalized with
respect to the patient's resting heart rate as well as the expected peak
heart rate for age. Results presented in figure 5.16 demonstrate a
correlation between HR reserve used and coronary artery occlusions
greater than 50%. Others have also found that a low HR reserve used
value is associated with “carotid atherosclerosis, independent of the
established risk factors in healthy men, which could contribute to the
high incidence of cardiovascular diseases in subjects with chronotropic
incompetence.”
84
Still others have found it to be a predictor of acute
myocardial infarction
75
as well as mortality.
35,38,39,41
Thus, there is
significant evidence that HR reserve used is a good indicator of the
extent of atherosclerotic disease. The exercise interpretive program uses
HR reserve used for improving the specificity for the detection of cardiac
ischemia.
Figure 5.16 HR reserve used and the relation to coronary artery stenosis >
50%. ECG data
together with angiographic reference data from FINCAVAS
82
study, Tampere,
Finland, 556 patients.

52 Physician’s Guide Revision C
2051167-002
Measurement Values: Blood Pressure
Blood Pressure
Blood pressure values are received from an external blood pressure
measurement device or must be entered manually via the key pad.
A blood pressure above 250 mmHg at maximum load is considered
abnormal.
39
Double Product / Rate Pressure Product (RPP)
The Double Product is the product of the heart rate and the systolic
blood pressure. Therefore it is also called the Rate Pressure Product
(RPP). For normal exercise response RPP should exceed
20,000 mmHg/min
43
. The Double Product correlates with the myocardial
oxygen consumption (“Exercise and the Heart”, Froelicher
2
)
Heart Rate Values
Maximal Predicted Heart Rate — Upon entering the patient’s age,
GE stress systems automatically calculate the Maximal Predicted Heart
Rate. The system offers two calculation methods:
1. WHO: Max. Predicted HR = 220 – age in years
2. AHA: Max. Predicted HR = 160 (age < 25 years) or
115 (age > 75 years) or
160 – (age – 25) × 45/50 (between 25
and 75 years)
In the event that your laboratory makes use of different predictive
criteria, manual entry of specific values is simply completed during the
entry of demographic data.
Target Heart Rate — GE systems determine the Target Heart Rate as
a user-defined percentage of the Maximal Predicted Heart Rate. While
the default value is set at system initialization, a user may elect to alter
it on a test-to-test basis.
Dynamic ST Scan
Dynamically scan all leads for the “worst case” ST segment depression.
When ST segment depression occurs in another lead that is more severe
than the lead currently shown, the display automatically changes to that
particular lead. The Leads aVR, aVL, and V1 are excluded.

Revision C Physician’s Guide 53
2051167-002
Measurement Values: ST Criteria
ST Criteria
The user has the possibility to enable the continuous monitoring of the
ST segment. When the selected ST criteria are reached, the program
alerts the user and informs of the leads involved. ST criteria can be
defined separately for ST depression and for ST elevation.
ST depression (measured in the post-J point J+x) – A combination of
level and slope values can be entered:
Level values: off, < -0.05, -0.1, -0.15, -0.2, -0.3 mV
Slope values: off, horizontal and down sloping (< 0.5 mV/s),
down sloping (< -1mV/s)
Leads aVR, aVL, and V1 are excluded from monitoring
ST elevation (measured at point J+20 ms) – Only level values can be
entered for ST elevation. Slopes are not considered.
Level values: off, > 0.05, 0.1, 0.15, 0.2, 0.3 mV
Lead aVR is excluded from monitoring
PWC Calculation
The Physical Working Capacity (PWC) is calculated by dividing the
current load (in Watts, on a bicycle ergometer) by the patient’s weight
(in kilogram). PWC 130, PWC 150, and PWC 170 are the PWC values at
a heart rate of 130, 150, and 170 bpm, respectively. A missing PWC
value will be calculated by linear extrapolation when the heart rate has
reached the approximate target heart rate (< 10 bpm). For example, at a
heart rate of 161 bpm the PWC 170 value is calculated by
extrapolation
55
.
Target Load
The Target Load (in Watts, for bicycle ergometers) is calculated on the
basis of the patient’s weight, height, gender and age
52
.
For manual calculation use the following procedure:
1. Obtain the patient’s height and weight.
2. In Figure 5.17, draw a line from the height value to the weight
value.
3. Read the value at the point where this line crosses the body surface
line.

54 Physician’s Guide Revision C
2051167-002
Measurement Values: Target Load
Figure 5.17 Nomogram for the calculation of the body area (according to Du Bois)
4. Together with the patient’s age and gender, use this value to read off
the target load in the appropriate table below (Table 5.7 for female
patients, Table 5.8 for male patients).

Revision C Physician’s Guide 55
2051167-002
Measurement Values: Target Load
Table 5.7 Average expectation values of maximal target load, bicycle, values in Watts,
female patients
Table 5.8 Average expectation values of maximal target load, bicycle, values in Watts,
male patients
According to: Wonisch M, Berent R, Klicpera M, Laimer H, Marko C,
Schwann H, Schmid P. Tabellen zur Berechnung der österreichischen
Solllastformel. Praxisleitlinien Ergometrie, Journal für Kardiologie
2008, 15 (Supplementum A). Extrapolated for ages > 64 years and higher
body surfaces.
20 -24
25 -
29
30 -
34
35 -
39
40 -
44
45 -
49
50 -54
55 -
59
60 -
64
65 -
69
70 -
74
75 -
79
80 -
84
Age /
Body
surface
100 98 95 93 91 89 87 85 83 81 79 77 75
1.2 -
1.29
108 105 103 101 99 96 94 92 90 87 85 83 81
1.3 -
1.39
116 113 111 108 106 103 101 99 96 94 91 89 86
1.4 -
1.49
124 121 118 116 113 111 108 105 103 100 98 95 92
1.5 -
1.59
131 129 126 123 120 118 115 112 109 107 104 101 98
1.6 -
1.69
139 137 134 131 128 125 122 119 116 113 110 107 104
1.7 -
1.79
147 144 141 138 135 132 129 126 123 119 116 113 110
1.8 -
1.89
155 152 149 146 142 139 136 132 129 126 123 119 116
1.9 -
1.99
163 160 156 153 150 146 143 139 136 132 129 125 122
2.0 -
2.09
171 168 164 160 157 153 150 146 142 139 135 131 128
2.1 -
2.19
179 176 172 168 164 160 156 153 149 145 141 137 134
2.2 -
2.29
187 183 179 175 171 167 163 159 155 151 148 144 140
2.3 -
2.39
20 -24
25 -
29
30 -
34
35 -
39
40 -
44
45 -
49
50 -54
55 -
59
60 -
64
65 -
69
70 -
74
75 -
79
80 -
84
Age /
Body
surface
195 188 181 173 166 159 151 144 137 129 122 115 107
1.6 -
1.69
207 199 191 184 176 168 160 153 145 137 129 121 114
1.7 -
1.79
219 211 202 194 186 178 169 161 153 145 136 128 120
1.8 -
1.89
231 222 213 205 196 187 178 170 161 152 144 135 126
1.9 -
1.99
242 233 224 215 206 197 187 178 169 160 151 142 132
2.0 -
2.09
254 245 235 225 216 206 196 187 177 168 158 148 139
2.1 -
2.19
266 256 246 236 226 216 206 195 185 175 165 155 145
2.2 -
2.29
278 267 257 246 236 225 215 204 193 183 172 162 151
2.3 -
2.39
290 279 268 257 246 235 224 213 202 191 180 169 158
2.4 -
2.49
301 290 278 267 256 244 233 221 210 198 187 175 164
2.5 -
2.59
313 301 289 277 265 254 242 230 218 206 194 182 170
2.6 -
2.69
325 313 300 288 275 263 251 238 226 214 201 189 176
2.7 -
2.79

56 Physician’s Guide Revision C
2051167-002
Measurement Values: Target Load
For your notes

Revision C Physician’s Guide 57
2051167-002
6 T-Wave Alternans
(TWA)
Intended Use
The T-Wave alternans analysis is intended to provide the measurements
of the fluctuations of the ST-T-waves. The T-Wave alternans
measurements produced by the T-Wave alternans analysis are intended
to be used by qualified personnel in evaluating the patient in
conjunction with the patient's clinical history, symptoms, other
diagnostic tests, as well as the professional’s clinical judgment.
CAUTION
Results of the T-Wave alternans program must be
reviewed by a qualified physician, and should be used
only as an adjunct to clinical history, symptoms, and the
results of other non-invasive and/or invasive tests.

58 Physician’s Guide Revision C
2051167-002
T-Wave Alternans (TWA): Introduction
Introduction
There is a separate T-Wave Alternans Physician’s Guide
32
available,
which describes in more detail applications of TWA (Stress and Holter),
describes the clinical relevance of TWA analysis, and gives an overview
of relevant publications.
Two main methods exist for detection of T-Wave Alternans: the spectal
and the time domain method. A consensus guideline
83
on both methods
has been published. The time domain method is described here.
Electrical alternans affecting the ST-segment and T-wave is common
among patients at increased risk for ventricular arrhythmias. T-wave
alternans has been described in research literature as “a fluctuation in T
wave morphology occurring on an every-other-beat basis”
27,28,29,77
.
Although the electrical alternans affects both the ST-segment and the T-
wave, henceforward the alternans is referred to as “T-wave alternans”or
TWA. TWA on the electrocardiogram may serve as a noninvasive marker
of vulnerability to ventricular tachyarrhythmias, N Engl J Med 1994;
330:235-41
76
. TWA is known as a marker of cardiac electrical instability
with the potential for arrhythmia risk stratification. An example of this
clinical phenomenon is shown in figure 6.1.
The method for detection of electrical alternans of the ST-segment and
T-wave described here was adopted from Harvard Institutes of
Medicine, Boston. It was invented by Bruce D. Nearing and Richard L.
Verrier and is described in the patent “System and Method for
Quantifying Alternation in an Electrocardiogram Signal”
26
. The software
is capable of detecting morphology fluctuations in the ST-segment and
the T-wave using a method based on current standard computerized
ST-T waveform measurements. Furthermore, the method developed by
Dr. Nearing and Dr. Verrier directly measures the morphologic
fluctuation between odd and even beats in the time domain without
mathematical transformation, which allows visual confirmation of
measurements by an over-reader. The time domain measurement of
TWA is very similar to standard ST measurements, with which
clinicians are familiar.
The T-Wave Alternans (TWA) algorithm is to be used in a hospital,
doctor’s office, or clinic environment by competent health care
professionals for recording ST-T wave morphology fluctuations for
patients who are undergoing cardiovascular disease testing. The T-Wave
alternans analysis only provides the measurements of the fluctuations of
the ST-T-waves.

Revision C Physician’s Guide 59
2051167-002
T-Wave Alternans (TWA): Introduction
Figure 6.1 12-lead ECG from a bicycle exercise test. The amplitude of the ST-T segment
changes from beat to beat in an alternating pattern of higher and lower
ST levels. T-wave alternans of 50 µV is visible in lead V4 (ECGV4), 20 µV in
lead V5 (ECGV5).

60 Physician’s Guide Revision C
2051167-002
T-Wave Alternans (TWA): The TWA Algorithm
The TWA Algorithm
The basis for measuring TWA in the time domain is the formation of a
median PQRST complex for odd and even beats. The median beat
complex is formed in a way to minimize the effects random noise and to
allow comparison of the alternative beat T wave fluctuations by
comparing ST measurements in the ST-T wave on a lead-by-lead basis.
The key processes in this method are signal conditioning to reduce noise
effects, rejection of ectopic beats, and formation of a median PQRST
complex for odd and even beats.
First, the baseline shift of the current PQRST complex of the incoming
ECG is corrected using a cubic spline correction filter (see
Figure 6.2). The cubic spline is calculated on the basis of three points
taken from the isoelectric line preceding three consecutive QRS
complexes, which is an estimate of the baseline shift and is then
subtracted from the ECG. The cubic spline correction has the advantage
of not affecting the low frequency content of the signal, and has therefore
no negative effect on the T-wave alternans. The signal is then filtered
with a 40 Hz low pass filter to reduce high frequency noise produced
by muscle activities.
Additionally, every ECG lead is tested for noisy beats. Noisy beats are
detected/excluded by analyzing the high and middle frequency
content in the ST-T segment, and by analyzing the increase of the
variability of the ST-T segments in the odd beats or the increase of the
variability in the even beats. Noisy beats are excluded from further
processing. Beats excluded due to noise are always excluded in pairs
(e.g., noisy beat and an adjacent beat) to keep the even- odd- sequence.
The noise value is arbitrarily set to a value of 100µV when too many
beats have been excluded and the measurement is questionable.
Figure 6.2 Block diagram of the TWA algorithm
Subsequently, the algorithm separates odd and even incoming beats and
updates the odd median or the even median beat. The odd and even
median beats are updated by either a fixed increment, or a fraction of
the difference between the median template and the incoming beat,

Revision C Physician’s Guide 61
2051167-002
T-Wave Alternans (TWA): The TWA Algorithm
whichever is less. The default update factor is 1/8, but other factors (1/4,
1/16, 1/16 or 1/64) are selectable. These factors will affect the rate at
which the median templates track changes in the incoming signal. A
smaller factor (i.e.,1/64) will track changes slower, but will be more
resistant to noise. The update fraction to select will depend on the
incoming signal.
Then both the odd and even median beats are aligned to a cubic spline
(see section “Cubic Alignment” on page 62). This method has a
tremendous effect in reducing the low frequency noise within the PQRST
cycle, without disturbing the TWA measurement. It is a highly efficient
expansion of the cubic spline correction.
The TWA value is derived by calculating the maximal difference
between odd and even beats in the range of QRS end to T-wave end. A
nonlinear filter is applied to the TWA measurements to compute the
maximal difference in TWA measurements (see section “TWA
Calculation” on page 63). The amount of the maximal difference is the
TWA value. The noise value is an estimated RMS value, calculated from
the differences between even and odd median beat in the isoelectric area
before the QRS complex and after the T-wave.
The TWA value is annotated with a question mark if
the heart rate is above the high heart rate limit (default 125 bpm),
the noise value is greater than the high noise threshold (default
20 µV), and
too many noisy beats have been excluded.
TWA values with a question mark are not used for calculation of a
maximum TWA value, for instance, and are represented by a gap or as a
dashed line in the trend curves.
Ectopic beats can have unpredictable effects on TWA measurements
30
. A
premature beat can affect the T-wave of the preceding complex;
therefore, premature complexes are detected and excluded together with
the preceding beat from incremental updating of odd and even median
beats.
Disconnected leads are also excluded from the TWA measurement
process.

62 Physician’s Guide Revision C
2051167-002
T-Wave Alternans (TWA): Cubic Alignment
Cubic Alignment
Correcting the baseline wander only with the cubic spline previously
described is not sufficient. Since only points in the isoelectric area
preceding the QRS complexes are used, the baseline wander can be
removed only to a limited extent. To further reduce baseline wander,
additional points which are located after the T-end are used for cubic
spline correction. This helps compensate for the differences between the
isoelectric areas in front of the QRS complex and the isoelectric area
between the T-wave and P-wave. The isoelectric area before the QRS
complex is influenced by atrial repolarization of the P-wave. Other
reasons for different amplitudes in both “isoelectric areas” could be a
short PR interval or a merging of P and T-waves. Applying the cubic
spline correction algorithm to points before the QRS complex and also to
points after the T-wave will further enhance removal of artificial
baseline wander, thus improving the measurement quality of T-wave
alternans values.
The cubic alignment algorithm aligns both the even and the odd median
beat to a cubic spline (see Figures 6.3 and 6.4). This cubic spline is
calculated on the basis of three points located exactly between the odd
and even median beats before the P-wave (1), before the QRS complex
(2), and after the T-wave (3). The algorithm is very tolerant to the
location of the points. Its yields very good results, even when atrial
repolarization or a short PR interval hides the isoelectric line before the
QRS complex, or a merging T-wave and P-wave in the other two points
hides the isoelectric T-P-interval.
Figure 6.3 Example of insufficient baseline wander correction. Odd and even median beats
(superimposed) after cubic spline correction. The value of 75 does not represent
T-wave alternans.
1
223

Revision C Physician’s Guide 63
2051167-002
T-Wave Alternans (TWA): TWA Calculation
Figure 6.4 Same odd and even median beats as in figure 6.3, but with alignment to a cubic
spline
TWA Calculation
After the odd and even median beats have been formed, the TWA value
is measured as the maximum difference between the ST-T wave
amplitudes in the two medians. The ST-T wave amplitude used for
comparison is the amplitude in the area between the end of the QRS and
the end of the T wave. When calculating the maximum difference
between odd and even beat in the area between QRS end and T-end,
there is still a possibility that high frequency noise can cause inaccurate
measurement of the TWA value. Therefore, a nonlinear filter is used to
further minimize the effects of high frequency noise. The filter uses a
20 ms window, one each in both the odd and the even median beats, both
starting at QRS end. The minimal difference between the windows is
selected and stored, and then the windows are moved one step towards
the end of the T-wave. Again, the minimal difference is selected and
stored and the windows are moved once more. The procedure is repeated
until the windows reach T-end. Then the maximum of the stored values
is considered the TWA value. The values are stored every 10 s and are,
therefore, available for the TWA trend, for instance.

64 Physician’s Guide Revision C
2051167-002
T-Wave Alternans (TWA): Interpreting/Correcting TWA Results
Interpreting/Correcting TWA Results
The higher the noise and artifact level of the ECG, the more difficult it is
to measure the TWA accurately. Noisy ECG can cause false positive
TWA values even in healthy patients. To assure maximum performance
of the algorithms, follow all the recommended guidelines for operation,
including skin preparation, electrode selection and placement.
Please note that electrode and leadwire movement can cause artifacts
similar to the frequency content of TWA. Securing the leadwires is
strongly recommended.
A positive T-wave alternans is defined when the TWA value reaches/
exceeds an amplitude threshold of 65 µV (for update factor 1/8)
42
.
Figure 6.5 TWA and Noise trend. The peak shortly after 8 minutes is a TWA episode.
Dashed curve segments identify unreliable TWA values. Noise values of 100 µV
indicate that too many beats have been excluded.
The user has the possibility to exclude leads with poor quality. In the
TWA quantitative study
45
it is recommended to use only the precordial
leads for TWA detection. Limb leads should be excluded because of their
high noise levels, which are usually much higher than the noise levels of
the precordial leads. But in the precordial leads only the horizontal
plane can be examined.
From the limb leads, lead II is the best and it is orthogonal to lead V2. It
has on average the highest QRS peak to valley amplitude of all limb
leads (II = 1 mV, I = 0.6 mV, III = 0.7 mV). Lead -aVR is close to II. With
including limb leads II and aVR also the vertical plane can be examined
sufficiently, without the disadvantage of increasing the noise level by
the leads aVL, I, aVF and III. General proposal: exclude leads aVL,
I, aVF and III.
The TWA algorithm does not exclude atrial fibrillation because it is
assumed that TWA in atrial fibrillation patients is highly predictive. But
atrial fibrillation waves can falsify TWA values. When disturbing
fibrillation waves exist, they are mostly apparent in lead V1. For those
cases it is proposed to exclude lead V1.
During treadmill testing it can happen that, due to the patient’s left arm
movement, the electrode V6 is touched continuously. This causes
artifacts, disturbing the TWA measurement. For those cases it is
proposed to exclude lead V6.

Revision C Physician’s Guide 65
2051167-002
T-Wave Alternans (TWA): Interpreting/Correcting TWA Results
The user interface, see Figure 6.6, helps the ECG reader to identify
incorrect TWA episodes. Since the TWA algorithm is a time domain
method, TWA can be visually confirmed, by clicking the TWA value of
interest in the trend curve, shortly before a peak. Therewith the
according odd and even TWA median beats (one upon the other) pop up
and the original ECG is shown for this time point. Based on this
information the reader is able to identify TWA values as erroneous, by
identifying confounding artifacts that are visible in the median beats
and/or original ECG on the same page. In addition the user interface
provides the necessary means for correcting erroneous TWA values.
Figure 6.6 User interface for TWA examination and correction. ECG from the Finnish
Cardiovascular Study (FINCAVAS)
82
, from Tampere University, Tampere,
Finland.
Note
Ischemia induced TWA
28
might be achieved at lower heart rates and,
therefore, at lower noise levels during supine bicycle exercise tests.
The assumption is based on the GE Healthcare stress database: The
same mean ST depression is achieved with upright bicycle exercise
tests at a heart rate of 139 bpm and with supine bicycle exercise
tests at a heart rate of 113 bpm. Besides, Wetherbee et.al.
88
compared treadmill upright and bicycle supine and found higher ST
depressions in supine bicycle exercise tests.

66 Physician’s Guide Revision C
2051167-002
T-Wave Alternans (TWA): TWA Settings
Figure 6.7 GE bicycle ergometer adjustable for supine exercise tests
TWA Settings
Even though the following settings can be changed, it is advised that you
leave them at their default factory settings.
Factor for incremental updating. The factor will affect the rate at
which the median templates track changes in the incoming signal.
1/8 is the default factor, but other factors are available: 1/4, 1/8, 1/16,
and 1/64. With the factor 1/8, the algorithm will track TWA faster,
but will be more susceptible to the effects of noise. A smaller factor
(i.e., 1/64) will track changes slower, but will be more resistant to
noise. Factor 1/8 is the better choice, because therewith the transient
and short TWA episodes can be detected.
Heart rate limit (default 125 bpm). Setting the heart rate limit to a
lower value can help avoid false measurements at high exercise, but
it also reduces the sensitivity of TWA detection.
Noise limit (default 20 µV). Setting the noise limit to lower values
can help to avoid false TWA measurements due to muscle tremor, for
instance. Only high frequency noise can be controlled by this limit. A
lower limit also reduces the sensitivity of TWA detection.

Revision C Physician’s Guide 67
2051167-002
7 Exercise Test
Interpretation (XTI)
Description of the Exercise Test Interpretation
Program
An exercise test on a treadmill or a bicycle delivers a large number of
measurements that are valuable in predicting morbidity/mortality, in
detecting coronary artery disease and in describing the functional
exercise response of a patient. The ideal user would take all available
measurements, compare them with known thresholds, and come to a
complete assessment of the exercise test. However, it is very difficult to
have a comprehensive knowledge of all measurements and their
thresholds, especially of the new ones, namely HR recovery, FVE
recovery, ST/HR hysteresis, and HR reserve used.
The Exercise Test Interpretation (XTI) program compares the exercise
measurements against established thresholds and provides statements
and reasoning texts (explanation of the statements) when thresholds are

68 Physician’s Guide Revision C
2051167-002
Exercise Test Interpretation (XTI): Description of the Exercise Test Interpretation Program
exceeded.
85
Following is an example of a statement with the accompany-
ing reasoning text:
ST/T changes indicative of ischemia
because ST/HR hysteresis > 0.02 mV in [V5 V6] and
HR reserve used < 70%
The XTI program consists of rules and a rule interpreter. The rule
interpreter receives the input data, combines them with the rules, and
creates statements and reasoning texts.
The intention of the statements and reasoning texts is to provide a short,
clear, and accurate overview of the results of an exercise test. If the user
needs detailed information, GE Healthcare stress systems also offer
access to ECG strips, trend curves, median beats, etc.
Figure 7.1 Program structure of the exercise test interpretation. The exercise
measurements and other data are combined with the rules. Then statements
and reasoning texts are created.
The input data are exercise measurements (ST level, ST slope, ST/HR
hysteresis, ST/HR slope, ST/HR index, T-wave alternans value, heart
rate, ventricular ectopic beats per minute, METS, systolic blood
pressure, etc.) and other data (age, gender, medication, angina score,
lead descriptors, stress test device [treadmill or bicycle], etc.).
Measurements are available from the pretest phase, exercise phase,
recovery phase (1 min), recovery phase (3 min), and/or different leads.
ST levels are from all leads and all phases.
Based on the input data and the rules, the rule interpreter creates
statements on risk prediction,
statements on functional response,
statements on ischemia (coronary artery disease), and
technical statements.

Revision C Physician’s Guide 69
2051167-002
Exercise Test Interpretation (XTI): Description of the Exercise Test Interpretation Program
In addition, an overall statement is created, namely:
normal exercise test response, or
borderline exercise test response, or
abnormal exercise test response
undefined exercise test response
Apart from the overall statements, a statement is accompanied by a
reasoning text. In general, the reasoning texts conform to the rules.
Example:
Probably increased risk of malignant arrhythmias .. statement
because T-wave alternans ≥ 65 µV in [V3] .. reasoning text
Medication texts are additional reasoning texts. They appear only with
medication sensitive statements when the according medicament name
was entered.
Example:
Reduced heart rate response .. statement
because HR reserve used < 65% .. reasoning text
Possible cause: Medication beta-blocker .. medication text
A statement does not appear when it is not significant. This means, a
statement is created only if the corresponding rule is true. The
statement “Probably increased risk of malignant arrhythmias,” for
example, appears only when the T-wave alternans value is greater than
or equal to 65 µV.
Technical statements are created to alert the user when the standard
leads are incomplete, when the exercise test is too short, and when the
patient’s age is below 18 years.
The statements and reasoning texts are available in 19 languages:
English, French, German, Italian, Spanish, Portuguese, Swedish,
Hungarian, Polish, Norwegian, Danish, Dutch, Czech, Japanese,
Chinese, Russian, Korean, Finnish and Turkish. If a language is not
available, the texts appear in English.

70 Physician’s Guide Revision C
2051167-002
Exercise Test Interpretation (XTI): Limitations of the Exercise Test Interpretation (XTI) Program
Limitations of the Exercise Test Interpretation (XTI)
Program
XTI was developed for the main indications for exercise testing. These
indications are diagnosis of coronary artery disease, testing
vulnerability to arrhythmia during exercise and recovery, evaluating
exercise capacity, and assessment of a patient’s risk for mortality and
morbidity. The most appropriate test method for XTI is a standard
exercise test up to the patient’s maximal capacity during exercise with a
3-minute recovery phase at a low work load (see figure 7.2).
Figure 7.2 Standard exercise test
Submaximal exercise tests (for post MI patients), a patient’s physical
impairment or poor motivation may reduce sensitivity in ischemia
detection or risk assessment.
If a patient is not motivated, statements, such as “Reduced heart rate
response to exercise” or “Insufficient exercise capacity” might be
presented.
XTI was developed for treadmill and bicycle testing. When performing
pharmacological testing or pharmacological testing combined with
exercise, low METS values occur. A low METS value might suppress
statements on heart rate response and exercise capacity, for instance.
Warning
The results of the Exercise Test Interpretation must be
confirmed by a qualified physician or cardiologist and
should be used only as an adjunct to clinical history,
symptoms, and the results of other non-invasive or
invasive tests.

Revision C Physician’s Guide 71
2051167-002
Exercise Test Interpretation (XTI): Examples for complete interpretation
Examples for complete interpretation
Example 1
Probably increased risk of cardiovascular event
because HR recovery ≤ 12 per minute
Reduced heart rate response to exercise
because HR reserve used < 65%
Insufficient exercise capacity
because metabolic equivalent (METS) < 6
ST/T changes indicative for ischemia
because ST/HR hysteresis > 0.02 mV in [V5] and HR reserve used < 70%
Abnormal exercise test response
Example 2
ST/T changes may be clinically significant
because horizontal or downsloping ST ≤ -0.1 mV in [V5]
Borderline exercise test response
Example 3
Cannot rule out clinically significant ST/T changes
because horizontal or downsloping ST ≤ -0.05 mV in [V5]
Borderline exercise test response
Example 4
Probably normal exercise response

72 Physician’s Guide Revision C
2051167-002
Exercise Test Interpretation (XTI): Rules
Rules
The rules of the Exercise Test Interpretation determine when a certain
interpretive statement is displayed. The rules contain the threshold
values which, when exceeded, trigger the display of the respective
interpretive statement (identified in the following sections in bold).
Most rules combine different measurements. METS is often used for
such combinations. For example, a low METS value with a large TWA
value has been shown to be more predictive of malignant arrhythmias.
46
Rules for risk assessment
Probably increased risk of cardiovascular event:
HR recovery < 12 per minute
Excluded: PVCs in recovery > 3 per minute, age <
20 years
Bicycle: Duke treadmill score (DTS) < -11
Treadmill: Duke treadmill score (DTS) < -10
Excluded: METs <
1.8, age < 40 years
Probably risk of cardiovascular event:
PVCs in recovery > 7 per minute
Bicycle: excluded peak HR <
120
Probably increased risk of malignant arrhythmias:
Incremental update factor 1/4:
T-wave alternans ≥ 85µV
Incremental update factor 1/8:
T-wave alternans ≥ 65µV
Incremental update factor 1/16:
T-wave alternans ≥ 32µV
Incremental update factor 1/32:
T-wave alternans ≥ 16µV
Incremental update factor 1/64:
T-wave alternans ≥ 10µV
Excluded: Leads I, III, aVF, aVL, age <
30
Probably increased risk of stroke/cardiovascular event:
Atrial fibrillation in pretest or exercise phase
Excluded: Age <
50
Exercise-induced bundle branch block:
QRS width at peak exercise > 130 ms and
QRS width at start exercise > 120 ms and
Difference of QRS widths > 30 ms

Revision C Physician’s Guide 73
2051167-002
Exercise Test Interpretation (XTI): Rules
Exercise-induced wide QRS tachycardia:
Wide QRS tachycardia in exercise phase, but not in pretest phase
or
Wide QRS tachycardia in recovery phase, but not in pretest and
exercise phase
Exercise-induced supraventricular tachycardia:
Supraventricular tachycardia in recovery phase
Cannot compute risk:
No rules above are true and METS < 1.8 and METS > 1.0
Rules for functional response assessment
Significantly reduced heart rate response to exercise:
Treadmill: HR reserve used < 65%
Bicycle upright: HR reserve used < 42%
Bicycle semi supine: HR reserve used < 35%
Bicycle supine: HR reserve used < 27%
if beta-blocker, output info text
“Possible cause: medication beta-blocker”
Reduced heart rate response to exercise:
Treadmill: HR reserve used < 80%
Bicycle upright: HR reserve used < 60%
Bicycle semi supine: HR reserve used < 50%
Bicycle supine: HR reserve used < 37%
HR reserve used < 65% and METS > 2
if beta-blocker, output info text
“Possible cause: medication beta-blocker”
The heart rate response rules above are excluded when METS is
between <
1.8 and > 1.0.
Insufficient exercise capacity:
Treadmill:
Female:
METS < 7.5, age ≤ 29 years
METS < 7.0, 30 ≥ age ≤ 39 years
METS < 6.0, 40 ≥ age ≤ 49 years
METS < 5.0, 50 ≥ age ≤ 59 years
METS < 4.5, 60 ≥ age ≤ 69 years

74 Physician’s Guide Revision C
2051167-002
Exercise Test Interpretation (XTI): Rules
METS < 3.5, 70 ≥ age ≤ 79 years
METS < 2.5, age > 79 years
Male:
METS < 8.0, age ≤ 29 years
METS < 7.5, 30 ≥ age ≤ 39 years
METS < 7.0, 40 ≥ age ≤ 49 years
METS < 6.0, 50 ≥ age ≤ 59 years
METS < 5.5, 60 ≥ age ≤ 69 years
METS < 4.5, 70 ≥ age ≤ 79 years
METS < 3.5, age > 79 years
Bicycle:
Female:
METS < 6.0, age ≤ 29 years
METS < 5.6, 30 ≥ age ≤ 39 years
METS < 4.8, 40 ≥ age ≤ 49 years
METS < 4.0, 50 ≥ age ≤ 59 years
METS < 3.6, 60 ≥ age ≤ 69 years
METS < 2.8, 70 ≥ age ≤ 79 years
METS < 2.0, age > 79 years
Male:
METS < 6.4, age ≤ 29 years
METS < 6.0, 30 ≥ age ≤ 39 years
METS < 5.6, 40 ≥ age ≤ 49 years
METS < 4.8, 50 ≥ age ≤ 59 years
METS < 4.4, 60 ≥ age ≤ 69 years
METS < 3.6, 70 ≥ age ≤ 79 years
METS < 2.8, age > 79 years
Reduced exercise capacity:
Treadmill:
Female:
METS < 10.0,age ≤ 29 years
METS < 9.0, 30 ≥ age ≤ 39 years
METS < 8.0, 40 ≥ age ≤ 49 years
METS < 7.0, 50 ≥ age ≤ 59 years
METS < 6.0, 60 ≥ age ≤ 69 years
METS < 4.5, 70 ≥ age ≤ 79 years
METS < 4, age > 79 years
Male:
METS < 11.0, age ≤ 29 years

Revision C Physician’s Guide 75
2051167-002
Exercise Test Interpretation (XTI): Rules
METS < 10.0,30 ≥ age ≤ 39 years
METS < 8.5, 40 ≥ age ≤ 49 years
METS < 8.0, 50 ≥ age ≤ 59 years
METS < 7.0, 60 ≥ age ≤ 69 years
METS < 5.5, 70 ≥ age ≤ 79 years
METS < 4.5, age > 79 years
Bicycle:
Female:
METS < 8.0, age ≤ 29 years
METS < 7.2, 30 ≥ age ≤ 39 years
METS < 6.4, 40 ≥ age ≤ 49 years
METS < 5.6, 50 ≥ age ≤ 59 years
METS < 4.8, 60 ≥ age ≤ 69 years
METS < 3.6, 70 ≥ age ≤ 79 years
METS < 3.2, age > 79 years
Male:
METS < 8.8, age ≤ 29 years
METS < 8.0, 30 ≥ age ≤ 39 years
METS < 6.8, 40 ≥ age ≤ 49 years
METS < 6.4, 50 ≥ age ≤ 59 years
METS < 5.6, 60 ≥ age ≤ 69 years
METS < 4.4, 70 ≥ age ≤ 79 years
METS < 3.6, age > 79 years
The exercise capacity rules above are excluded in case of METS <
1.8.
Abnormal blood pressure response:
Max.syst.blood pressure > 250 mmHg
or
Max. syst. blood pressure > 33.3 kPa
Insufficient rate pressure response:
Bicycle:
Max. Rate Pressure Product (RPP) < 16,000 mmHg per min
or
Max. Rate Pressure Product (RPP) < 2,133 kPa per min
Treadmill:
Max. Rate Pressure Product (RPP) < 20,000 mmHg per min
or
Max. Rate Pressure Product (RPP) < 2,666 kPa per min

76 Physician’s Guide Revision C
2051167-002
Exercise Test Interpretation (XTI): Rules
The rate pressure rules above are excluded in case of METS <
2 and
METS >
1.0.
Cannot compute functional response:
No functional response rules above are true and METS < 1.8 and
METS > 1.0.
Rules for ischemia assessment (coronary artery disease)
The following ischemia rules are applied to leads I, II, III, aVF, V2-V6.
Leads aVR, aVL and V1 are generally excluded. In case of peak exercise
LBBB and LBBB shaped pacemaker stimulation, the rules are also
excluded.
ST/T changes indicative of ischemia:
ST/HR hysteresis > 0.05 mV
The following rules are suppressed when the preceding ischemia rules is
true.
Bicycle:
ST/HR hysteresis > 0.02 mV and METSs > 2.0 and HR reserve used
< 70%
Treadmill:
ST/HR hysteresis > 0.02 mV and METSs > 2.0 and HR reserve used
< 85%
Others:
ST/HR hysteresis > 0.02 mV and METSs < 2.0 and HR reserve used
> 8%
Excluded for the above ischemia rules: Recovery time <
60 s; Leads V2,
V3, and V4 in case of RBBB at peak exercise or 3 min recovery.
The following rules are suppressed when at least one of the preceding
ischemia rules is true.
Bicycle:
ST/HR index > 1.6 mV/bpm and HR reserve used < 70%
Treadmill:
ST/HR index > 1.6 mV/bpm and HR reserve used < 85%
Excluded: Leads V2, V3, and V4 in case of RBBB at peak exercise.

Revision C Physician’s Guide 77
2051167-002
Exercise Test Interpretation (XTI): Rules
ST/T changes may be clinically significant:
ST = ST amplitude at peak exercise
The following rule is suppressed when at least one of the preceding
ischemia rules is true.
ST level ≤ -0.1 mV and ST slope < 0.05 mV/s
Excluded: Leads V2, V3, and V4 in case of RBBB at peak exercise. All
leads in case of LBBB and LBBB shaped pacemaker stimulation at peak
exercise.
The following rule is suppressed when at least one of the preceding ST
segment changes rules is true.
recovery ST ≤ -0.05 mV and recovery ST slope < 0.05 mV/s
Excluded: Leads V2, V3, and V4 in case of RBBB at 3 min recovery. All
leads in case of LBBB and LBBB shaped pacemaker stimulation at 3
min recovery.
Cannot rule out clinically significant ST/T changes:
ST = ST amplitude at peak exercise
The following rules are suppressed when at least one of the ischemia
rules above is true.
ST ≤ -0.05 mV and ST slope < 0.05 mV/s (horizontal)
ST < -0.15 mV and ST slope < 1 mV/s (slightly ascending)
Excluded: Leads V2, V3, and V4 in case of RBBB at peak exercise
The rules above are excluded in case of peak exercise LBBB and LBBB
shaped pacemaker stimulation
Rules for overall statements
Probably normal exercise response:
None of the preceding rules was true.
Borderline exercise response:
The “ST/T changes may be clinically significant”, the “Cannot rule out
clinically significant ST/T changes”, the “Reduced exercise capacity”,
and/or the “Reduced heart rate response to exercise” rules have been
true.
Abnormal exercise response:
At least one of the preceding rules was true, except the rules for the
borderline exercise response
Undefined exercise response:
None of the preceding rules was true and METS <
1.8.

78 Physician’s Guide Revision C
2051167-002
Exercise Test Interpretation (XTI): Rules
Technical Rules
No ECG
Inhibits all other rules
Standard leads incomplete:
One or more missed leads: I, II, III, aVR, aVL, aVF, V1 – V6
Warning! Results are questionable:
Age < 18 years,
or
Exercise_time < 1 min,
or
Recovery time < 1 min,
or
Undefined start exercise.
Caution: Age unknown (45 years assumed)
Age outside range of 0 ... 200 years.
Caution: Gender unknown (male assumed)
Not male or female.

Revision C Physician’s Guide 79
2051167-002
Exercise Test Interpretation (XTI): Graphical XTI output
Graphical XTI output
The graphical XTI output is an easy-to-understand and comprehensive
display of the results of an exercise test. It translates the XTI
statements into positions on a 4x4 matrix. The matrix consists of four
categories
Risk
Functional response
Ischemia (CAD)
Overall
and four exercise response columns, namely:
undefined (grey)
normal (green)
borderline (yellow)
abnormal (red)
Position -33 0 33 67 100%
Figure 7.3 Graphical display of XTI results. Categories are Risk, Functional response,
Ischemia (CAD) and Overall. Exercise test response columns are undefined,
normal, borderline and abnormal.
First the statements are assigned to the 4 categories “Risk”, “Functional
Response”, ”Ischemia (CAD)” and “Overall”. Then the positions of the
corresponding statements are calculated for each category to provide
marker positions. The positions are based on the quality of the
statements in a category. The quality is assessed by the specificity and
reliability of the measurements used in the statement (see Table 7.1). If
more than one statement is true in one category, the statement with the
highest quality defines the final position. If no statement in a category is
true, the marker is positioned in the middle of the green area in this
category or in the middle of grey in case of no ECG or undefined exercise
response (METs value too small).
The main contributor for “Risk” is HR recovery, for “Functional
response” it is METS, and for “Ischemia (CAD)” it is ST/HR hysteresis.
The marker for the “Overall” category row is normally copied from the
category above whose marker is farthest to the right.

80 Physician’s Guide Revision C
2051167-002
Exercise Test Interpretation (XTI): Graphical XTI output
Examples:
The statement “Increased risk of cardiovascular death” is translated
according to its CVD detection quality to the marker position at the
beginning of the red area of the “Risk” row.
The statement “Insufficient exercise capacity” is translated according to
its specificity for overall mortality detection to the marker position in the
middle of the red area of the “Functional response” row.
The statement “ST/T changes indicative of ischemia” with ST/HR
hysteresis > 0.05 mV is translated according to its CAD detection quality
to the marker position in the upper part of the red area of the “Ischemia
(CAD)” row.
Table 7.1 Statements and their positions
By positioning the cursor on a marker, the corresponding statement
and reasoning text are displayed (Figure 7.4). By positioning the
Statement Position in %
Risk
Probably increased risk of cardiovascular event 86
Probably risk of cardiovascular event (FVE recovery) 45
Probably increased risk of malignant arrhythmias 75
Probably increased risk of stroke/cardiovascular event 80
Exercise induced bundle branch block 58
Exercise induced wide QRS tachycardia 55
Exercise induced atrial fibrillation 49
Exercise induced supraventricular tachycardia 52
Undefined risk -17
Probably normal 17
Functional response
Significantly reduced heart rate response to exercise 81
Reduced heart rate response to exercise 50
Insufficient exercise capacity 85
Reduced exercise capacity 55
Abnormal blood pressure response 77
Insufficient rate pressure response 75
Undefined functional response -17
Probably normal 17
Ischemia (CAD)
ST/T changes indicative of ischemia (ST/HR hysteresis) 96
ST/T changes indicative of ischemia (ST/HR hysteresis + HR reserve used) 90
ST/T changes indicative of ischemia (ST/HR index + HR reserve used) 88
ST/T changes may be clinically significant (ST peak ) 50
ST/T changes may be clinically significant (ST recovery) 45
Cannot rule out clinically significant ST/T changes 40
Probably normal 17
Others
Probably normal exercise response 17
Undefined exercise response -17
No ECG -20

Revision C Physician’s Guide 81
2051167-002
Exercise Test Interpretation (XTI): Graphical XTI output
cursor in the “Functional response” category, for instance, all
corresponding statements and reasoning texts of this category are
displayed (Figure 7.5). By positioning the cursor in the “Overall”
category, all statements and reasoning texts are displayed (Figure
7.6).
Figure 7.4 Example: Statement and reasoning texts when cursor is at marker position
"abnormal functional response".
Figure 7.5 Example: Statement and reasoning texts when cursor is in the "Functional
response" position.
Figure 7.6 Example: Statement and reasoning texts when cursor is in the "Overall"
position.

82 Physician’s Guide Revision C
2051167-002
Exercise Test Interpretation (XTI): Graphical XTI output
For your notes

Revision C Physician’s Guide 83
2051167-002
8 Audio Assessment of
Exercise Tests
An audio replay gives a fast overview of an exercise test andprovides a
highly sensibledemonstration of all kind of discontinuities, for instance,
arrhythmias like atrial fibrillation, intermitted supraventricular
tachycardias and intermitted branch bundle blocks. Audio assessment is
intended to be an addition to the visual assessment at the end of an
exercise test. It might help not to overlook important ECG phenomena.
Figure 8.1 Button on CardioSoft/CS for starting and stopping replay of an audio ECG.
During replay all other exercise results can also be examined visually
Fast Assessment
The ECG is reproduced 60 times faster. Therefore an exercise test of
10 min, has a duration of 10 sec, for instance.
The increasing of the frequency corresponds to the exercise phase,
relative to the increasing of the heart rate during exercise. The
subsequent decreasing of the heart rate corresponds to the recovery
phase.
The reproduction is in stereo. The right channel represents lead V2 and
the left channel lead V5.
Based on the recent knowledge about audible ECG, following
abnormalities/discontinuities are assessable:
Absolute arrhythmia (atrial fibrillation)
No HR response to new stage
No steady increasing of HR during exercise
No significant HR increase from rest to peak exercise
No steady decreasing of HR during recovery
No significant decrease of HR during recovery
PVCs in recovery phase
V2 is significantly louder than V5

84 Physician’s Guide Revision C
2051167-002
Audio Assessment of Exercise Tests: Fast Assessment
Examples
To listen to an audio ECG please click on the loudspeaker symbol.
The ECGs and clinical data, are from the Finnish Cardiovascular Study
(FINCAVAS)
82
, from Tampere University, Tampere, Finland.
ra0001 (A0001)
Normal exercise response (patient 67 y, f, 154 cm, 61 kg)
During exercise the heart rate increases normally. The changes of the
stages are clearly audible. A few supraventricular premature beats are
audible during exercise and recovery.
The loudness of V2 is similar to the loudness of V5.
ra1016 (D0018)
Atrial fibrillation. From the beginning there is a grumbling sound,
typical for atrial fibrillation. The sound continues during the whole
exercise test.
The patient (73 y, m, 186 cm, 86 kg) died 3 months after the exercise
test, because of artereosclerotic heart disease (WHO-ICD, I25.1
54
).
The loudness of V2 is higher than the one of V5, reason left bundle
branch block (LBBB).
Figure 8.2 Atrial fibrillation in pretest phase, lead V1
ra0232 (A0233)
Abnormal exercise response. The patient (67 y, m, 161 cm, 68 kg) died
3 months after the exercise test, because of an acute anterior myocardial
infarction (WHO-ICD, I21.0
54
).
During the recovery phase frequent ventricular ectopics and a sudden
increase of heart rate are audible.
The loudness of V2 is higher than the one of V5, due to an old anterior
myocardial infarct.


86 Physician’s Guide Revision C
2051167-002
Audio Assessment of Exercise Tests: Fast Assessment
For your notes

Revision C Physician’s Guide 87
2051167-002
9 Resting ECG
Interpretation and Pre
Test Risk Assessment
With their exercise test systems CASE and CardioSoft/CS, for instance,
GE Healthcare offer tools to support the planning of a patient’s exercise
test procedure. These tools are the 12 SL Resting ECG Interpretation
program, see Physician’s Guide
53
, and the AHA (American Heart
Association) Coronary Heart Disease Risk and Stroke Risk Prediction
program (see below).
AHA Coronary Heart Disease Risk and Stroke Risk
Prediction
A number of risk factors have been found to be associated with a
distinctly enhanced risk of coronary heart disease, including sudden
coronary death, myocardial infarction, and angina pectoris.
Framingham and other epidemiological studies have shown that a
prediction of the incidence rate of coronary heart disease can be made for
groups of persons well in advance of the appearance of symptoms.
Among the risk factors identified are: gender, age, cigarette smoking,
elevated blood pressure, high levels of serum cholesterol, low HDL-
cholesterol (High Density Lipoprotein cholesterol), diabetes, and ECG
abnormalities. These factors are not the only risk factors which might
logically be considered in assessing risk of coronary heart disease, but
they are a set of proven merit which can be readily measured by an office
nurse or a technician without hazard or trauma to the patient.
Coronary Heart Disease Risk Prediction
GE’s Coronary Heart Disease Risk Prediction program is an
implementation of an update of an earlier risk handbook (American
Heart Association. Coronary Risk Handbook. Estimation of Coronary
Heart Disease in Daily Practice, Dallas 1973). It is based on more recent
analysis of the Framingham Heart Study which adds HDL-cholesterol to
the risk profile (Anderson KM, Wilson PDF, Odell PM, Kannell WB. “An
updated Coronary Risk Profile”, Circulation. 1990). In general, the more
risk factors present or the greater the degree of abnormality of any

88 Physician’s Guide Revision C
2051167-002
Resting ECG Interpretation and Pre Test Risk Assessment: AHA Coronary Heart Disease Risk and Stroke Risk Prediction
factor, the greater the risk. The program combines factors and facilitates
assessment of risk for persons whose blood pressure or lipid values may
not reach some arbitrary value set as “abnormal”. By using the program,
fewer persons will be misclassified because they have borderline values
for blood pressure and lipids.
The program provides a synthesis of the information expressed as the
probability of a coronary event within five or ten years of risk factor
assessment. It allows pre-symptomatic assessment of coronary
vulnerability from a coronary risk profile. These results do not
necessarily apply to persons who already have coronary heart disease.
Stroke Risk Prediction
Probability of stroke risk is directly related to the level of risk factor
abnormality, in the case of age and systolic blood pressure, and to the
number of risk factors present, i.e., diabetes mellitus, cigarette smoking,
cardiovascular disease, or electrocardiographic abnormality – left
ventricular hypertrophy or atrial fibrillation. GE’s program combines
the risk factors and makes a quantitative assessment of risk even
though the systolic blood pressure is not high enough to be classified as
definitely in the hypertensive range. Since most hypertensives are in the
borderline category, and this level of blood pressure elevation is clearly
important in stroke incidence, the program takes such intermediate
levels into account.
Stroke risk is somewhat greater for men than women, and the risk
profiles are gender-specific. For men and women a certain systolic blood
pressure level on treatment has a higher risk than the untreated level;
consequently anti-hypertensive treatment is taken into account. For
women an additional interaction adjustment is needed. The relationship
between blood lipids and stroke is clearly different from their key role in
the pathogenesis of coronary heart disease. Total cholesterol and HDL-
cholesterol are important risk factors influencing coronary heart disease
but not stroke.
GE’s program provides a synthesis of the risk factor information for each
gender expressed as the probability of a stroke event in a specified ten
year period. This probability of stroke in a pre-symptomatic individual
does not necessarily apply to persons with prior cerebral infarction or
hemorrhage.

Revision C Physician’s Guide 89
2051167-002
Resting ECG Interpretation and Pre Test Risk Assessment: AHA Coronary Heart Disease Risk and Stroke Risk Prediction
Definitions of Terms and Measurements
Risk factors in the program and their method of measurement are
defined in the following list. If other measurement techniques are used
to determine any of the values, they should be adjusted to those defined.
HDL-Cholesterol High density lipoprotein cholesterol determined after heparin-
manganese precipitation.
Fasting Total
Cholesterol
The physician is advised that the cholesterol values in the
program are based on the Abell-Kendall method. If your
laboratory uses another method, you should determine from the
laboratory director the correction factor necessary to convert to
the Abell-Kendall values. The correction factor varies among
laboratories and must be determined by each laboratory. Most
direct and automated cholesterol determinations give values
five percent to 15 percent above those stated in the tables. Use
of corrected values will affect the precision of risk estimates
made from these tables. Plasma cholesterol measurements
used here are 3 to 4.7 percent lower than serum (Cloey T,
Bachorik PS, Becker D, Finney C, Lowry D, Sigmund W.
“Reevalution of serum-plasma differences in total cholestrol
concentration”. JAMA 1990; 253:2788-2789.).
Systolic Blood
Pressure, BP sys
(mmHg)
Casual pressure taken with the subject seated and resting for
five minutes. An average of two measurements is preferred.
Cigarette Smoking Refers to whether or not an individual is a cigarette smoker or
has quit only within the last 12 months. The program does not
take into account the intensity of the smoking habit and
contrasts only smokers and non-smokers.
Anti-Hypertensensive
Therapy
Currently on anti-hypertensive medication.
Cardiovascular Disease History of myocardial infarction, angina pectoris, coronary
insufficiency, intermittent claudication or congestive failure.
Atrial fibrillation/flutter History of atrial fibrillation/flutter.
Left Ventricular
Hypertrophy by ECG
LVH by ECG consists of finding tall R waves in leads reflecting
potentials from the left ventricle accompanied by ST segment
depression or T wave inversion.

90 Physician’s Guide Revision C
2051167-002
Resting ECG Interpretation and Pre Test Risk Assessment: AHA Coronary Heart Disease Risk and Stroke Risk Prediction
For your notes

Revision C Physician’s Guide 91
2051167-002
10 Exercise Testing
General
Typically an exercise test consists of three phases: the pretest, the
exercise and the recovery phase. Exercise and recovery phase are
important for calculation of the ST/HR hysteresis, for instance. An
exercise test should comprise a pretest phase of one minute or more,
started after successful applied electrodes, an exercise phase, and a
recovery phase of three or more minutes.
In their Exercise Test Systems, GE Healthcare offers tools to support the
planning of the test procedure for a patient. These tools are the 12 SL
Resting ECG Interpretation program, see Physician’s guide
53
, and the
AHA Coronary Heart Disease Risk and Stroke Risk Prediction program,
discussed in chapter 9.
Good electrode application and preparation is essential to receive good
results. A lack of diligence in applying the electrodes causes high noise
and multiple artifacts in the ECG and leads to difficulties in evaluating
an exercise test and their measurements, especially measurements
relating to ST segment and to T-wave alternans. Good skin preparation,
electrode quality, and good placement are important factors for
achieving reliable ECG measurements from the ST/T segment, for
instance, and a reliable Exercise Test Interpretation. To assure
maximum performance, follow all the recommended guidelines for
operation, including skin preparation, electrode selection, and
placement. Please note that electrode and leadwire movement can cause
artifacts similar to the frequency content of the ST/T segment of the
ECG. Securing the leadwires is strongly recommended.

92 Physician’s Guide Revision C
2051167-002
Exercise Testing: Role of Stress Testing in Reducing Cost of Healthcare
Role of Stress Testing in Reducing Cost of
Healthcare
Unnecessary Cath Lab interventions have been identified as one of the
most wasteful expenditures in all of healthcare, worldwide.
91,92
Even
Consumer Reports* has qualified it as being in the top 10.
Fortunately, the stress test is an effective tool that can be used to curb
this waste. Below are a few quotes from the scientific literature that
make this point:
The appropriateness of PCI (percutaneous catheter intervention)
has been challenged because many patients undergoing PCI lack
documentation of ischemia (lack of oxygen) by non-invasive testing
(that is, stress testing) prior to the procedure…”
92
On the basis of the evidence, PCI is considered formally appropriate
only if the patient has (1) ischemic symptoms that might be
improved by revascularization, (2) objective evidence of ischemia by
stress testing, and (3) failed a trial of optimal medical management
because the ischemia is intractable to maximally tolerated doses of
antiischemic medications.”
91
One of the root causes for this waste is the erroneous but, unfortunately,
widespread belief that plaque which significantly narrows a coronary
artery will lead to a heart attack. This belief has resulted in a
preoccupation with these obstructions,
93
causing clinicians to invasively
treat patients , even when they are asymptomatic, by mechanically
dilating these areas and inserting a stent to keep them dilated. This is
despite the preponderance of evidence that heart attacks are caused by
clots which result from plaque rupture (that is, where the plaque loses
its fibrous cap and leaks clot activating factors into the blood that flows
by it).
94
In fact, most heart attacks result from a rupture of a plaque that
is so small it does not elicit any symptoms
95
and is often invisible on the
X-ray images obtained via the Cath Lab.
96-98
Nevertheless, it took the results of the COURAGE trial to put care
providers on notice
99
that mechanical treatments of these obstructions,
even when the narrowing of the coronary artery exceeds 70%, is of little
benefit unless the patient is symptomatic and has been found to have
objective evidence of myocardial ischemia.
100
Given the controversy raised by the COURAGE trial, more investiga-
tions were launched. Meta-analysis of similar trials has also generated a
similar conclusion: “initial stent implantation for stable CAD shows no
evidence of benefit compared with initial medical therapy for prevention
of death, nonfatal MI, unplanned revascularization, or angina.”
101,102
The cost of this inappropriate treatment has been found to be
substantial. Indeed, without documented evidence of ischemia, “the
added cost of PCI was approximately $10,000, without significant gain
in life-years or quality-adjusted life-years. The incremental cost-
effectiveness ratio varied from just over $168,000 to just under $300,000
* Source: http://www.consumerreports.org/cro/2012/08/treatment-traps-
to-avoid/index.htm (Accessed February 13, 2013)

Revision C Physician’s Guide 93
2051167-002
Exercise Testing: Role of Stress Testing in Reducing Cost of Healthcare
per life-year or quality-adjusted life-year with PCI. A large minority of
the distributions found that medical therapy alone offered better
outcome at lower cost. The costs per patient for a significant
improvement in angina frequency, physical limitation, and quality of life
were $154,580, $112,876, and $124,233, respectively.”
103
Estimates of the number of inappropriate treatments are derived from
several sources, which need to be interpreted in relation to the different
reasons for performing PCI. For instance, PCI is also used for treating
heart attacks due to plaque rupture and clotting. However, emergency
Cath Lab procedures (which often include stents) are appropriate. In
fact, these emergency procedures have been found to be very effective
versus the other treatment for a heart attack, namely thrombolytic
therapy.
104-107
Therefore, it is important to separate out procedures
related to emergency PCI (also called primary, direct or immediate)
versus those related to an elective PCI due to stable plaque.
According to the most recent statistics available from the AHA,
95
it is
estimated that 1,133,000 PCI procedures are performed per year in the
United States. In addition, it is estimated that another 1,072,000
inpatient diagnostic cardiac catheterizations were performed.
Diagnostic CATH procedures are also relevant to this issue since it may
be done as an extra step to confirm the presence of a narrowing before
the PCI is actually performed. Nevertheless, it is not evident from these
AHA statistics which of these procedures are due to an elective versus
emergency condition. Instead, we need to turn to cohort studies to
estimate the level of inappropriate treatment.
For example, in the United States, “a retrospective, observational cohort
study using claims data from a 20% random sample of 2004 Medicare
fee-for-service beneficiaries aged 65 years or older who had an elective
PCI (N=23 887)”
108
found that only 44.5% (n=10 629) of these patients
underwent stress testing within the 90 days prior to the elective PCI.
Moreover, “there was wide regional variation among the hospital
referral regions with stress test rates ranging from 22.1% to 70.6%
(national mean, 44.5%; interquartile range, 39.0%-50.9%).”
108
“These
numbers are remarkably similar to those in the United Kingdom, where
43% of patients have stress testing before elective PCI. Furthermore,
revascularization rates also vary widely, with an 83% higher rate in
Florida than in Oregon. Revascularization rates depend on race (28%
variation) and cardiac catheterization rates (68% variation), which in
turn depends on hospital admission rates for CAD as well as the number
of cardiac surgeons and interventionalists in the local population.”
109
In a larger, “multicenter, prospective study of patients within the US
National Cardiovascular Data Registry undergoing PCI between July 1,
2009, and September 30, 2010, at 1,091 US hospitals”,
110
it was found
that of the “500,154 procedures classified”, 144,737 (28.9%) were elective
PCIs.
110
For emergency situations, almost all of the procedures were
appropriate. However, in the non-acute setting, “only 50% of procedures
were classified as appropriate, 38% as uncertain, and 12% as
inappropriate.” Moreover, the majority of these inappropriate
procedures were performed in patients with little to no angina or with
low-risk ischemia on stress testing. The study also found “substantial
hospital variation in the rate of inappropriate PCI”.
110
This led the
authors to conclude that “a better understanding of the clinical settings
in which inappropriate PCIs occur and reduction in their variation
across hospitals should be targets for quality improvement.”
110

94 Physician’s Guide Revision C
2051167-002
Exercise Testing: A Clinical Approach to Exercise Testing
A Clinical Approach to Exercise Testing
Note
This chapter is taken unchanged from the preceding physician’s
guides. It is not completely state of art, especially in risk assessment
and new exercise measurements, but it remains valuable in a lot of
aspects of exercise testing.
Note
The following material in this chapter 10 has been adapted from The
Clinical Approach to Exercise Testing by Stephen P. Glasser, M. D.,
F. A. C. P., F. A. C. C. and Pamela I. Clark.
Reprinted with permission from Lippincott/Harper & Row.
Multistage exercise testing allows the physician to observe a subject’s
physiological adaptation to exercise and, as such, is a valuable extension
of a standard history and physical examination. Exercise testing may be
used to evaluate symptoms such as chest pain, palpitations, dyspnea, or
easy fatigability; estimate the severity of coronary artery disease;
appraise the effects of therapeutic interventions (e.g., surgery, drugs,
physical training). In addition, exercise testing may be an aid in
objectively evaluating an individual’s functional capacity and tolerance
for stress and may help in choosing an appropriate program of physical
conditioning. Finally, recent work suggests that the exercise response is
of considerable predictive value.
56,57,58,59,60
An abnormal ST segment
response alone results in 10 to 15 fold greater likelihood of developing
some coronary event over the ensuing 3 to 5 years, when compared with
a normal ST response. (See Table 10.1)
Table 10.1 Applications of Exercise Testing
It is apparent that the most significant contributions to the safety of
exercise testing are (1) selecting which patients can be safely tested and
(2) deciding when a test should be terminated (that is, the point at which
sufficient diagnostic information has been obtained, but beyond which
further exercise might result in unnecessary risk to the patient). Both of
these require knowledge of the condition of the patient and of the
exercise procedure and is the reason that most clinical laboratories
require that a physician be present to supervise all exercise tests. Two
basic questions must be answered before exercise testing is initiated.
1. Will the results of testing change future medical management?
2. Do the benefits of testing outweigh the possible risks?
1. Evaluate symptoms
2. Estimate severity of disease
3. Appraise therapy
4. Determine exercise tolerance
5. Choose a program of physical conditioning
6. Predict future cardiac events

Revision C Physician’s Guide 95
2051167-002
Exercise Testing: Concepts Useful in Interpreting Exercise Tests
Concepts Useful in Interpreting Exercise Tests
Percentage of Predicted Maximal Heart Rate (MHR) Achieved
Figures for maximal predicted heart rate, age-adjusted, have been
compiled as ”target” heart rates towards which the subject works. (See
Table 10.2
61
) Because the exercise heart rate is a good indicator of heart
work, the percent of MHR at which symptoms of electrocardiographic
changes occur is helpful in assessing a person’s degree of disability. Also,
the percent of maximal predicted heart rate that a patient achieves at
peak exercise can provide an estimate of the efficacy of the test. If a
patient must terminate exercise because of limiting noncardiac factors,
the percent of maximum heart rate achieved may help the examiner to
decide if the cardiovascular system was sufficiently stressed for valid
interpretation of the electrocardiographic response to exercise. Thus, a
test in which the maximal heart rate achieved is less than 85 percent of
predicted, in which no abnormal signs or symptoms occur, cannot be
called a normal test but, instead, must be termed an inconclusive test.
Table 10.2 Predicted Maximal Heart Rates*
Total Exercise Time
The total time a subject spends on the treadmill can be used as an
indicator of functional capacity by comparing that performance with age
and gender-matched individuals. If the protocol is kept constant, serial
studies of an individual patient can be of value in detecting decreasing
tolerance to exercise or in evaluating the effects of treatment.
Total METS
Resting oxygen consumption is approximately 3.5 mm/kg/min, or
1 MET. If a subject is tested to his maximum physiological capacity, he
is presumed to have reached his maximum oxygen consumption
(VO2 max). Increasing physical work loads require increasing amounts
of oxygen or multiples of resting oxygen consumption (eg, 2 METS,
3 METS). Because it is known what number of METS are required for
each stage of a particular protocol, the total METS achieved can be an
indicator of work capacity without the use of more sophisticated
equipment to measure expired gases. The usual work capacities of
different clinical subsets are listed in table 10.3.
62
Age 20-29 30-39 40-49 50-59 60-69
Heart Rate 190 182 179 171 164
(Proceedings of the National Workshop on Exercise in the Prevention, in the Evaluation,
and in the Treatment of Heart Disease. S. C. Med. Assoc., 65:1, 1969)
* Average maximal rates published by 10 investigators.

96 Physician’s Guide Revision C
2051167-002
Exercise Testing: Concepts Useful in Interpreting Exercise Tests
Table 10.3 Work Capacities as they Relate to Clinical Subsets.
Functional Aerobic Impairment
Functional aerobic impairment (FAI) is the difference between the
estimated VO
2
max and that predicted for age and sex
63
and can be
calculated from the equation:
If the Bruce protocol is used and the subject is not allowed to bear any
weight on the handrails, his treadmill duration time can be plotted
against his age on a standard nomogram and his functional aerobic
impairment estimated without actually measuring oxygen uptake (see
Figure 10.1). It must be emphasized that the nomograms shown here are
valid only when used with the Bruce protocol, and the treadmill duration
time must be calculated beginning with stage 1 (not including the lesser
stages, zero or one-half).
Percent of Predicted O
2
Consumption Achieved
Maximum oxygen consumption (VO
2
max) is the highest level of oxygen
uptake that an exercising subject can achieve; that is, if physical work is
further increased, oxygen consumption will fail to increase, having
reached physiologic limits. Oxygen consumption is limited by cardiac
output and by extraction of O
2
by the peripheral tissues (arterio-venous
difference). Predicted VO
2
max for a healthy subject is influenced by age,
gender, body weight, and level of habitual physical activity. The percent
of predicted oxygen consumption that an individual achieves at peak
exercise can be estimated without complicated analysis of expired air.
Since the FAI is the percent reduction in predicted oxygen uptake, the
percent of normal predicted VO
2
max achieved can be estimated by
subtracting the FAI from 100 percent
63
. Thus, an individual with
30 percent FAI would have achieved approximately 70 percent of the
VO
2
max predicted for his age, gender, and level of physical activity. A
person with 0 percent FAI is estimated to have reached 100 percent of
his predicted VO
2
max.
6 METS or less limited patients
7 to 11 METS asymptomatic patients
12 to 15 METS healthy, active men
16 to 20 METS endurance athletes
FAI
predicted VO
2
max observed VO
2
max–()100×
predicted VO
2
max
---------------------------------------------------------------------------------------------------------- -
=

Revision C Physician’s Guide 97
2051167-002
Exercise Testing: Concepts Useful in Interpreting Exercise Tests
Figure 10.1 Nomograms for Assessment of Physiologic Impairment
A
0
1
2
3
4
5
6
7
8
9
10
11
12
13
14
15
C
B
70
70
60
60
50
50
40
40
30
30
20
20
10
10
0
0
-10
-10
-20
-20
SEDENTARY
ACT
IVE
YEARS OF AGE
WOMEN
FUNCTIONAL AEROBIC IMP
AIRMENT %
MINUTES OF DURATION
(Multistage Treadmill Test)
15
20
25
30
35
40
45
50
55
60
65
70
75
A
0
1
2
3
4
5
6
7
8
9
10
11
12
13
14
15
C
B
70
70
60
60
50
50
40
40
30
30
20
20
10
10
0
0
-10
-10
-20
-20
SEDENTARY
ACTIVE
YEARS OF AGE
MEN
FUNCTIONAL AEROBIC IMPAIRMENT %
MINUTES OF DURATION
(Multistage Treadmill Test)
15
20
25
30
35
40
45
50
55
60
65
70
75

98 Physician’s Guide Revision C
2051167-002
Exercise Testing: Concepts Useful in Interpreting Exercise Tests
Symptoms and Signs
The healthy individual should be free of symptoms during submaximal
effort; however, at peak exercise, fatigue, leg weakness, or exhaustion is
expected and may be accompanied by mild dizziness or nausea. Chest
pain, claudication, and extreme dyspnea are abnormal responses.
During dynamic exercise, the working muscle groups generate heat
(muscle temperatures as high as 109 °F (43 °C) have been recorded),
which is dissipated through the skin. Therefore, the normal response to
exercise is increased skin temperature and diaphoresis. Healthy
individuals may develop cool, clammy skin at peak exercise, often
associated with a drop in blood pressure. A similar reaction at less than
maximal exercise is abnormal.
Electrocardiographic Response to Exercise
Peaking of the P wave, shortening of the PR segment, downward
displacement of the PR (PQ) junction, shortening of the QT interval,
decrease in R-wave amplitude, and downward displacement of the
J point are all normal responses to exercise. The duration of normal
J-point depression is generally about 40 milliseconds; significant ST
depression that persists beyond that is abnormal. Elevation of the ST
segment at rest owing to the early repolarization phenomenon that
returns to baseline with exercise is a normal response.
The accepted electrocardiogram baseline for use in the evaluation of
changes in the ST segment is the PR (or PQ) junction, which is
somewhat lower than the usual isoelectric line of a resting ECG tracing.
Heart Rate and Blood Pressure
The expected response of the heart rate to exercise is an increasing rate
with increasing workloads and leveling off at maximal or near maximal
performance. The average change in heart rate from resting to peak
exercise (chronotropic reserve) for the healthy subjects participating in
the Seattle Heart Watch was 108 ±14 beats per minute (bpm) for 2532
men and 94 ±15 bpm for 244 women
64
. Lesser responses of heart rate can
be found in highly trained athletes and infrequently in normal
individuals. In occasional subjects, anxiety at the onset of testing will
cause an initially rapid heart rate that should normalize within the first
3 minutes of exercise, and rise steadily with each increasing workload
thereafter.
Average changes in systolic blood pressure from rest to exercise (intropic
reverse) in the Seattle Heart Watch group was 61 ±19 mmHg for the
healthy men and 42 ±18 mmHg for the healthy women
64
. Some
individuals will show a slight drop in systolic pressure during the first
stage of exercise, again most likely in response to lessening of anxiety
that has produced hypertension at rest. At maximal effort many subjects
show a drop in systolic pressure, which comes up again when exercise is
terminated, then drops slowly toward resting levels during recovery.
Immediately after maximal or near maximal exercise, a drop in blood
pressure is almost uniformly seen and about 10 percent of subjects have

Revision C Physician’s Guide 99
2051167-002
Exercise Testing: Concepts Useful in Interpreting Exercise Tests
a significant drop with resultant dizziness. This is due to cutaneous
vasodilatation and venous pooling and to a decrease in cardiac output.
Following the immediate drop, blood pressure again rises and, then,
gradually declines toward baseline values.
In response to decreasing systemic vascular resistance with exercise, a
small decrease in diastolic blood pressure (further widening the pulse
pressure) is expected in healthy individuals. Elevation of diastolic blood
pressure greater than 10 mmHg during exercise is considered an
abnormal response.
The heart rate blood pressure product (“double product”) can also be
used as a measure of myocardial oxygen demand. It has been shown that
the “triple product” (heart rate x systolic blood pressure x left
ventricular ejection time) correlated closely with VO
2
max, which is not
surprising since these factors are the major determinants of myocardial
oxygen demand. By eliminating left ventricular ejection time, a fair
correlation with VO2 max still exists and eliminates the need for the
additional difficult measurement.

100 Physician’s Guide Revision C
2051167-002
Exercise Testing: Exercise Test Interpretation
Exercise Test Interpretation
When interpreting an exercise test, the ST segment response remains
the most important exercise variable. However, abnormalities in the
other exercise variables should be considered, as well. These include: the
presence or absence of chest pain during testing, the responses of heart
rate and blood pressure, changes in the R-wave amplitude, exercise
duration, exercise-induced cardiac murmurs, gallops, rales, etc, and
exercise arrhythmias. A detailed discussion of all these variables is,
obviously, beyond the scope of this reference guide, and the interested
reader is referred to The Clinical Approach to Exercise Testing
65
or
another text on exercise testing. However, several of these variables,
including the ST segment response to exercise, will be briefly discussed.
The ST Segment Response
Four types of ST segment responses have been associated with coronary
disease (see Figure 10.2). ST segment elevation, slowly upsloping ST
depression, horizontal ST depression, and downsloping ST depression.
For maximal (and most submaximal) exercise tests, ischemic ST
depression of 1.0 millimeter or more at 80 milliseconds after the J point,
in a horizontal or downsloping configuration, is required to call a test
abnormal.
Figure 10.2 The ST Segment Response to Exercise.
However, most authorities agree that the abnormal ST segment
response is actually a continuum. The least abnormal is the marked
J-junction depression, with the ST segment crossing the baseline at 60 to
80 milliseconds. The next is the slowly upsloping, with J-junction
depression and an upsloping ST segment which is still at least
1 millimeter below the baseline at 80 milliseconds. More abnormal still
is frank ST depression, greater than 1 millimeter depressed at
80 milliseconds with a horizontal configuration. And, most markedly
abnormal is the pattern of ST depression with downsloping configura-
tion. Each pattern has been associated with coronary disease to some
degree and, generally, the likelihood of disease can be estimated by the
severity of the pattern, the time of its onset, and the double product at
ABCDEF
A Minimal J-point depression, isoelectric at 80 milliseconds.
B More marked J-point depression, but also isoelectric at 80 milliseconds.
C Slowly upsloping ST depression, remaining depressed more than 1 millimeter at
80 milliseconds.
D Horizontal ST depression.
E Downsloping ST depression.
F ST elevation.

Revision C Physician’s Guide 101
2051167-002
Exercise Testing: Exercise Test Interpretation
which it occurs. A subject who develops slowly upsloping ST depression
at maximum exercise is less likely to have significant disease than is the
person who develops marked downsloping ST depression at a low work-
load. It has become the custom in many laboratories to not label a test as
positive or negative, but to judge it as normal or abnormal and to relate
the test results to the likelihood of the presence or absence of coronary
disease and the severity of that disease. A typical test interpretation
might read: abnormal test, manifest by 3 millimeters downsloping ST
depression at 65 percent of predicted maximal heart rate, associated
with typical angina and a new S3 gallop. The likelihood of coronary dis-
ease is high, and the likelihood of extensive disease is high.
It should be noted that upsloping ST depression may be seen in one lead,
while horizontal or downsloping depression is present in another lead, so
that multiple lead systems may be valuable in increasing the sensitivity
of this response.
Problems in the Interpretation of ST Segment Responses
to Exercise
Many clinical variables affect the diagnostic reliability of exercise ST
segment responses. Some causes of “false positive” ST changes are:
female gender and left bundle branch block (both discussed below), pre-
excitation syndromes, mitral valve prolapse, digitalis, diuretics, and
some psychotropic drugs. Sometimes masking “true positive” ST
responses are: right bundle branch block (also discussed below), left axis
deviation, previous myocardial infarction, and, again, some psychotropic
drugs. The clinician must be familiar with these modifiers of the ST
segment before attempting to interpret the exercise response of any
individual patient.
Women have a higher frequency of “false positive” ST segment responses
for a number of reasons. Foremost is that in the younger age groups the
likelihood of coronary disease in females is low regardless of the
presenting clinical syndrome. This low prevalence of disease suggests
results in a high false-positive rate, in accordance with Bayes’ Theorem.
Then, too, mitral valve prolapse and vasoregulatory asthenia, both
causes of false-positive ST changes, are common in women. Finally, it
must be emphasized that most of the data thus far accumulated about
exercise variables has been gathered from male subjects, and much more
needs to be learned about the responses of women to exercise.
Most investigators agree that left bundle branch block on resting
electrocardiogram totally precludes the reliable assessment of ST
changes with exercise. Orzan et al
66
, for instance, evaluated 57
symptomatic subjects with left bundle branch block, who had multilead
treadmill testing and cardiac catheterization. Exercise-induced ST
changes occurred equally in subjects with and without coronary disease,
irrespective of the criteria chosen. In contrast, Tanaka et al
67
showed no
increase in false-positive ST segment responses in patients with right
bundle branch block, as long as analysis was confined to the lateral
precordial leads (V4, V5, and V6). If ST segment depression occurred in
V1, V2, or V3 only, however, the false-positive rate was high. On the
other hand, there may be a mild reduction in sensitivity when right
bundle branch is present. An additional technical problem may be
encountered when analyzing the ST segment response to exercise in

102 Physician’s Guide Revision C
2051167-002
Exercise Testing: Exercise Test Interpretation
subjects with right bundle branch block. The wide terminal S wave seen
in right bundle branch block may obscure the location of the J point,
rendering quantification of ST segment shifts difficult.
Sensitivity, Specificity, Predictive Value, and Pretest Likelihood
In order to obtain the full benefit of each exercise test, one must have a
thorough knowledge of what is meant by the concepts of sensitivity,
specificity, predictive accuracy (value), and pretest likelihood. The term
“sensitivity” relates to the question: “Given a population with a
particular disease, what percent of patients will have an abnormal test
response?” Specificity relates to the question: “Given a population free
from a particular disease, what percent of patients will have a normal
test response?” Four possibilities exist when a test is performed,
dependent upon whether the individual tested has or does not have the
disease for which he is being tested:
The formulas for calculating the sensitivity and specificity of exercise-
induced depression of the ST segment in subjects with and without
angiographic coronary disease are:
Although useful concepts, these terms are limited clinically by the fact
that they approach the problem in reverse; thus, if we already know that
disease exists, there is little need to perform a diagnostic test.
The real clinical question to be asked is: “Given an ST segment response,
what is the probability that an individual has coronary artery disease?”
This question is addressed by the predictive accuracy (or predictive
value) of a test:
An estimation of the probability of coronary artery disease prior to
exercise stress testing in patients with different chest pain syndromes is
listed in Table 10.4. It shows that the likelihood of obstructive coronary
artery disease in someone with atypical angina is about 50 percent. This
figure is of course subject to modification by the gender, age, associated
risk factors, and the degree to which the angina is atypical. Table 10.4
also shows that a normal exercise test in a patient with atypical chest
Abnormal Test Normal Test
Disease present true positive false negative
Disease absent false positive true negative
sensitivity
true positive
true positive false negative+
---------------------------------------------------------------
=
specificity
true negative
true negative false positive+
---------------------------------------------------------------
=
predicted value of an abnormal test
true positive
true positive false positive+
-------------------------------------------------------------
=
predicted value of a normal test
true negative
true negative false negative+
-----------------------------------------------------------------
=

Revision C Physician’s Guide 103
2051167-002
Exercise Testing: Exercise Test Interpretation
pain results in a post-test likelihood of coronary disease of 25 percent.
Conversely, an abnormal ST segment response to exercise in such a
patient results in a post-test probability of coronary disease of
88 percent. The calculations in table 10.5 use only the ST segment
response to exercise testing. The occurrence of chest pain during
exercise—even though atypical in nature—or any other abnormal signs
and symptoms would, of course, influence the figures. These figures are
derived from Bayes’ Theorem, which permits calculation of the post-test
probability as it relates to the sensitivity and specificity of the particular
test. Thus, the theorem is useful in assessing the possibility that the test
result represents a false-negative or false-positive finding.
Table 10.4 Post-Test Odds and Probabilities of Disease as Related to Pretest Odds and
Probabilities
Other Exercise Variables
Of the many exercise variables, one of the most important responses to
monitor is blood pressure. The normal response of both systolic and
diastolic pressure has been discussed briefly in a previous section.
A small but significant number of patients undergoing exercise develop
hypotension either as an isolated abnormal finding or associated with
other exercise abnormalities. Recognition of this response is important
not only for the safe conduct of the test, but because of the value of the
sign as a predictor of critical narrowing of the coronary arteries. Morris
and McHenry
68
reported exercise-related hypotension in 21 of 272
patients with coronary artery disease. Eighty-eight of the 272 patients
had single vessel disease, none of whom had exercise hypotension.
However, 6 of 96 with double vessel disease and 15 of 88 with triple
vessel disease had the abnormal response. Thus, exercise hypotension
becomes more common as coronary disease increases in severity.
A number of investigators began studying R-wave amplitude changes
during treadmill testing after Bonoris et al
69
reported that a group of
patients with decreased R-wave amplitude after exercising had less
severe coronary artery disease and fewer wall motion abnormalities
when compared to a group of patients who had an increase or no change
in R-wave amplitude. Preliminary studies are conflicting, and it remains
to be seen whether R-wave amplitude changes will prove to be of value
in improving the sensitivity, specificity, or predictive value of the
exercise ECG.
Finally, signs of exercise left ventricular dysfunction (S3 gallop, rales) or
the appearance of ischemic events other than ST segment changes (new
mitral regurgitation murmur, anginal chest pain) during or post-
exercise are valuable in assessing the presence and extent of coronary
disease, and should be sought with each exercise test.
Clinical
Presentation
Pretest
Odds/Prob
Positive Test
Post-Test
Odds/Prob
Negative Test
Post-Test
Odds/Prob
Typical angina 9:1/90% 63:1/98% 9:3/75%
Atypical angina 1:1/50% 7:1/88% 1:3/25%
Asymptomatic 1:9/10% 7:9/44% 1:27/4%

104 Physician’s Guide Revision C
2051167-002
Exercise Testing: Computer Processing of the Exercise ECG
Computer Processing of the Exercise ECG
The interpretation of an exercise test has expanded beyond the
categorization of analysis of the ST segment response using a positive-
negative classification. Despite this fact, the ST segment remains the
most important exercise variable. There are several reasons why
computer-assisted analysis of the exercise ECG is becoming more
important in stress testing. Distortion of the electrocardiographic signal
during maximal exercise due to muscle and respiratory artifact
frequently prevents accurate interpretation of the ST segment response.
The potential that computer processing has for the removal of such
distortions is great (see Figure 10.3). Also, inter- and intra-observer
variations in the interpretation of the ST segment response have been
documented, and computer interpretation removes observer bias from
analysis. Important also is the degree of precision that can be achieved
by computer analysis of the ST segment slope. Classification of normal
and abnormal ECG responses during exercise depend on the accuracy of
the measurements used (that is, ST or J amplitude, ST slope or ST area).
Simoons et al
70
have noted that the reliability of such measurements
depends on the algorithms for location of the baseline and of the ST
segment itself, usually accomplished by utilizing the QRS complex in
some manner as a fiducial (or reference) point. Comparisons of the
results of different algorithms for detecting the onset and end of the QRS
complex, however, have shown that various programs differ
considerably. Therefore, one should always check the computer
determined QRS onset and offset points before reviewing the ST
segment measurements.
Real time Computer processed
Figure 10.3 Exercise ECG Tracings of a Patient at Maximal Exertion
Simoons et al
71
have also recently presented a set of recommendations
for the application of computers to diagnostic electrocardiography. (Refer
to Table 10.5) They suggest that the adoption of these guidelines can
result in an increase in sensitivity of 10 to 45 percent with only a small
loss of specificity (3 to 10 percent). Finally, future computer applications
will allow the assessment of other exercise variables and pretest and
post-test probabilities with a greater reliability than is now available.

Revision C Physician’s Guide 105
2051167-002
Exercise Testing: Computer Processing of the Exercise ECG
Table 10.5 Recommendations for Computer-Assisted Interpretation of the Exercise
Electrocardiogram
Hardware
Adequate frequency response and safety
Sample frequency 250 Hz or greater
User interface in the exercise laboratory simple to operate
Signal conditioning
Computation of averaged or median representative beats after rejection of premature
complexes and other beats with an abnormal configuration
Warning messages when signal quality is poor
Measurements
Definitions of onset and end of QRS complex, preferably in multiple, simultaneously
recorded leads
Measurements of both ST depression and ST elevation
Diagnostic classification
Special measures should be included to prevent errors in classification due to
excessive noise or baseline shift, as well as certain conditions that may interfere with
the measurement program, such as intraventricular conduction delay
The whole system should be tested in a series of patients with independently
documented presence or absence of disease
Report
Graphic representation of representative ECG complexes should be included with
marks that indicate fiducial points from which the measurements have been taken
Graphic or numerical output of the measurements should be available in addition to
diagnostic statements

106 Physician’s Guide Revision C
2051167-002
Exercise Testing: Computer Processing of the Exercise ECG
For your notes

Revision C Physician’s Guide 107
2051167-002
11 Reports
In-Test and Final Reports
GE systems offer a multitude of reports during (in-test reports) and at
the end (final reports) of the stress test. These reports are the rhythm
report, the comparative medians report, the 4 x 2.5 format 12-lead
report, etc. For descriptions of the reports, consult your operator’s
manual. For two of these reports, some brief additional information
follows:
Linked Medians report – consists of joined or “linked” median
complexes for each lead. The medians are linked to match the current
heart rate. The result is a noise-free and clean ECG strip, readable as
usual. Since the ECG is artificially sequenced with median beats,
rhythm changes, and ectopic beats, for example, are not visible.
Therefore a real-time, one-channel rhythm strip is also provided.
Vector Loops report – Report showing X,Y,Z lead plots and three-
plane vector loops of horizontal, frontal, and sagittal planes using the
Frank X, Y, Z lead set. If the Frank lead set is not applied, GE’s stress
systems derive the X,Y,Z leads from the standard leads using the
Inverse Dower Matrix described in “Vectorcardiogram synthesized from
a 12-lead ECG: Superiority of the inverse dower matrix”.
78

108 Physician’s Guide Revision C
2051167-002
Reports: In-Test and Final Reports
For your notes

Revision C Physician’s Guide 109
2051167-002
12 Glossary
Abbreviations and Definitions
12SL
An acronym for GE’s 12 simultaneous lead resting ECG analysis
program.
Acquisition module
The unit which serves as the interface between the patient and the
stress system. Electrodes from the patient connect to the acquisition
module, and a cable connects the unit to the system.
Actual load
The patient’s effort to achieve the target load.
AFIB
Atrial fibrillation.
Algorithm
A step-by-step set of instructions for processing data.
Alignment
The purpose of alignment is to adjust the incoming beat to fit with the
median template with respect to the slope characteristics of the
waveform.
Arithmetic averaging
A signal-processing technique that aligns a set number of consecutive
beats and divides them by the number of beats included in the
alignment array yielding a mean QRS.
Artifact
Locally restricted noise or artificial complex not originated by the heart
activity.
Audio assessment
Possibility of GE exercise systems to replay ECG for audible assessment
of exercise tests.

110 Physician’s Guide Revision C
2051167-002
Glossary: Abbreviations and Definitions
Auto relearn
The process whereby GE stress systems detect a significant change in
QRS morphology and relearn both the median complex and the ST
segment measurement points.
BBB
Bundle branch block
Band pass filter
A filter that permits the passage of a specific frequency range (band).
For example, a 5 to 30-Hz band-pass filter would eliminate all
frequencies below 5 Hz and greater than 30 Hz.
Baseline roll filter
Filters on the low end of the ECG frequency spectrum (less than 1 Hz)
whose purpose is to eliminate extraneous baseline drift. AHA
requirements for diagnostic ECG equipment dictate that this filter be no
more aggressive than a 0.05 Hz high-pass filter.
BP
Here, systolic blood pressure.
Bpm
Beats per minute.
Common mode noise
ECG interference generated from environmental equipment that is
common to all leads.
Common mode rejection ratio
A proportion indicating the system’s ability to ward off the effects of
environmental electrical noise.
Correlation
Correlation matches the shape (slope characteristics) of the incoming
beat to the median template. Where there is a sufficient correlation, the
incremental update of the median template proceeds.
Chronotropic response
See “HR reserve used”.
Cubic spline
A third-order polynomial technique for control of baseline drift employed
as an alternative to aggressive, potentially distorting filterings.
Cyclic artifacts
Artifacts caused by footfalls during treadmill testing or pedaling during
bicycle testing.

Revision C Physician’s Guide 111
2051167-002
Glossary: Abbreviations and Definitions
Double Product
The product of heart rate and systolic blood pressure, also called Rate
Pressure Product (RPP).
DTS
Duke Treadmill Score, calculated with test time, ST deviation, and
angina. Risk predictor.
Dominant template
See “Median complex”.
Dynamic ST scan
The leads are scanned dynamically for the worst case ST depression.
E point
The isoelectric reference point set in the PR segment.
ESC
Ventricular escape beat.
Exercise capacity
Ability of a patient to exercise.
Exercise test
Application of physical stress to a patient using treadmill, bicycle, drugs,
etc.
Exercise Test Interpretation
Part of HEART-Exercise software package. Translates measurements,
thresholds, and patient data to interpretation and reasoning texts.
Fiducial point
A landmark or reference point.
Filtering
With respect to electrocardiography, filtering refers to the extraction
and elimination of certain frequencies from the raw signal.
FRF algorithm
Algorithm for reducing the artifacts in the ECG with much less
distortion of the QRS complexes.
FVE recovery
Ventricular ectopics per minute in recovery phase.
Graphical XTI output
Graphical expression of exercise test results.

112 Physician’s Guide Revision C
2051167-002
Glossary: Abbreviations and Definitions
Hertz (Hz)
The labeling unit of a frequency in terms of cycles per second. Also
abbreviated as cps.
HEART-Exercise
The name for GE’s 12 simultaneous lead exercise ECG analysis
program. Contains the functionality described in this physician’s guide.
HR reserve used
Patient’s heart rate response to exercise calculated as
(HR
peak
- HR
resting
)/(220 - age - HR
resting
).
HR recovery
Decrease of the heart rate in first minute of recovery.
High-pass filter
A filter that permits the passage of frequencies above a specific value.
For example, a 0.01 Hz high-pass filter allows the passage of all
frequencies above 0.01 Hz while removing all those below.
Incremental updating
Signal-processing technique used by GE stress systems resulting in a
median complex. Successfully correlated incoming beats update the
median template by the smaller fixed increment or a fraction of the
difference between the template and the incoming beat.
Intelligent Lead Switch
Automatic selection of the best leads for QRS detection.
J point
The end of the QRS complex as delineated by the location where the last
steep slopes of depolarization are replaced by the more or less flat ST
segment.
LBBB
Left Bundle Branch Block.
Low-end filter
The high-pass filter that works on the lower end of the frequency
spectrum.
Low-pass filter
A filter that permits the passage of frequencies below a specific value.
For example, a 40-Hz low-pass filter allows the passage of all
frequencies below 40 Hz while removing all those above.
Mean complex
The resultant complex from the arithmetic averaging technique of signal
processing.

Revision C Physician’s Guide 113
2051167-002
Glossary: Abbreviations and Definitions
Median complex
The resultant complex from the incremental updating technique of
signal processing.
Median template
See “Median complex”.
Median update
See “Incremental updating”.
MET
Metabolic equivalent or exercise capacity. METS is the plural.
Multi-beat event
Consecutive single-beat events. For example, a bigeminy, consisting of
pairs of PVCs and normal beats.
Noise
All kinds of signal, disturbing the ECG, mostly caused by muscle
activities.
Noise filter
A user-selectable low-pass filter that can be set at either 20, 40 or
100 Hz.
Pace enhance
Improved display of pace pulses.
Post-J measurement point (J+x)
Point for measurement of the ST level.
PSVC
Premature Supraventricular Complex.
PVC
Premature ventricular complex
PWC
Physical working capacity. Load in watts devided by patient’s weight.
PWC 130, PWC 150, PWC 170
Physical working capacity at heart rate 130 bpm, 150 bpm, or 170 bpm.
QRS detection
The purpose of this step is to detect electrical impulses associated with a
heart beat of sinus or ectopic origin.
QRS offset
See “J point”.

114 Physician’s Guide Revision C
2051167-002
Glossary: Abbreviations and Definitions
QRS onset
First deflection of the QRS complex of all leads.
Relearn
If GE stress systems detect a significant change in QRS morphology or a
specific user command, then the incoming complex is established as the
dominant template and the ST segment measurement points are
recalculated.
Risk prediction
Prediction of morbidity, overall mortality, cardiovascular death, acute
myocardial infarction and/or malignant arrhythmias, based on data
obtained by exercise testing.
RPP (Rate Pressure Product)
See “Double Product”.
RR interval
Time distance to precedent beat.
Rule
Provides an interpretation by combining terms, consisting of
measurements and thresholds.
Single-beat event
Events dedicated to single complexes. Such events are PVC or SVPC, for
instance.
Signal acquisition
The process of obtaining the analog ECG signal from the patient and
converting it into a digital format. In GE systems this process is
performed in the acquisition module.
ST depression or ST segment depression
ST segment which is below the isoelectric line.
SVT
Supraventricular tachycardia
Signal conditioning
An enhancement of the ECG signal whose purpose is to present clean
waveform data by improving the signal-to-noise ratio. See also
“Filtering” and “Signal processing”.
Signal processing
The employment of mathematical algorithms to improve the ECG
presentation. See also “Incremental updating” and “Arithmetic
averaging”.

Revision C Physician’s Guide 115
2051167-002
Glossary: Abbreviations and Definitions
Signal-to-noise ratio
The amplitude of the ECG signal in proportion to the amplitude of the
noise in the signal.
Stress test
See “Exercise test”.
ST criteria
Possibility to set ST criteria for continuous monitoring of the
ST segment.
ST/HR hysteresis
Value derived from ST levels from exercise and recovery phase.
ST/HR index
Calculated by dividing the change of the ST depression from baseline to
maximum exercise by the change in heart rate over the same time
period.
ST/HR slope
Slope of a regression line through ST/HR points, beginning at peak
exercise and extending backward through at least three points until
significance is obtained.
ST Index
Value calculated with ST depression and ST down slope.
ST Integral
Area of ST segment.
ST level
Difference between an amplitude in the ST segment and the amplitude
before the QRS onset.
ST segment
ECG segment from QRS offset to T-wave onset.
ST slope
Slope of the ST segment.
Template
See “Median complex”.
Target load
Load in Watts the patient should achieve on bicycle.
TWA
T-wave alternans. Alternating shapes of the ST/T segments.


Revision C Physician’s Guide 117
2051167-002
13 Bibliography
Relevant Literature
1 American Heart Associations Committee on Electrocardiography: Recommendations
for standardization of leads and specifications for instruments in ECG/VCG.
Circulation 52:11, 1975.
2 Froelicher VF, Myers J, Follansbee WP, Labovitz AJ: Exercise and the Heart –
3
rd
Edition.1993 by Mosby – Year Book, Inc.
3 Taback, L., et al: Digital recording of electrocardiographic data for analysis by digital
computer. Medical Electronics. 6:167, 1959.
4 Blackburn H (ed): Measurement in Exercise Electrocardiography: The Ernst
Simonson Conference. Charles C. Thomas Publisher, Springfield 1969.
5 Berson AS, Pipberger: The low-frequency response of electrocardiographs, a
frequent source of recording errors. American Heart Journal. 71:779, 1966.
6 Ellestad M.H.: Stress Testing: Principles and Practice – 4
rd
Edition . F.A. Davis
Company, Philadelphia, 1996.
7 Meyer CR, Keiser HN: Electrocardiogram baseline noise estimation and removal
using cubic-splines and state-space computation techniques. Computers and
Biomedical Research 10:459, 1977.
8 Tayler, D.I., Vincent, R: Artifactual ST segment abnormalities due to
electrocardiographic design. British Heart Journal, 554:121, 1985.
9 Daniel B.Mark. An overview of risk assessment in coronary artery disease. The
American Journal of Cardiology, 73:19B–25B, March 1994.
10 P.M.Rautaharju, J.W.Warren, and H.P.Calhoun, Estimation of qt prolongation,
Journal of Electrocardiology, 23:111–117, April 1990.
11 Daniel.B.Mark, Linda Shaw, F.E.Harrell, M.A.Hlatky, K.L.Lee,J.R.Bengton,
C.B.McCants, R.M.Califf, and D.B.Pryor. Prognostic value of a treadmill exercise
score in outpatients with suspected coronaryartery disease. The New England
Journal of Medicine,325(12):849–853, Sept. 1991.
12 Daniel.B.Mark, M.A.Hlatky, F.E.Harrell, K.L.Lee, J.R.Bengton, R.M.Califf, and
D.B.Pryor. Exercise treadmill score for predicting prognosis in coronary artery
disease. Annals of Internal Medicine, 106(6):793–800, June 1987.
13 Willi.Kaiser and Martin Findeis. Artifact Processing during Exercise Testing, Journal
of Electrocardiology, Vol 32, Supplement,1999
14 Willi Kaiser and Martin Findeis, Novel Signal Processing Methods for Exercise ECG,
International Journal of Bioelectromagnetism, No.1, Vol.2, 2000.
15 Ameisen O, Okin PM, Devereux RB, Hochreiter C, Miller DH, Zullo MA, Borer JS,
Kligfield P: Predictive value and limitations of ST/HR slope. Br Heart J 1985; 53:547–
551.
16 Elamin MS, Mary DASG, Smith DR, Linden RJ: Prediction of severity of coronary
artery disease using slope of submaximal ST segment/heart rate relationship.
Cardiovasc Res 1980; 14:681–691.

118 Physician’s Guide Revision C
2051167-002
Bibliography: Relevant Literature
17 Elamin MS, Boyle R, Kardash MM, Smith DR, Stoker JB, Whitaker W, Mary DASG,
Linden RJ: Accurate detection of coronary heart disease by new exercise test. Br
Heart J 1982; 48:311–320.
18 Kligfield P, Ameisen O, Okin PM: Heart Rate Adjustment of ST Segment Depression
for Improved Detection of Coronary Artery Disease. Circulation 1989; 79:245–255.
19 Kligfield P, Okin PM, Ameisen O, Wallis J, Borer JS: Correlation of the exercise
ST/HR slope with anatomic and radionuclide cineangiographic findings in stable
angina pectoris. Am J Cardiol 1985: 56:418–421.
20 Kligfield P, Okin PM, Ameisen O, Borer JS: Evaluation of coronary artery disease by
an improved method of exercise electrocardiography: The ST segment/heart rate
slope. Am Heart J 1986; 112:589–598.
21 Okin PM, Kligfield P, Ameisen O, Goldberg HL, Borer JS: Improved accuracy of the
exercise electrocardiogram: Identification of three-vessel coronary disease in stable
angina pectoris by analysis of peak rate related changes in ST segments. Am J
Cardiol 1985; 55:271–276.
22 Okin PM, Ameisen O, Kligfield P: A modified treadmill exercise protocol for computer-
assisted analysis of the ST segment/heart rate slope: Methods and reproducibility. J
Electrocardiol 1986; 19:311–318.
23 Okin PM, Kligfield P, Ameisen O, Goldberg HL, Borer JS: Identification of
anatomically extensive coronary artery disease by the exercise ST segment/heart
rate slope. Am Heart J 1988; 115:1002–1012.
24 Paul Kligfield, Principles of simple heart rate adjustment
of ST segment depression during exercise electrocardiography, Cardiology Journal
2008, Vol. 15, No. 2, pp. 194–200.
25 Okin PM, Ameisen O, and Kligfield P. Recovery-Phase Patterns of ST Segment
Depression in the Heart Rate Domain. Identification of Coronary Artery Disease by
the Rate-Recovery Loop.Circulation Vol 80, No 3, September 1989
26 Bruce D.Nearing and Richard L.Verrier. System and method for quantifying
alternation in an electrocardiogram signal. Patent No.: US 6,169,919 B1, Jan. 2,
2001.
27 Antonis A. Armoundas and Richard J.Cohen. Clinical utility of t-wave
alternans.Cardiac Electrophysiology Review, 3:390–394, 1997.
28 Bruce D.Nearing and Richard L.Verrier. Modified moving average analysis of T-wave
alternans to predict ventricular fibrillation with high accuracy. J. Appl Physiol. Vol 92,
541–549, 200.
29 Paul Albrecht, Jeff Arnold, Srivat Krishnamachari, Richard Cohen. Exercise
Recordings for the Detection of T Wave Alternans. J. Electrocardiography, Vol 29,
Supplement, 46–51.
30 Daniel M. Bloomfield, Stefan H. Hohnloser, Richard Cohen. Interpretation and
Classification of Microvolt T Wave Alternans Tests. J. of Cardiovascular
Electrophysiology, Vol 13, No 5, 502–514.
31 D.B.Mark, L. Shaw, F.E.Harrell, M.A.Hlatky, K.L.Lee, J.R.Bengton, C.B.McCants,
R.M.Califf, and D.B.Pryor. Prognostic value of a treadmill exercise score in
outpatients with suspected coronary artery disease. N Engl J Med 1991; 325:849-
53.
32 T-Wave Alternans Physician’s Guide, 2020044-067 Revision C, © 2008–2009
General Electric Company.
33 C.R.Cole, E.H.Blackstone, F.J.Pashkow, C.E.Snader, and M.S.Lauer, Heart-Rate
Recovery Immediately After Exercise As a Predictor of Mortality, N Engl J Med 1999;
341:1351-7.
34 J.P.Frolkis, C.E.Pothier, E.H.Blackstone, and M.S.Lauer, Frequent Ventricular
Ectopy after Exercise as a Predictor of Death, N Engl J Med 2003; 348:781-90.

Revision C Physician’s Guide 119
2051167-002
Bibliography: Relevant Literature
35 M.S.Lauer, Exercise Testing, Part 1: Looking Beyond the ST Segment. Cardiology
Rounds, Brigham and Women’s Hospital, Boston, Massachusetts, May 2002 Volume
6, Issue 5.
36 M.S.Lauer, Exercise Testing, Part 2: The Value of Heart Rate Recovery. Cardiology
Rounds, Brigham and Women’s Hospital, Boston, Massachusetts, May 2002 Volume
6, Issue 6.
37 R.Lehtinen, H.Sievänen, J.Viik, V.Turjanmaa, K Niemelä and J.Malmivuo. Accurate
Detection of Coronary Artery Disease by Integrated Analysis of the ST-Segment
Depression/Heart Rate Patterns During Exercise and Recovery Phases of the
Exercise Electrocardiography Test. Am J Cardiol 1996; 78:1002–1006.
38 Lauer MS, Okin PM, Larson MG, Evans JC, Levy D. Impaired heart rate response to
graded exercise. Prognostic implications of chronotropic incompetence in the
Framingham Heart Study. Circulation 1996; 93:1520-6.
39 Gibbons RJ, Balady GJ, Bricker JT, Chaitman BR, Fletcher GF, Froelicher VF, Mark
DB, McCallister BD, Mooss AN, O’Reilly MG, Winters WL Jr. ACC/AHA 2002
guideline update for exercise testing: a report of the American College of
Cardiology/American Heart Association Task Force on Practice Guidelines
(Committee on Exercise Testing). 2002.
40 Rami Lehtinen, Jari Viik, Willi Kaiser, Mari Niemi, Tiit Kööbi, Kari Niemelä, Väinö
Turjanmaa: Accurate Detection of Coronary Artery Disease by ST-segment/Heart
Rate Hysteresis of the Exercise Electrocardiography Test. Journal of the American
College of Cardiology, vol 45, issue 3, suppl 1, page A158.
41 Paul Kligfield and Michael S. Lauer: Exercise Electrocardiogram Testing: Beyond the
ST Segment. Circulation 2006; 114; 2070–2082.
42 Tuomo Nieminen, Terho Lehtimäki, Jari Viik, Rami Lehtinen, Kjell Nikus, Tiit Kööbi,
Kari Niemelä, Väinö Turjanmaa, Willi Kaiser, Heini Huhtala, Richard L. Verrier, Heikki
Huikuri, Mika Kähönen: T-wave alternans predicts mortality in a population
undergoing clinically indicated exercise test, European Heart Journal,
doi:10.1093/eurheartj/ehm271, July 25, 2007.
43 David A. Driggers; David Marchant, Maximizing the exercise stress test, Critical
factors that enhance its validity, VOL 105 / NO 5 / MAY 1, 1999 / POSTGRADUATE
MEDICINE Table 3.
44 Svart K, et al, Exercise electrocardiography detection of coronary artery disease by
ST-segment depression/heart rate hysteresis in women: The Finnish Cardiovascular
Study, Int J Cardiol (2008), doi:10.1016/j.ijcard.2008.11.038.
45 Mikko Minkkinen, et. al., Enhanced Predictive Power of Quantitative TWA during
Routine Exercise Testing in the Finnish Cardiovascular Study, J Cardiovasc
Electrophysiol, Vol. 20, pp. 1–8.
46 Minkkinen, Mikko, Nieminen, Tuomo, Verrier, Richard L., Leino, Johanna, Lehtimäki,
Terho, Viik, Jari, Lehtinen,Rami, Nikus, Kjell, Kööbi, Tiit, Turjanmaa, Väinö and
Kähönen, Mika (2009) ‘Impaired exercise capacity predicts sudden cardiac death in a
low-risk population: enhanced specificity with heightened T-wave alternans’, Annals
of Medicin: DOI: 10.1080/07853890902802971
47 Wassermann et. al., Principles of Exercise Testing and Interpretation, DSc.
Philadelphia, PA: Lippincott Williams & Wilkins, 2005.
48 Testing and reporting performance results of cardiac rhythm and ST segment
measurement algorithms. ANSI/AAMI EC57:1998/(R)2003.
49 Guidelines for Exercise Prescription and Testing, 3rd edition, American College of
Sports Medicine’s 1986.
50 D.J.Mertens et.al, A simple formula for the estimation of maximal oxygen intake
during cycle ergometry. European Heart Journal (1994) 15, 1247–1251.

120 Physician’s Guide Revision C
2051167-002
Bibliography: Relevant Literature
51 Whipp Bj, Mahler M. Dynamics of pulmonary gas exchange during exercise. In:
West, J.B. (ed.) Pulmonary Gas Exchange. I. Ventilation, Bloodflow and Diffusion.
II. Organism and Environment. New York: Academic Press, 1980; 2:33–96
52 Wonisch M, Berent R, Klicpera M, Laimer H, Marko C, Schwann H, Schmid P,
Praxisleitlinien Ergometrie, Journal für Kardiologie 2008; 15, (Supplementum A –
Praxisleitlinien Ergometrie), 3-17.
53 GE Healthcare, Marquette™ 12SL™ ECG Analysis Program Physician’s Guide,
416791-004 Revision E.
54 International Classification of Diseases (ICD),
http://www.who.int/classifications/icd/en/.
55 Die Fahrradergometrie in der Praxis, Rost R, Hech H, Hollmann, Institut für
Sportmedizin und Kreislaufforschung der Deutschen Sporthochschule Köln, Bayer.
56 Arnow WS, Cassidy J: Five year follow-up of double Master’s test, maximal treadmill
stress test, and resting and postexercise apexcardiogram in asymptomatic persons.
Circulation 52:616, 1975.
57 Bruce RA, DeRouen TA: Exercise testing as a predictor of the heart disease and
sudden death. Hosp Pract 69, Sept., 1978.
58 Bruce RA, McDonough Jr: Stress testing in screening for cardiovascular disease. Bull
NY Acad Med 45:1288, 1969.
59 Cumming CR, Samm J, Borysyk, L, et al: Electrocardiographic changes during
exercise in asymptomatic men: 3 year follow up. Can Med Assoc J 112:578, 1975.
60 Froelicher VF Jr, Thomas MM, Pillow C, et al: Epidemiologic study of asymptomatic
men screened by maximal treadmill testing for latent coronary artery disease. Am J
Cardiol 34:770, 1974.
61 Proceedings of the National Workshop on Exercise in the Prevention, in the
Evaluation, and in the Treatment of Heart Disease. Myrtle Beach, SC, 1969. J Carol
Med Assoc (Suppl) 65 (1 to No. 12):1, 1969.
62 Fox SM, Naughton JP, Gorman PA: Physical activity and cardiovascular health. III.
The exercise prescription: frequency and type of activity. Mod Concepts Cardiovasc
Dis 41:25, 1972.
63 Bruce RA: Progress in exercise cardiology. In Yu PN, Goodwin JF (eds): Progress in
Cardiology, Vol 3. Philadelphia, Lea & Febiger, 1974, p 128.
64 Irving JB, Bruce RA, DeRouen TA: Variations in and significance of systolic pressure
during maximal exercise (treadmill) testing. Am J Cardiol 39:841, 1977.
65 Glasser SP, Clark PL: The Clinical Approach to Exercise Testing. Hagerstown,
Harper & Row, 1980.
66 Orzan F, Garcia E, Mather VS, et al: Is the treadmill exercise useful for evaluating
coronary artery disease in patients with complete left bundle branch block? Am J
Cardiol 42:36, 1978.
67 Tanaka T, Friedman MJ, Okada RD, et al: Diagnostic value of exercise-induced S-T
segment depression in patients with right bundle branch block. Am J Cardiol 41:670,
1978.
68 Morris SN, McHenry PL: The incidence and significance of exercise induced
hypotension (abstr). Am J Cardiol 39:289, 1977.
69 Bonoris PE, Greenberg PS, Castellanet MJ, et al: Significance of changes in R wave
amplitude during treadmill stress testing; angiographic correlation. Am J Cardiol
41:846, 1978.
70 Simoons ML, Hugenholtz PG: Estimation of the probability of exercise-induced
ischemia by quantitative ECG analysis.
Circulation 56:552, 1977.
71 Simoons ML, Hugenholtz PG, Ascoop CA, et al: Quantitation of exercise
electrocardiography. Circulation 63(3):471, 1981.

Revision C Physician’s Guide 121
2051167-002
Bibliography: Relevant Literature
72 Ashley E, Myers J, New Insights into the Clinical Exercise Test, ACSM’s Certified
News, Vol. 13, No. 4, October–December 2003
73 Håkan Kronander, Niklas Hammar, Werner Fischer-Colbrie, Jacek Nowak, Lars-Åke
Brodin, Håkan Elmqvist. Analysis of ST/HR hysteresis improves long-term prognostic
value of exercise ECG test. International Journal of Cardiology 148(2011)64–69
74 Diagnostic electrocardiographic devices, ANSI/AAMI EC11:1991/(R)2001/(R)2007
75 Kai P. Savonen, Timo A. Lakka, Jari A. Laukkanen, Tuomas H. Rauramaa, Jukka T.
Salonen, and Rainer Rauramaa, Usefulness of Chronotropic Incompetence in
Response to Exercise as a Predictor of Myocardial Infarction in Middle-Aged Men
Without Cardiovascular Disease, Am J Cardiol 2008; 101:992–998.
76 David S.Rosenbaum, Lance E.Jackson, Joseph M.Smith, Hasan Garan, Jeremy
Ruskin, and Richard J.Cohen. Electrical alternans and vulnerability to ventricular
arrhythmias. The New England Journal of Medicine, 330(4):235–241, January 27
1994.
77 Richard L. Verrier. Physiology of electrical alternans. Cardiac Electrophysiology
Review, 3:381 -386, 1997.
78 Vectorcardiogram synthesized from a 12-lead ECG: Superiority of the inverse dower
matrix. Lars Edenbrandt and Olle Pahlm., Journal of Electrocardiology, 4(21):361–
367, 1988.
79 Sutter JD et al. Chronotropic incompetence: are the carotid arteries to blame?
European Heart Journal (2006) 27, 897–898.
80 Heinsimer JA, Irwin JM, Basnight LL. Influence of underlying coronary artery disease
on the natural history and prognosis of exercise-induced left bundle branch block. Am
J Cardiol. 1987 Nov 1;60(13):1065-7.
81 Mathew S. Maurer, Elliot A. Shefrin and Jerome L. Fleg, Prevalence and prognostic
significance of exercise-induced supraventricular tachycardia in apparently healthy
volunteers. Am J Cardiol 1995;75:788-792.
82 Tuomo Nieminen, Rami Lehtinen, Jari Viik, Terho Lehtimäki, Kari Niemelä, Kjell
Nikus, Mari Niemi, Janne Kallio, Tiit Kööbi, Väinö Turjanmaa, and Mika Kähönen.
The Finnish cardiovascular study (fincavas): characterising patients with high risk of
cardiovascular morbidity and mortality. BMC Cardiovascular Disorders, 6:2-8, 2006.
83 Richard L. Verrier, Thomas Klingenheben, Marek Malik, Nabil El-Sherif, Derek V.
Exner, Stefan H. Hohnloser, Takanori Ikeda, Juan Pablo Martinez, Sanjiv M.
Narayan, Tuomo Nieminen, David S. Rosenbaum. Microvolt T-Wave Alternans
Physiological Basis, Methods of Measurement, and Clinical Utility—Consensus
Guideline by International Society for Holter and Noninvasive Electrocardiology.
J Am Coll Cardiol 2011;58:1309–24.
84 Sae Young Jae, Bo Fernhall, Kevin S. Heffernan, Mira Kang, Moon-Kyu Lee, Yoon-
Ho Choi, and Won Hah Park. Chronotropic response to exercise testing is associated
with carotid atherosclerosis in healthy middle-aged men. European Heart Journal
(2006) 27, 954–959.
85 Willi Kaiser, Martin Findeis, Rami Lehtinen, Terho Lehtimäki, Jari Viik. Exercise Test
Interpretation. Computing in Cardiology 2010;37:769−772.
86 2062179-002 Audio-ECG Physician’s guide to Audio-ECG Assessment of Stress
Tests.
87 K Rahimia, A Thomas, M Adam, B Hayerizadeh, G Schuler and M Secknus.
Implications of exercise test modality on modern prognostic markers in patients with
known or suspected coronary artery disease: Treadmill versus bicycle. European
Journal of Cardiovascular Prevention and Rehabilitation 2006, 13:45–50.
88 Jule N.Wetherbee, Virinderjit S. Bamrah, Michael J. Ptacin, John H. Kalbfleisch.
Comparison of ST Segment Depression in Upright Treadmill and Supine Exercise
Testing. JACC Vol.11 No2 February 1988.

122 Physician’s Guide Revision C
2051167-002
Bibliography: Relevant Literature
89 Myers, J., et al., Exercise capacity and mortality among men referred for exercise
testing. The New England Journal of Medicine, 2002. 346(11): p. 793-801.
90 Zimarino M, Barnabei L, Madonna R, Palmieri G, Radico F, Tatasciore A, Bellisarii FI,
Perrucci GM, Corazzini A, De Caterina R. Institute of Cardiology and Center of
Excellence on Aging, "G. d'Annunzio" University-Chieti Italy, Italy. A comparison of
the diagnostic performance of the ST/HR hysteresis with cardiopulmonary stress
testing parameters in detecting exercise-induced myocardial ischemia. Int J Cardiol.
2012 Dec 20.
91 Diamond, G.A. and S. Kaul, Evidence-based financial incentives for healthcare
reform: putting it together. Circulation. Cardiovascular quality and outcomes, 2009.
2(2): p. 134-40.
92 Simoons, M.L. and S. Windecker, Controversies in cardiovascular medicine: Chronic
stable coronary artery disease: drugs vs. revascularization. European Heart Journal,
2010. 31(5): p. 530-41.
93 Topol, E.J. and S.E. Nissen, Our preoccupation with coronary luminology. The
dissociation between clinical and angiographic findings in ischemic heart disease.
Circulation, 1995. 92(8): p. 2333-42.
94 Libby, P., P.M. Ridker, and A. Maseri, Inflammation and atherosclerosis. Circulation,
2002. 105(9): p. 1135-43.
95 Roger, V.L., et al., Heart disease and stroke statistics--2012 update: a report from the
american heart association. Circulation, 2012. 125(1): p. e2-e220.
96 Badimon, L., T. Padró, and G. Vilahur, Atherosclerosis, platelets and thrombosis in
acute ischaemic heart disease. European Heart Journal: Acute Cardiovascular Care,
2012. 1(1): p. 60-74.
97 Maseri, A. and V. Fuster, Is there a vulnerable plaque? Circulation, 2003. 107(16): p.
2068-71.
98 Matter, C.M., M. Stuber, and M. Nahrendorf, Imaging of the unstable plaque: how far
have we got? European Heart Journal, 2009. 30(21): p. 2566-74.
99 Atwater, B.D., J. Oujiri, and M.R. Wolff, The immediate impact of the Clinical
Outcomes Utilizing Revascularization and Aggressive Drug Evaluation (COURAGE)
trial on the management of stable angina. Clinical Cardiology, 2009. 32(8): p. E1-3.
100 Kereiakes, D.J., Ischemia is the critical determinant of revascularization benefit: an
interventionalist's perspective of the COURAGE trial. Reviews in cardiovascular
medicine, 2009. 10 Suppl 2: p. S45-52.
101 Stergiopoulos K, B.D.L., Initial coronary stent implantation with medical therapy vs
medical therapy alone for stable coronary artery disease: Meta-analysis of
randomized controlled trials. Archives of Internal Medicine, 2012. 172(4): p. 312-319.
102 Pursnani, S., et al., Percutaneous coronary intervention versus optimal medical
therapy in stable coronary artery disease: a systematic review and meta-analysis of
randomized clinical trials. Circulation. Cardiovascular interventions, 2012. 5(4): p.
476-90.
103 Weintraub, W.S., et al., Cost-effectiveness of percutaneous coronary intervention in
optimally treated stable coronary patients. Circulation. Cardiovascular quality and
outcomes, 2008. 1(1): p. 12-20.
104 Denktas, A.E., et al., Reduced-dose fibrinolytic acceleration of ST-segment elevation
myocardial infarction treatment coupled with urgent percutaneous coronary
intervention compared to primary percutaneous coronary intervention alone results of
the AMICO (Alliance for Myocardial Infarction Care Optimization) Registry. JACC
Cardiovasc Interv, 2008. 1(5): p. 504-10.
105 Kent, D.M., J. Lau, and H.P. Selker, Balancing the benefits of primary angioplasty
against the benefits of thrombolytic therapy for acute myocardial infarction: the
importance of timing. Eff Clin Pract, 2001. 4(5): p. 214-20.

Revision C Physician’s Guide 123
2051167-002
Bibliography: Relevant Literature
106 Tarantini, G., et al., Acceptable reperfusion delay to prefer primary angioplasty over
fibrin-specific thrombolytic therapy is affected (mainly) by the patient's mortality risk:
1 h does not fit all. Eur Heart J, 2010. 31(6): p. 676-83.
107 Terkelsen, C.J., et al., Primary PCI as the preferred reperfusion therapy in STEMI: it
is a matter of time. Heart, 2009. 95(5): p. 362-9.
108 Lin, G.A., et al., Frequency of stress testing to document ischemia prior to elective
percutaneous coronary intervention. JAMA: the journal of the American Medical
Association, 2008. 300(15): p. 1765-73.
109 Cassar, A., et al., Chronic coronary artery disease: diagnosis and management.
Mayo Clinic proceedings. Mayo Clinic, 2009. 84(12): p. 1130-46.
110 Chan, P.S., et al., Appropriateness of percutaneous coronary intervention. JAMA: the
journal of the American Medical Association, 2011. 306(1): p. 53-61.

GE Medical Systems
Information Technologies, Inc.
8200 West Tower Avenue
Milwaukee, WI 53223 USA
Tel: +1 414 355 5000
1 800 558 7044 (US only)
1 800 668 0732 (Canada only)
Fax: +1 414 355 3790
www.gehealthcare.com
GE Medical Systems
Information Technologies GmbH
Munzinger Straße 5
79111 Freiburg
GERMANY
Tel: +49 761 4543-0
Fax: +49 761 4543-233
Asia Headquarters
GE (China) Co.,Ltd.
No1 Huatuo Road,
Zhangjiang Hi-Tech Park Pudong,
Shanghai, P.R.China 201203
Tel: +86 21 38777888
Fax: +86 21 38777402
