
Occasional Paper Series
The use of the Eurosystem’s
monetary policy instruments and its
monetary policy implementation
framework in 2020 and 2021
Marco Corsi, Yvo Mudde (editors)
No 304 / September 2022
Disclaimer: This paper should not be reported as representing the views of the European Central Bank (ECB).
The views expressed are those of the authors and do not necessarily reflect those of the ECB.
ECB Occasional Paper Series No 304 / September 2022
1
Contents
Abstract 3
Non-technical summary 4
1 Introduction to the Eurosystem’s monetary policy instruments in
2020 and 2021 5
1.1 Overview of monetary policy instruments 6
2 Steering of short-term interest rates 8
2.1 Main developments in excess liquidity and money markets 8
Box 1 The interaction between developments in money markets and
money market funds and the ECB’s response during the COVID-
19 crisis 9
3 Minimum reserve requirements and the two-tier system 13
4 Credit operations 15
4.1 TLTROs 16
4.2 PELTROs, LTROs, MROs and the MLF 19
4.3 US dollar credit operations 20
4.4 The Eurosystem repo facility for central banks (EUREP) and
other repo agreements and foreign exchange swaps with foreign
central banks 22
5 Counterparty framework 24
5.1 Eligibility criteria and discretionary measures 24
5.2 Counterparties’ developments 25
6 Collateral framework 27
6.1 Changes to the collateral framework 27
6.2 Eligibility and mobilisation of collateral 30
Box 2 Acceptance of loans guaranteed by public guarantee schemes
within the ACC framework 32
7 Asset purchase programmes 34
7.1 Pandemic emergency purchase programme 34
ECB Occasional Paper Series No 304 / September 2022
2
7.2 Asset purchase programme 36
7.3 Securities lending programmes 40
Box 3 The role of the PEPP in the stabilisation and reduction of
volatility in the European government bond market 40
Box 4 The NGEU programme and its implications for monetary policy
implementation 43
8 Impact of the Eurosystem monetary policy implementation on its
balance sheet and liquidity conditions 46
8.1 Impact of Eurosystem monetary policy implementation on its
balance sheet 46
8.2 Excess liquidity and its distribution 48
8.3 Developments in autonomous factors 50
References 53
ECB Occasional Paper Series No 304 / September 2022
3
Abstract
The Eurosystem implements its monetary policy through a set of monetary policy
instruments (MPIs) that are either part of the standard toolbox or are developed to
deal with major economic and financial events with a potential adverse impact on
price stability and/or the transmission of monetary policy. In the review period
covered by this report (2020-2021), monetary policy action was dominated by the
Eurosystem’s response to the negative economic effects of the outbreak of the
COVID-19 pandemic. Through its action, the Eurosystem continued to expand its
balance sheet, in particular by scaling up its outright asset purchases and easing the
conditions of its targeted longer-term refinancing operations (TLTROs),
complemented by temporary changes in the collateral framework. The
accommodative monetary policy stance was preserved by maintaining the key ECB
interest rates at record-low levels, reinforced by the ECB’s forward guidance on
policy rates. This report provides a full overview of the Eurosystem’s monetary policy
implementation over the years 2020 and 2021.
JEL: D02, E43, E58, E65, G01
Keywords: monetary policy implementation, central bank counterparty framework,
central bank collateral framework, central bank liquidity management, non-standard
monetary policy measures

ECB Occasional Paper Series No 304 / September 2022
4
Non-technical summary
This paper provides a comprehensive overview of the use of the Eurosystem’s MPIs
over the period 2020 to 2021 and continues the series on this topic started in 2012.
1
The report is structured along three main themes, aimed at guiding the reader
through the various MPIs that were introduced or enhanced in the review period.
First, short-term interest rates were kept at very low levels – mostly close to but
below the interest rate on the deposit facility (DFR) – in an environment of very high
excess liquidity, thereby preserving a very accommodative monetary policy stance.
In addition, while minimum reserve requirements have continued to play a less
relevant role than in the past in steering short-term rates due to the large excess
liquidity, they served as reference for the two-tier system introduced in October
2019. This last instrument continued mitigating the side effects of the negative
interest rate policy on the transmission of monetary policy by exempting part of
banks’ excess reserves from negative remuneration. Sections 2 and 3 cover these
developments.
Second, liquidity provided by the Eurosystem through its credit operations more than
tripled in the review period (up to €2,207 billion), in particular as a result of the
attractive conditions under its TLTRO III operations, which ensured favourable bank
lending conditions during the pandemic. In parallel, a temporary expansion of the
collateral framework concomitant with a temporary higher risk tolerance, increased
collateral availability thereby facilitating broad-based participation in these
operations. As part of the swift ECB reaction to the outbreak of the COVID-19 crisis,
the Eurosystem also enhanced its provision of US dollar liquidity to banks and
created the Eurosystem repo facility for central banks (EUREP) to offer euro liquidity
to foreign central banks. The counterparty framework was also fine-tuned, while fully
preserving the Eurosystem’s first layer of risk protection (the second being collateral)
when conducting credit operations. Sections 4, 5 and 6 cover these developments.
Third, asset purchase programmes were conducted at an unprecedented scale to
preserve favourable financing conditions, in particular following the launch of the
pandemic emergency purchase programme (PEPP) in the early phase of the
pandemic. Overall, a maximum envelope of €1,850 billion in purchases was foreseen
under the PEPP, of which €1,581 billion had been used by the end of 2021. In
addition, the asset purchase programme (APP) was scaled up in March 2020 by a
total of €120 billion. In parallel, the Eurosystem continued lending part of its
securities under its securities lending programmes. Section 7 describes these
developments.
Finally, Section 8 considers the aggregate effect of the above instruments on the
Eurosystem balance sheet and related liquidity conditions, as well as the effects on
the distribution of excess liquidity and developments in autonomous factors,
including banknotes and government deposits. Overall, in this period, monetary
policy assets increased from €3.3 trillion at the end of 2019 to €6.8 trillion at the end
of 2021, thereby reaching a value equating to almost 60% of the euro area gross
domestic product (GDP).
1
Eser et al. (2012); Alvarez et al. (2016); Bock et al. (2018); Sylvestre and Coutinho (2020).

ECB Occasional Paper Series No 304 / September 2022
5
1 Introduction to the Eurosystem’s
monetary policy instruments in 2020
and 2021
The ECB’s response to the economic fallout from the outbreak of the COVID-
19 pandemic dominated its monetary policy action in the period under review,
namely from 1 January 2020 to 31 December 2021. In early 2020, the ECB
maintained a very accommodative monetary policy stance to support the medium-
term price stability objective. The outbreak of the COVID-19 pandemic and the
accompanying social restrictions to limit the spread of the virus changed the
economic and financial outlook drastically. The ECB faced the threat of a liquidity
and credit crunch, serious risks to the monetary policy transmission mechanism,
severe dislocations across market segments, and sharply decreasing market-based
inflation expectations, as evident, for instance, from market-based measures
(Chart 1). The ECB therefore substantially eased the monetary policy stance over
the course of 2020 to counter the negative impact of the COVID-19 pandemic on the
euro area economy. Following the most acute phase of the pandemic, financial and
economic conditions recovered and the inflation outlook improved. Nonetheless, the
ECB’s policy response to the outbreak of the COVID-19 pandemic remained an
important determinant for the configuration of MPIs in place throughout the review
period and therefore constitutes a key element for this report.
Chart 1
Inflation expectations and government bond yields
(percentages per annum)
Source: Bloomberg.
Notes: Government bonds yields (10-year maturity) are weighted by GDP, based on the 11 largest euro area countries.
-1%
0%
1%
2%
3%
4%
01/20 04/20 07/20 10/20 01/21 04/21 07/21 10/21
Euro area weighted government bond yield
5-year to 5-year inflation swap
Euro area government bond yields (range)

ECB Occasional Paper Series No 304 / September 2022
6
1.1 Overview of monetary policy instruments
Over the review period, the Eurosystem introduced new measures and
recalibrated existing instruments in an unprecedented way to counter the
adverse effects of the pandemic. The Eurosystem balance sheet therefore
reached record levels. This report is structured around three main themes.
First, the ECB ensured an accommodative monetary policy stance by
maintaining the key ECB interest rates at record-low levels, reinforced by its
forward guidance on policy rates. As a result of the large liquidity injection, excess
liquidity in the euro area banking system continued maintaining the short-term
money market (which are used as reference rates) trading at or around the DFR. In
addition, the ECB actively used forward guidance in its communications to signal that
its policy rates would remain at their present level, or lower, until the inflation outlook
– including underlying inflation dynamics – were consistent with the Governing
Council’s inflation aim. It also stated that policy rates would not be raised before the
end of net purchases under the APP. After the conclusion of its strategy review, the
ECB further clarified the conditions under which it would consider raising its interest
rates. Finally, the ECB maintained its two-tier system (TTS) for reserve remuneration
to mitigate the side effects of the negative interest rate policy on the transmission of
monetary policy.
Chart 2
Euro area debt issuance and asset purchase programmes
(EUR billions)
Sources: ECB and ECB calculations
Notes: net debt issuances by issuer type, as indicated, and net volume purchased under the APP and PEPP programmes. Based on
monthly data. MFI stands for monetary financial institution.
Second, Eurosystem’s credit operations ensured that bank funding conditions
remained favourable and facilitated the banking sector in meeting the
increased loan demand during the pandemic. The conditions of the TLTRO III
programme were substantially eased by increasing banks’ borrowing allowance and
decreasing the applicable borrowing rate. These amendments contributed to record
(€2.2 trillion) participation in Eurosystem credit operations. Finally, an extension of
-100
0
100
200
300
400
01/19 04/19 07/19 10/19 01/20 04/20 07/20 10/20 01/21 04/21 07/21 10/21
MFIs
Government
Corporates
Net APP and PEPP

ECB Occasional Paper Series No 304 / September 2022
7
the collateral framework complemented the credit operations by increasing the
collateral availability to enable bank participation in these operations.
Third, asset purchase programmes contributed to delivering the appropriate
degree of monetary accommodation, stabilising financial markets and
preserving favourable financing conditions. The APP – which was already in
place before the pandemic – was upscaled, through duration extraction
2
and
signalling effects, to help provide the degree of policy accommodation needed to
ensure the convergence of inflation towards the aim. In addition, the PEPP was
launched in the early phase of the pandemic given that the financial markets had
frozen under the weight of rising uncertainty at that time. The PEPP aimed to support
the monetary policy stance and transmission by ensuring the Eurosystem’s a strong
market presence (Chart 2), as well as its flexibility over time, across asset classes
and among jurisdictions.
Chart 3
Monetary policy operations
(EUR billions)
Sources: ECB and ECB calculations
This report provides a thorough overview of the use of the Eurosystem
monetary policy implementation framework. It focuses on the 2020-2021 review
period, during which outstanding monetary policy operations (MPOs) reached
unprecedented levels (Chart 3). The structure of the review of MPIs will follow the
main three themes set out above, thereby deviating somewhat, in terms of outline,
from previous versions of the MPI report, while maintaining most of the sections
covered in previous reports
3
. Moreover, the report provides four boxes which offer
deeper insights into specific elements of relevance over the review period.
2
The duration extraction channel identifies a transmission channel for non-standard monetary policy
through which the central bank ‘extracts’ duration risk from the market through bond purchases while
letting its balance-sheet size grow.
3
Eser et al. (2012); Alvarez et al. (2016); Bock et al. (2018); Sylvestre and Coutinho (2020).
0
1,000
2,000
3,000
4,000
5,000
6,000
7,000
2007 2008 2009 2010 2011 2012 2013 2014 2015 2016 2017 2018 2019 2020 2021
Global financial
crisis
Euro area sovereign
debt crisis
Coronavirus
pandemic crisis
Credit operations
Asset purchase programmes

ECB Occasional Paper Series No 304 / September 2022
8
2 Steering of short-term interest rates
In the high excess liquidity environment prevailing in the review period, money
market rates were steered towards the ECB’s DFR. The level of the DFR and
expectations about its future levels constitute the risk-free component of euro area
interest rates and yield curves and thus serve as the starting point for the monetary
policy transmission mechanism.
This section outlines the main developments in money markets and their interplay
with excess liquidity. Over the review period, the monetary policy implementation
framework to steer short-term interest rates remained unchanged; the developments
described below reflect the conduct of non-standard monetary policy measures
(such as asset purchase programmes) and external developments.
2.1 Main developments in excess liquidity and money
markets
During the review period, excess liquidity continued to increase and reached a
record level of €4.5 trillion in 2021. At the start of the review period in 2020, the
Eurosystem operated with a level of excess liquidity
4
of €1.7 trillion. As a result of
the monetary policy response to the outbreak of the pandemic, central bank reserves
increased strongly. Liquidity creation amounted to €3.7 trillion and resulted in €2.8
trillion of additional excess liquidity, with the difference (€0.9 trillion) being explained
by increased liquidity absorption through autonomous factors, such as banknotes
and non-monetary policy deposits (e.g. government deposits) (Chart 4a).
5
The
amount in central bank reserves provided the banking sector with ample scope to
meet the minimum reserve requirements (MRRs) and ensured that money market
rates remained closely linked to the DFR. Sections 3 and 8 provide more information
on developments with respect to MRRs and excess liquidity respectively.
Money market rates – and in particular the euro short-term rate (€STR) –
remained close to the DFR. The DFR was set at -0.50% in September 2019.
Money markets, and in particular the unsecured overnight rate (the €STR), traded
steadily below the DFR. Over the years 2020 and 2021, the €STR decreased on
average by 3 basis points to -0.57% (Chart 4b). While the €STR market is
characterised by transactions between banks and institutions that do not have direct
access to the deposit facility (DF) (non-banks, e.g. funds), an arbitrage mechanism
explains the differential between the DFR and the €STR.
6
Money market segments
4
Defined as the sum of holdings of central bank reserves in excess of reserve requirements and
holdings of equivalent central bank deposits (see Section 8).
5
See Section 8.3 for more detailed information.
6
Non-bank financial institutions (NBFIs) had been increasingly holding deposits often resulting from the
sale of securities to the Eurosystem. Since NBFIs do not fulfil the necessary Eurosystem eligibility
criteria and thus do not have access to the Eurosystem balance sheet, they resorted to banks for
liquidity storage by lending them liquidity, which banks in turn deposited with the Eurosystem by
charging a spread. As a result, benchmark rates, such as €STR, declined below the DFR.

ECB Occasional Paper Series No 304 / September 2022
9
with longer tenors or secured rates naturally reflect different risk premia and market
conditions. For example, the three-month euro interbank offered rate (EURIBOR)
peaked during the early phase of the pandemic, while at the same time some repo
rates (e.g. the German RepoFunds rate) fell to a lower level on 20 March 2020 (see
Box 1). However, both rates recovered after the decisions taken by the ECB
Governing Council on 24 March 2020.
Chart 4
Developments in excess liquidity and money market interest rates
a) Liquidity provision through MPOs and its
uses
b) The DFR and main money market rates vs
excess liquidity
(EUR trillions)
(left-hand scale: percentages per annum; right-hand scale: EUR
trillions)
Source: ECB, European Money Market Institute, Bloomberg
Note: the German RepoFunds rate reached -2.25% at the end of 2020 and -4.65% at the end of 2021 due to repo market dynamics.
Box 1
The interaction between developments in money markets and money market funds and
the ECB’s response during the COVID-19 crisis
This box focuses on the tensions in euro area money markets during the early stages of the
pandemic and the interplay with money market funds (MMFs). As a result of increased market
volatility and economic uncertainty, MMFs experienced significant outflows on the outbreak of
COVID-19 in March 2020 (Chart A). Prior to the COVID-19 stress, these funds held around 70% of
short-term (mostly private) debt issued in the euro area, and therefore play a vital role in money
markets. The stress placed on MMFs had implications for monetary policy transmission given its
impact on EURIBOR – an important reference rate for the euro area – and on banks’ liquidity
management.
0
1
2
3
4
5
6
7
8
01/20 07/20 01/21 07/21
Monetary policy operations
Minimum reserve requirements
Liquidity effect - autonomous factors
Excess liquidity
0
1
2
3
4
5
-1.0
-0.9
-0.8
-0.7
-0.6
-0.5
-0.4
-0.3
-0.2
-0.1
0.0
01/20 07/20 01/21 07/21
€STR
3-month Euribor
RepoFunds Rate (DE)
DFR
Excess liquidity (right-hand scale)

ECB Occasional Paper Series No 304 / September 2022
10
Chart A
Cumulative daily flows in the assets under management of European MMFs
(EUR billions)
Source: iMoneyNet.
Notes: iMoneyNet includes daily data on multiple characteristics of individual MMFs. While the database covers almost the entire US, for the euro area it
covers only Ireland and Luxembourg (and not France). Consequently, the results may differ slightly from those of other sources. Euro government funds are
excluded, as these are negligible. Black (grey) vertical bars show policy actions relating to asset purchases (refinancing operations). Remarkably, euro low
volatility funds experienced relatively large inflows at the beginning of the crisis in March 2020. This happened on the back of margin-related inflows owing to
the fact that the ECB surprised markets by keeping the DFR unchanged whereas the markets had fully priced in a rate cut. While this first led to MMF inflows,
resulting from gains on derivatives positions (through overnight index swaps (OISs)), margin calls also triggered a sharp reversal. Last observation: end of
January 2021.
MMFs came under pressure as economic stress and regulatory side effects increased outflows
The early phase of the pandemic was accompanied by an increased preference for liquidity on the
part of investors, banks and other parties. MMFs experienced substantial redemptions, driven by
the standstill in the global economy that significantly harmed traditional corporate cash flows.
Moreover, the uncertainty in financial markets led to growing liquidity needs (e.g. among pension
funds) to meet margin calls on derivatives exposures.
7
Finally, investors in MMFs redeemed cash
for precautionary reasons given that they were uncertain about the speed at which they would be
able to monetise assets. MMFs were challenged to meet these withdrawals given that securities
selling had to take place in illiquid markets or the funds had to draw down their weekly liquid asset
buffers.
While triggered by the COVID-19 shock, MMF outflows seem to have been amplified by regulatory
liquidity restrictions. Liquidity restrictions/redemption tools at fund level were introduced as part of
the MMF reforms introduced after the financial crisis to increase the soundness of that sector.
Funds of the type most common in Europe (low volatility net asset value funds) are required to keep
their weekly liquid assets above 30% of their net asset value (NAV) and the deviation of the mark-
to-market value NAV within 20 basis points.
8
In times of stress, MMFs have to sell assets to be able
to meet daily redemptions, while simultaneously complying with these liquidity restrictions. The
threat posed by the need to meet these restrictions may trigger procyclical investment behaviour,
7
See ECB (2020a).
8
Regulation (EU) 2017/1131 of the European Parliament and of the Council of 14 June 2017 on money
market funds (OJ L 169, 30.6.2017, p. 8). This Money Market Funds Regulation entered into force in
2019.
-5
0
5
10
15
20
25
30
01/20 03/20 05/20 07/20
Low volatility funds
Variable funds

ECB Occasional Paper Series No 304 / September 2022
11
leading to pre-emptive runs before the liquidity restrictions kick in. In March 2020, MMF outflows
were, indeed, more severe among funds with a lower percentage of liquid assets on their books.
9
Why was the stress among MMFs relevant for the ECB?
The MMF sector holds a substantial amount of short-term marketable debt (e.g. commercial paper
(CP)). While the majority of European banks have a large depositor base and, as a result, short-
term debt only makes up a small portion of their total funding mix,
10
CP plays an important role in
the liquidity management for banks given that it is often used to manage the liquidity coverage ratio
(LCR)
11
.
More importantly, stress in the CP market due to MMF liquidity strains had adverse consequences
on the transmission of monetary policy to the real economy. Following the benchmark reform of risk-
free rates in the euro area, rates on CP issued by banks are included in the EURIBOR calculation.
EURIBOR serves as an important benchmark for contracts worth some €180 trillion, including over
€1 trillion of retail mortgages.
12
Hence, the malfunctioning of CP markets that followed the
pronounced outflows from the MMF sector resulted in large spikes in bank CP rates, automatically
feeding into EURIBOR. As a result, EURIBOR rates rose to levels last seen in 2016, despite the
unprecedented monetary accommodation set by the Eurosystem (Chart B).
Chart B
EURIBOR rates
(percentages per annum)
Source: European Money Market Institute.
The monetary policy response
The Eurosystem took extensive measures to limit the negative effects of the COVID-19 crisis on the
economy and price stability. The impact on CP markets was alleviated by the purchase of non-
9
See ECB (2021a), Hudepohl et al. (2021), and ESMA (2021). The ESMA reported that no funds
breached the +/- 20 basis points collar in March, although a few funds were close to the threshold (e.g.
one fund had an 18 basis points deviation).
10
In fact, CP covers less than 3% of total funding needs and is thus only a minor source of bank funding.
Overarchingly, the share of deposit financing in total liabilities for the European banking sector in
general is more than ten times as large as the share of short-term marketable debt.
11
An important regulatory ratio which measures whether banks are capable of managing outflows over a
30-day period.
12
See “Euro money market reference rate”, European Money Market Institute website.
-0.7
-0.6
-0.5
-0.4
-0.3
-0.2
-0.1
0.0
01/16 01/17 01/18 01/19 01/20 01/21
3-month EURIBOR
6-month EURIBOR

ECB Occasional Paper Series No 304 / September 2022
12
financial CP with a minimum residual maturity of 28 days
13
and the broader acceptance of
uncovered bank bonds (the risk concentration limit having been increased from 2.5% to 10%).
Furthermore, the favourable conditions attaching to lending operations (additional long-term
refinancing operations (LTROs), pandemic emergency long-term financing operations (PELTRO)
and TLTROs) eased banks liquidity conditions and decreased their need to rely on market funding.
While these policy responses only supported MMFs indirectly, they helped to stabilise the money
markets effectively and money market rates such as EURIBOR started declining again towards
record-low levels. From a policy perspective and with a view to potential future such episodes, while
the extensive monetary policy measures taken by the Eurosystem helped to relieve stress in money
markets, adjusting regulation may prove particularly effective in enhancing the resilience of MMFs
in a more structural way.
14
13
Instead of the minimum residual maturity of six months that applies to other marketable debt
instruments with an initial maturity of at least 367 days covered by the corporate sector purchase
programme (CSPP).
14
ECB (2022); FSB (2021).
ECB Occasional Paper Series No 304 / September 2022
13
3 Minimum reserve requirements and the
two-tier system
MRRs have traditionally absorbed a relatively stable amount of liquidity given
an unchanged reserve ratio and only moderate growth in the relevant balance-
sheet items. The Eurosystem’s minimum reserve system traditionally served the
purpose of enlarging the structural liquidity deficit of the euro area banking system in
order to help steer short-term interest rates. Although this purpose has become less
relevant in recent years due to the large liquidity surplus, MRRs remain a standard
monetary policy implementation tool with euro area credit institutions being required
to hold a certain amount of funds as minimum reserves in their current accounts at
their respective national central banks (NCBs). In addition, the MRR has served as a
reference since October 2019 for the TTS, as explained below. The MRR is
calculated on the basis of the respective credit institution’s balance sheet prior to the
start of a maintenance period, and every credit institution must ensure that it holds
the required level of reserves, on average, over the relevant maintenance period.
The reserve requirement for each credit institution is calculated by multiplying
specific short-term liabilities by the reserve ratio, currently at 1% since January 2012.
The funds held to meet the MRR are remunerated at the main refinancing operations
(MRO) rate, that is to say, there are no costs for banks.
However, minimum reserves increased in absolute terms over the review
period due to the more pronounced increase in deposits on credit institution
balance sheets. MRRs gradually rose from €134.5 billion in January 2020 to €154.2
billion in December 2021 (Chart 5a), an increase of 14.7% compared with 8.4% in
the period from January 2018 to December 2019. This increase was driven by the
growth of credit institution liabilities subject to reserve requirements. While reserve
requirements grew in absolute terms, their share of total excess liquidity provided to
the banking system almost halved, from around 7.5% at the end of 2019 to 3.4% in
November 2021. This relative decline reflects the significant increase in excess
liquidity caused by the various pandemic-related measures (see Section 8), and was
most pronounced following the settlement of TLTRO III.4 on 24 June 2020.
The TTS addressed the side effects of the negative interest rate policy on the
transmission of monetary policy by exempting a portion of banks’ excess
reserves from negative remuneration. Frictions in the pass-through of negative
rates to banks’ funding costs when deposit rates are floored at zero (this is
particularly relevant for most of the retail deposits) may negatively affect bank profits
and thereby impair bank-based transmission of monetary policy. The TTS aims to
mitigate such impairments by exempting portions of credit institutions’ excess
reserves from negative remuneration at the DFR. The exempt tier was set in relation
to a credit institution’s MRR; the multiplier is the same for all credit institutions and
has remained unchanged at 6 during the review period.

ECB Occasional Paper Series No 304 / September 2022
14
Credit institutions made intensive use of the TTS and had nearly made full use
of it by the end of the review period. Most credit institutions in the euro area made
full use of their TTS allowance following its introduction, when 95.4% of the exempt
tier was used. In the review period, this increased to 99.4% as credit institutions
became more familiar with the system and optimised their reserve management. The
magnitude of use of the exempt tier mechanically followed the increase in MRR,
thereby rising from €804.8 billion in November 2019 to €925.4 billion in December
2021 (Chart 5b).
Chart 5
Developments in MRR and TTS
a) MRR vs excess liquidity
b) Fulfilment of TTS
(left-hand scale: EUR billions; right-hand scale: percentages per
annum)
(EUR billions)
Source: ECB and ECB calculations.
Note: based on maintenance period averages.
3.0%
4.0%
5.0%
6.0%
7.0%
8.0%
9.0%
120
125
130
135
140
145
150
155
01/18
07/18
01/19
07/19
01/20
07/20
01/21
07/21
Thousands
Reserve requirements
MRR in % of excess reserves (right-hand scale)
90%
91%
92%
93%
94%
95%
96%
97%
98%
99%
100%
0
500
1,000
1,500
2,000
2,500
3,000
3,500
4,000
4,500
5,000
MP 7 - 2019 MP 7 - 2020 MP 7 - 2021
Exempt excess liquidity (used allowance)
Non-exempt excess liquidity
% used allowance (right-hand scale)

ECB Occasional Paper Series No 304 / September 2022
15
4 Credit operations
Credit operations
15
are one of the cornerstones of the Eurosystem’s monetary
policy framework. The European banking sector plays an essential role in the
transmission of the ECB’s monetary policy. Through its credit operations, the ECB is
able to directly affect banks’ funding conditions, thereby preserving or stimulating
bank lending conditions. From the start of 2020, recourse to Eurosystem funding
significantly increased, moving from €627 billion to €2,207 billion, reversing the
downward trend seen in previous years (Chart 6).
This chapter distinguishes three main classes of credit operations:
• The TLTRO III programme provides banks with longer-term funding at attractive
conditions conditional on banks meeting a bank-specific pre-determined lending
benchmark. The operations are aimed at preserving favourable borrowing
conditions and are specifically designed to stimulate bank lending to the real
economy. During the review period, the ongoing series of TLTRO III operations
was adjusted in order to preserve bank lending amid the outbreak of the
COVID-19 pandemic.
• PELTROs, LTROs and MROs provide banks with funding at less attractive
terms compared with TLTRO III operations. While at the onset of the pandemic
the ECB’s response included the launch of PELTROs and additional LTROs at
relatively favourable pricing, three-month LTROs and MROs continued to be
offered under their customary conditions and played a role in providing liquidity
to smaller and/or specialised banks. In addition, the marginal lending facility
(MLF) remained available as a liquidity backstop.
• US dollar operations provide euro area banks with short-term US dollar
liquidity. With deteriorating liquidity in the US dollar funding market after the
outbreak of the pandemic, the conditions of the US dollar tenders offered by the
Eurosystem were temporarily eased.
All credit operations with banks are conducted on the basis of the Eurosystem
counterparty (see Section 5) and collateral frameworks (see Section 6). This chapter
also contains a subchapter elaborating on the foreign exchange arrangements
between central banks, which offer non-euro area banks the possibility of obtaining
euro outside the euro area.
15
Under Article 2(31) of Guideline (EU) 2015/510 of the European Central Bank of 19 December 2014 on
the implementation of the Eurosystem monetary policy framework (ECB/2014/60) (henceforth: the
General Documentation (GD)), Eurosystem credit operations means liquidity-providing reverse
transactions (i.e. liquidity-providing Eurosystem MPOs, excluding foreign exchange swaps for monetary
policy purposes and outright purchases) and intraday credit.

ECB Occasional Paper Series No 304 / September 2022
16
Chart 6
Participation in Eurosystem credit operations with eligible counterparties
(EUR billions)
Source: ECB.
4.1 TLTROs
The TLTRO III series was launched in September 2019. Through this targeted
programme the ECB provided banks with the opportunity to obtain three-year
funding up to a maximum amount. This borrowing allowance depended on the size
of the banks’ outstanding portfolio of loans to non-financial corporations (NFCs) and
households, excluding loans for house purchases. Banks received a discount on
their borrowing rate conditional on their lending performance.
With market stress rising following the outbreak of the pandemic, the ECB
enhanced the conditions of the TLTRO III programme to support bank lending.
This easing of the TLTRO III conditions was one of the key responses to the
pandemic. By April 2020, the ECB had introduced a special interest rate period,
running from June 2020 to June 2021, during which the interest rate on TLTRO III
operations was reduced to 50 basis points below the average interest rate prevailing
in the Eurosystem’s MRO rate over the same period. Moreover, for counterparties
whose eligible net lending reached the lending performance threshold, the interest
rate over the period from June 2020 to June 2021 would be 50 basis points below
the average DFR prevailing over the same period. Finally, the ECB raised the
maximum total amount that counterparties were allowed to borrow under TLTRO III.
In December 2020, in response to the economic fallout from the resurgence of the
pandemic in the euro area, the terms and conditions of the TLTRO III programme
were prolonged further (Table 1).
500
1,000
1,500
2,000
2,500
3,000
3,500
4,000
4,500
0
500
1,000
1,500
2,000
2,500
01/19 07/19 01/20 07/20 01/21 07/21
Thousands
MRO
3M LTRO
PELTRO
Additional LTRO
TLTRO II
TLTRO III
US dollar operations
Excess liquidity (right-hand scale)

ECB Occasional Paper Series No 304 / September 2022
17
Table 1
Main TLTRO III parameters before and after the outbreak of the COVID-19 pandemic
TLTRO III (pre-pandemic)
TLTRO III (until end 2021)
Operations
7 quarterly operations from September 2019 to
March 2021
10 quarterly operations from September 2019 to
December 2021
Maturity
3 years
Eligible loans
Loans to euro area NFCs and households, excluding loans for house purchases
Borrowing allowance
30% of the eligible loans
55% of the eligible loans
Interest rate
Between the MRO rate and DFR (average over
the life of the operations)
Between the MRO rate and DFR (average over the
life of the operations)
From June 2020 to June
2021 (special interest
rate period)
Between the MRO rate -
50 bps and DFR -50 bps
(average between June
2020 and June 2021)
From June 2021 to June
2022 (additional special
interest rate period)
Between MRO rate -50
bps and DFR -50 bps
(average between June
2020 and June 2021)
Benchmark net
lending (BNL)
Based on eligible net lending in the 12-month period to 31 March 2019
Positive eligible net lending: BNL = 0
Negative eligible net lending: BNL = eligible net lending in that period
Lending performance
thresholds
From 1 April 2019 to 31 March 2021: threshold of
at least 2.5% relative to benchmark outstanding
amount
16
From 1 April 2019 to 31
March 2021
Threshold of at least
1.15% relative to the
benchmark outstanding
amount
From 1 March 2020 to 31
March 2021 (special
reference period)
Threshold of at least 0%
relative to the BNL
From 1 October 2020 to
31 December 2021
(additional special
reference period)
Threshold of at least 0%
relative to the BNL
Voluntary repayment
options
Two years from settlement for each operation, at a
quarterly frequency
One year from settlement for each operation,
starting in September 2021, except for the last
three operations with the early repayment option
available from June 2022, at a quarterly frequency
Source: ECB.
Note: pre-pandemic parameters refer to the TLTRO III conditions from February 2020, and end-2021 parameters indicates the TLTRO
III conditions since March 2021, after the last enhancement of the TLTRO III parameters in December 2020.
Participation in TLTRO III reached record levels compared with the TLTRO I
and II series allotted between 2014 and 2017. The very favourable conditions of
the TLTRO III programme incentivised broad-based participation across euro area
banks. Participation per country was less concentrated compared with past series.
While under TLTRO II banks from Italy and Spain borrowed overall more than half of
the total outstanding amount, under TLTRO III their share declined to 37% over the
life of the operations. On the other hand, banks in France and Germany showed the
opposite behaviour, increasing their overall share from 28% under TLTRO II to 41%
under TLTRO III. Most of the participation took place following enhancement of the
borrowing conditions, namely under TLTRO III.4 in June 2020 and under TLTRO III.7
in March 2021 (Chart 7). The June 2020 TLTRO III operation, which marked the
beginning of the special interest rate period, saw the highest take-up, with 742 banks
participating for a total of €1,308 billion. In September 2021, Eurosystem outstanding
credit operations reached a new all-time high (€2,230 billion), doubling the peak
16
The benchmark outstanding amount is equal to the eligible stock of credit on 31 March 2019 plus the
BNL.

ECB Occasional Paper Series No 304 / September 2022
18
reached with the three-year LTROs programme in 2012. During the review period,
TLTROs represented, on average, more than 95% of the total outstanding
refinancing operations.
Banks have repaid €139 billion on the early repayment options dates for
TLTRO III in 2021. In the early repayment round in September 2021, 137
participants repaid a total of €79 billion, while in December 2021 a total of 72
participants repaid €60 billion. The net reduction in TLTRO usage of these banks
was, however, much lower (€35 billion) given that a large share of the funds was
repaid to be rolled over into the ninth or tenth TLTRO III series (with a longer
remaining maturity).
Chart 7
TLTRO III outstanding amounts and share of average TLTRO II and III outstanding
amounts
(EUR billions)
Source: ECB.
Note: The chart shows the outstanding amounts after the last TLTRO III operation. The share of average TLTRO II and TLTRO III
outstanding amounts considers the entire period under analysis.
Almost 92% of the participating banks met the special criteria (i.e. exceeded
the benchmark net lending in the special reference period) and benefited from
the most favourable interest rate applicable until June 2021. Around 3% of
banks did not exceed the special criteria but exceeded the initial criteria (i.e.
exceeded the net lending benchmark for the second reference period), and therefore
paid the DFR on their TLTRO III operations (Chart 8).
17
Banks that did not reach
their net lending benchmarks in any of the aforementioned reference periods – in
total, 5% of banks – obtained the less favourable interest rate, i.e. the MRO rate until
June 2020 and after June 2021, and the MRO rate minus 50 basis points during the
period between June 2020 and June 2021. Banks’ lending performance over the
additional special interest rate period was communicated in June 2022.
17
Note that 20% of these banks only partially exceeded the initial criteria i.e. the lending growth was
positive but lower than 1.15%. In these cases, the interest rate applied was between the average MRO
rate and the average DFR over the life of the operations.
0%
6%
12%
18%
24%
30%
36%
0
100
200
300
400
500
600
FR IT DE ES NL BE AT GR PT FI LU IE Others
TLTRO-III.1
TLTRO-III.2
TLTRO-III.3
TLTRO-III.4
TLTRO-III.5
TLTRO-III.6
TLTRO-III.7
TLTRO-III.8
TLTRO-III.9
TLTRO-III.10
Share of average TLTRO III outstanding amount (right-hand scale)
Share of average TLTRO II outstanding amount (right-hand scale)
0
500
1,000
1,500
2,000
2,500
EA

ECB Occasional Paper Series No 304 / September 2022
19
Chart 8
TLTRO III outstanding amounts by lending performance category
(EUR billions)
Source: ECB.
4.2 PELTROs, LTROs, MROs and the MLF
The ECB launched additional LTROs and PELTROs as temporary liquidity
backstops following the outbreak of the COVID-19 crisis. The additional LTROs
were designed to bridge liquidity needs until settlement of the fourth TLTRO III
operation in June 2020 – which was the first chance for banks to participate under
the eased TLTRO III conditions. The operations were offered at the DFR and,
compared with TLTRO III, without conditions, thereby allowing banks to swiftly
participate and build (precautionary) liquidity buffers. The volume of operations
peaked at around €390 billion in June 2020. The additional LTROs were
complemented by PELTROs, introduced in April 2020, to ensure sufficient liquidity
provision for banks that did not, or could not, participate in the TLTRO III series,
given their business models and the related availability and type of loan portfolios.
These operations were provided at an interest rate 25 basis points below the MRO
rate and had a maturity ranging from 8 to 16 months. Four additional PELTROs were
allotted in 2021. Outstanding PELTROs peaked at around €28 billion in July 2021.
Regular liquidity-providing refinancing operations continued to represent only
a small fraction of total Eurosystem lending. The regular refinancing operations,
i.e. the three-month LTROs and MROs, are currently only used by a small number of
banks. The operations have a maturity of three months and one week respectively,
and are both conducted under a full allotment procedure: MROs are conducted at an
interest rate at the MRO rate (which was maintained at 0% during the review period);
LTRO operations are conducted at the average MRO rate. The large amount of
excess liquidity in the system and the availability of more favourable TLTROs and
PELTROs reduced banks’ demand for MROs and three-month LTROs. The average
outstanding amounts in MROs and three-month LTROs during the period under
review were around €0.6 billion and €1.2 billion respectively. Average recourse to
these operations decreased by around €7 billion in 2020-21 compared with the
0
500
1,000
1,500
2,000
2,500
09/19 12/19 03/20 06/20 09/20 12/20 03/21 06/21 09/21 12/21
Thousands
Exceeded the special criteria
Exceeded the initial criteria only
Partially exceeded the initial criteria
Exceeded none of the criteria
Not defined yet

ECB Occasional Paper Series No 304 / September 2022
20
previous two years. From a country perspective, participation in regular MROs and
three-month LTROs was concentrated in Germany and Italy (around 75% of the
average volume over the review period).
18
Recourse to the MLF was occasional and due to unexpected payments or
technical failures. The MLF allows eligible counterparties to obtain overnight
liquidity at an interest rate above the MRO rate. The facility is designed to cover
specific liquidity shortfalls caused either by market developments or by technical
issues affecting the settlement of counterparties’ payments at a time of the day when
the counterparty is not able to find alternative funding on the market. Over the review
period the MLF rate remained constant at 0.25%, while recourse remained limited,
averaging just €12 million per day, which represents a significant reduction in
comparison with the daily average of €71 million in the previous review period. There
was, indeed, no participation in the MLF for almost two-thirds of the days in the
review period, while usage of the facility exceeded €100 million on only 12 days.
With more reserves available, counterparties increasingly used these to fund their
payments, thereby reducing their use of intraday credit.
19
In turn, lower intraday
credit meant that the likelihood of the automatic MLF being used at the end-of-day
decreased
20
. Occasional spikes above €100 million were mostly related to
unexpected payment outflows occurring late in the day and technical failures
impeding the correct settlement of upcoming inflows.
4.3 US dollar credit operations
US dollar tenders proved to be an important stabilising tool after the outbreak
of the pandemic, easing US dollar funding strains. Amid high volatility and risk
aversion, US dollar funding conditions for euro area banks deteriorated significantly
following the outbreak of the pandemic.
21
In response, the ECB and other major
central banks announced coordinated action to enhance the provision of US dollar
liquidity to banks outside the United States through the standing swap line (Section
4.4), and by lowering the rate to the OIS rate + 25 basis points
22
and reintroducing a
18
Smaller participation was recorded in Austria, France and Greece (around 6%, 4% and 2% respectively
of the average volume over the review period), while it was negligible or null in other jurisdictions.
19
Intraday credit is credit provided during the day free-of-charge and against eligible collateral (see point
(26) of Article 2 of Guideline of the European Central Bank of 5 December 2012 on a Trans-European
Automated Real-time Gross settlement Express Transfer system (TARGET2)(ECB/2012/27). If a
Eurosystem eligible counterparty does not repay the intraday credit by the end of the TARGET2
business day, its recourse is automatically converted into MLF and the MLF rate is applied.
20
See ECB (2021b).
21
For instance, the 3-month US funding premium in the EUR/USD foreign exchange swap market
peaked at roughly 140 basis points on 19 March 2020, surging from a daily average of 20 basis points
during January and February 2020 (Chart 9).
22
In October 2008, when the fixed-rate full allotment tender procedures were introduced, the pricing of
US dollar operations was changed from the rate charged in the Federal Reserve’s Term Auction Facility
(TAF) to a fixed rate of 100 basis points above the corresponding OIS rate. In November 2011, the
price was further reduced to OIS + 50 basis points, which remained in place until 15 March 2020, when
the Federal Reserve, the ECB, the Bank of Japan, the Bank of England, the Swiss National Bank and
the Bank of Canada introduced a new pricing.

ECB Occasional Paper Series No 304 / September 2022
21
weekly tender with a maturity of 84 days in addition to the existing 7-day operation.
23
Shortly thereafter, the frequency of the 7-day tender was increased from weekly to
daily.
24
These measures not only improved market sentiment by offering an effective
backstop, but also allowed banks to meet their funding needs immediately, easing
stress in US funding markets.
25
On 18 March 2020, the Eurosystem allotted USD 76
billion to 44 bidders under the 84-day operation and USD 36 billion to 22 bidders
under the 7-day operation. The total allotment of USD 112 billion on 18 March was
the highest in a single day since 2008. Usage of the facilities remained high during
the rest of March and April 2020, with the outstanding amount of US dollars
borrowed from the Eurosystem reaching an 11-year high of USD 145 billion in June
2020 (Chart 9).
Chart 9
USD funding conditions and usage of the Eurosystem USD facilities
(left-hand scale: EUR millions; right-hand scale: basis points)
Source: ECB and Bloomberg.
As US dollar funding conditions gradually normalised, recourse to US dollar
tenders dropped, in line with the backstop function of the facility. Starting in the
second half of April 2020, US funding conditions progressively improved, leading to a
decline in usage of the US dollar facility, which quickly lost its economic appeal.
Consequently, usage of US dollar swap lines dropped significantly over time. On 21
April 2020 the Eurosystem saw no bids for the first time since the onset of the
pandemic, with nil-bid operations becoming increasingly frequent thereafter. In June
2020 the average allotment per operation was USD 250 million, against over USD
600 million in May and roughly USD 10 billion between mid-March and mid-April.
The average take-up per operation remained low for the rest of 2020 and in 2021,
standing at USD 136 million between September 2020 and December 2021 as US
23
Enhancement of the swap line facilities was announced by the Federal Reserve, the ECB, the Bank of
Japan, the Bank of England, the Swiss National Bank and the Bank of Canada on 15 March 2020. For
more details, see the corresponding press release. The 84-day US dollar operation was reactivated for
the first time since 2014.
24
For more details, see the corresponding press release.
25
ECB (2020c).
0
20
40
60
80
100
120
140
160
0
20,000
40,000
60,000
80,000
100,000
120,000
140,000
160,000
01/20 04/20 07/20 10/20 01/21 04/21 07/21 10/21
Outstanding amount
US funding premium in the EURUSD foreign exchange swap market (right-hand scale)
Allotted amount in the 7-day operation
Allotted amount in the 84-day operation

ECB Occasional Paper Series No 304 / September 2022
22
dollar financing conditions broadly continued to be favourable.
26
Following the
improvement in US dollar funding conditions in offshore markets and the
corresponding drop in the use of the US dollar facility, the frequency of the 7-day
operation was gradually reduced from daily to three times a week from July 2020
and from three times a week to weekly from September 2020, while the weekly 84-
day operation was discontinued from July 2021.
4.4 The Eurosystem repo facility for central banks (EUREP)
and other repo agreements and foreign exchange swaps
with foreign central banks
Foreign-exchange (FX) swap and repo lines are arrangements between central
banks that are used to provide domestic banks with funding in foreign
currencies. These operations have a backstop function aimed at preventing or
easing cross-currency frictions. The swap line between the ECB and the Federal
Reserve is, for example, used by the ECB to lend to US dollars to euro area banks
with US dollar credit operations. Similarly, several FX swap and repo agreements
27
,
including the Eurosystem repo facility for central banks (EUREP), were established
to increase euro availability to central banks outside the euro area.
These two types of arrangement are designed to help domestic banks, through
the related credit operations offered by their respective central banks, to
satisfy their foreign currency needs during periods of market stress,
supporting the restoration of orderly market conditions. In normal times, there is
little systematic use of these arrangements given that market pricing would be more
favourable. However, if funding conditions become dysfunctional, as was the case at
the onset of the COVID-19 pandemic, participation in the swap and repo lines
becomes more attractive and helps banks to satisfy their structural and immediate
funding needs, supporting the restoration of orderly market conditions. The mere
existence of precautionary liquidity arrangements has a calming effect on investors,
helping to maintain orderly market functioning.
The extension of the network of liquidity arrangements with other central
banks also ensured access to foreign liquidity during the pandemic period.
Following the outbreak of COVID-19, liquidity demand for precautionary and cash
management purposes surged globally, while heightened risk aversion hindered the
circulation of liquidity on a cross-border basis. Central banks around the world
reacted by reactivating and extending their network of swap and repo lines. In
particular, alongside the outstanding agreements, the Eurosystem swiftly reactivated
26
Occasional spikes in participation in the US dollar facility were observed at quarter-ends and especially
at year-ends, when, given tax considerations and regulatory requirements, banks are typically reluctant
to expand their balance sheet for intermediation activities, leading to tighter US dollar funding
conditions. However, during the review period, usage of the US dollar facility at quarter-ends remained
in line with the seasonal trend and, overall, was limited to a few counterparties.
27
From the Eurosystem perspective, swap line agreements allow the ECB to borrow foreign currency
from a foreign central bank against euro, with the promise to repay the borrowed currency plus a pre-
agreed interest rate on a specified future date. Under a repo line, a foreign central bank can borrow
euro from the ECB for a specific period at a pre-agreed interest rate in exchange for eligible assets
denominated in euro that are mobilised as collateral.

ECB Occasional Paper Series No 304 / September 2022
23
its swap line agreement with the Danish National Bank and set up temporary
precautionary swap line agreements with the Croatian National Bank and the
Bulgarian National Bank. In addition, the Eurosystem established temporary bilateral
repo lines with several other non-euro area central banks, namely the National Bank
of Romania, the Bank of Albania, the National Bank of North Macedonia, the
National Bank of Serbia, the Central Bank of the Republic of San Marino and the
Hungarian National Bank (Table 2). Finally, to complement the set of liquidity
agreements arranged with non-euro area counterparties, the ECB introduced the
Eurosystem repo facility for central banks (EUREP) in June 2020 as a precautionary
backstop to address pandemic-related euro liquidity needs outside the euro area.
Like other temporary pandemic-related measures, EUREP is a temporary facility and
will be available until January 2023.
28
Table 2
Overview of operational liquidity lines
Non-euro area counterpart
Type of arrangement
Reciprocal
Българска народна банка (Bulgarian National Bank)
Swap line
No
Danmarks Nationalbank
Swap line
No
Hrvatska narodna banka
Swap line
No
Sveriges Riksbank
Swap line
No
Bank of Canada
Swap line
Yes
People’s Bank of China
Swap line
Yes
Bank of Japan
Swap line
Yes
Swiss National Bank
Swap line
Yes
Bank of England
Swap line
Yes
Federal Reserve System
Swap line
Yes
Magyar Nemzeti Bank
Repo line
No
Banca Naţională a României
Repo line
No
Bank of Albania
Repo line
No
National Bank of North Macedonia
Repo line
No
Central Bank of the Republic of San Marino
Repo line
No
National Bank of Serbia
Repo line
No
Source: ECB.
Note: The table does not include repo lines established with non-euro area central banks under EUREP, for which the ECB does not
disclose its counterparties.
28
In view of the highly uncertain environment caused by the Russian invasion of Ukraine and the risk of
regional spillovers that could adversely affect euro area financial markets, on 10 March 2022 the
Governing Council decided to extend the EUREP facility until 15 January 2023.

ECB Occasional Paper Series No 304 / September 2022
24
5 Counterparty framework
The Eurosystem counterparty framework sets the eligibility criteria that euro area
credit institutions must comply with in order to be granted access to MPOs.
29
The
framework is designed to ensure that a broad range of counterparties may
participate in Eurosystem MPOs, while protecting the Eurosystem from the risk of a
counterparty defaulting. Over the review period the Eurosystem counterparty
framework was amended to: 1) introduce a more direct mapping of failures to meet
minimum regulatory requirements to restrictions in counterparty access to
Eurosystem MPOs, i.e. some automaticity in the application of discretionary
measures, and 2) be aligned with the treatment of the leverage ratio requirement
under the Capital Requirements Regulation (CRR)
30
, which is relevant for assessing
financial soundness as required under the GD.
5.1 Eligibility criteria and discretionary measures
Eligibility criteria for participation in Eurosystem MPOs remained largely
unaltered in the review period. To qualify as an eligible counterparty, a credit
institution needs to
31
:
1. be subject to Eurosystem’s minimum reserve requirements;
2. be supervised by competent authorities;
3. be financially sound; and
4. fulfil the operational requirements of the local NCB for participation in MPOs.
32
The first requirement grants euro area credit institutions access to MPOs. The
second and third requirements provide the Eurosystem with a first layer of risk
protection. Financial soundness requires assessment by the Eurosystem, which may
take into account prudential information on capital, leverage and liquidity ratios.
33
In 2021 the Eurosystem enhanced the efficiency and consistency of
application of the counterparty framework. The Eurosystem may suspend, limit,
or even exclude, an individual counterparty’s access to MPOs if that counterparty is
29
Monetary policy eligible counterparties (MPECs) are defined as counterparties having access to either
liquidity-providing operations and/or liquidity-absorbing operations and/or to standing facilities.
Counterparties for outright purchases are not MPECs. MPECs are a subset of euro area credit
institutions subject to minimum reserve requirements, the number of such institutions having decreased
from 4,462 to 4,308 during the review period.
30
Regulation (EU) No 575/2013 of the European Parliament and of the Council of 26 June 2013 on
prudential requirements for credit institutions and investment firms and amending Regulation (EU)
No 648/2012 (OJ L 176, 27.6.2013, p. 1).
31
Article 55 of the General Documentation.
32
Access to Eurosystem MPOs is granted by the relevant NCB to counterparties that fulfil the eligibility
criteria set in line with the decentralised monetary policy implementation in the euro area.
33
Article 55a of the General Documentation.

ECB Occasional Paper Series No 304 / September 2022
25
in breach of the eligibility criteria.
34
Until 2021 the Eurosystem determined which of
the three above-mentioned actions was warranted by assessing the specific case
concerned.
35
On 1 January 2021 the Eurosystem adopted a more rule-based
approach to this process aimed at enhancing its internal efficiency and ensuring
consistent application of the framework across counterparties. Specifically, when
own funds requirements are breached, the Eurosystem limits the counterparty’s
access to MPOs, on the grounds of prudence, to the level prevailing when that non-
compliance is notified to the Eurosystem. If compliance with own funds requirements
has not been restored at the latest within 20 weeks from the identification of the non-
compliance, the counterparty’s access to MPO is suspended. Similarly, if the
required information related to own funds requirements is incomplete or not
available, the Eurosystem may limit a counterparty’s access to MPOs 14 weeks after
the reference date, and may suspend the counterparty after 20 weeks.
36
Over the
review period, 17 banks were the subject of Eurosystem discretionary measures,
namely three limitations and 14 suspensions.
37
The counterparty framework rules relevant for assessing financial soundness
were amended in line with the relevant EU prudential regulation. To ensure
consistency with the regulatory framework, the Eurosystem adopted the relevant
definitions under the CRR. Consequently, on 28 June 2021, when the regulatory
requirement making the leverage ratio binding came into force
38
, the Eurosystem
aligned treatment of the leverage ratio requirement in the Eurosystem counterparty
framework with that of the existing Pillar 1 own funds requirements.
39
Since then,
fulfilment of the leverage ratio requirement has been monitored on a regular basis as
is the case with capital ratios. Accordingly, breaches and incomplete reporting of the
leverage ratio trigger the discretionary measures explained above.
5.2 Counterparties’ developments
Over the review period the number of monetary policy eligible counterparties
(MPECs) continued to decrease, mainly on the back of consolidation of the EU
banking sector. By the end of 2021, 1,869 credit institutions classified as MPECs
(out of the 4,308 credit institutions in the euro area at the end of the reference
period). The change in the number of MPECs was mainly driven by corporate events
that to some extent reshaped the EU banking system, with a net overall decrease in
MPECs of 148 over the review period (Chart 10a). The net decrease was mainly due
34
Article 158 of the General Documentation.
35
If a counterparty is suspended or excluded from access to MPOs, it must repay the outstanding credit
operations (including accrued interest) in full, by a date decided by the Eurosystem. Under a limitation,
the counterparty does not have to repay its outstanding credit operations (but may not increase its
borrowed amount). The Eurosystem may revoke a limitation or suspension, but exclusions are
expected to be permanent.
36
Where this occurs, just as before 2021, the Eurosystem may limit access to MPOs once the reporting
breach is detected and until either (1) the counterparty reports the relevant information, or (2) the
counterparty is suspended.
37
Of these banks, 5 counterparties re-gained access to MPOs during the review period.
38
The binding leverage ratio requirement is usually 3%, unless adjusted in accordance with Article
429a(7) of Regulation (EU) No 876/2019 (CRR2).
39
Common Equity Tier 1 capital ratio (4.5%), Tier 1 capital ratio (6%), total capital ratio (8%).

ECB Occasional Paper Series No 304 / September 2022
26
to the voluntary withdrawal by the counterparties concerned from their status as
Eurosystem eligible counterparties, followed, in order of relevance, by consolidation
activities, cessation of activity due to the withdrawal of banking licences, liquidations
and closures (typically of foreign branches). At the same time, some new banks were
established across the euro area, thereby partially offsetting the decrease.
The majority of new MPECs participated in at least one credit operation, while
access requests for intraday credit and the MLF were mainly precautionary.
When applying for access to Eurosystem credit operations, credit institutions may
also request access to Eurosystem MPOs, including the standing facilities and
intraday credit, depending on their business needs. In the period under review more
than 70% of new eligible counterparties, amounting in total to 63 new MPECs,
participated in one or more credit operations soon after having become eligible, while
the remainder mainly requested access on precautionary grounds. Just 40% had
recourse to intraday credit or overnight credit through the MLF (Chart 10b). This
suggests that the intention to participate in longer tenor operations, such as TLTRO
III operations, may have been the main driver for new access requests over the
review period.
Chart 10
Developments in MPECs
a) Drivers of the net decrease in the number
of MPECs
b) Use of Eurosystem facilities by newly
eligible MPECs
(units)
(percentages per annum)
Source: ECB
Notes: the left panel: ‘New MPEC accesses’ identify either new banks or banks that have requested access as an eligible counterparty
to any Eurosystem facility in the review period. ‘Withdrawal by counterparties’ identifies banks that voluntarily withdrew from
Eurosystem facilities. ‘Consolidation’ identifies the net figure for merger and acquisition activity in terms of legal entities having access
to Eurosystem facilities. ‘Cessation of bank activity’ identifies banking licence withdrawals, and bank closures or liquidation. The right
panel: ‘active MPECs’ identifies newly eligible MPECs that made use of the facility at least once in the period under review; ‘inactive
MPECs’ identifies newly eligible MPECs that made no use of the facility in the period under review. ‘Longer tenors’ refers to MROs,
LTROs and TLTROs. ‘Intraday/overnight’ identifies use of intraday credit and/or marginal lending facilities by the end of the day.
0%
10%
20%
30%
40%
50%
60%
70%
80%
90%
100%
Longer tenors Intraday/overnight
Number of active MPECs
Number of inactive MPECs

ECB Occasional Paper Series No 304 / September 2022
27
6 Collateral framework
The Eurosystem collateral framework regulates the collateralisation of Eurosystem
credit operations and provides a second layer of protection against counterparty
default
40
. In the period under review, the temporary collateral easing measures in
response to the pandemic were the major innovation. In addition, the Eurosystem
extended collateral eligibility to sustainability-linked bonds, made the necessary
adaptations following Brexit and introduced adjustments to increase transparency
and reduce the overall complexity of the Eurosystem collateral framework.
41
6.1 Changes to the collateral framework
Collateral rules were temporarily broadened in response to the emergency
created by the COVID-19 pandemic. The Eurosystem introduced temporary
collateral easing measures in April 2020
42
, these being further extended in
December 2020 until June 2022. The measures included an increase in the types of
credit claims that were eligible as collateral (including loans benefiting from the
guarantee schemes adopted in euro area Member States in response to the
pandemic), the maintenance of eligibility – under some conditions – for assets that
fulfilled credit quality requirements at the onset of the pandemic, a reduction in
collateral valuation haircuts by a fixed factor of 20%, and a waiver of the minimum
rating requirement for marketable debt securities issued by the Hellenic Republic.
These measures were introduced to facilitate the availability of eligible collateral for
Eurosystem counterparties to be able to participate in liquidity-providing operations,
such as the TLTRO III series, and to facilitate an increase in bank funding against
loans to corporates and households. ECB estimates suggest that collateral easing
measures have contributed to approx. 23% of the total increase in the value after
haircuts of mobilised collateral since the start of the pandemic and account for 10%
of the currently mobilised collateral (Chart 11)
43
. The increase in collateral value due
to these collateral easing measures was predominantly driven by the expansion of
additional credit claim frameworks (€162 billion) and by the temporary haircut
reduction (€113 billion). In March 2022 the ECB announced the gradual phase-out of
the pandemic collateral easing measures in three stages between July 2022 and
March 2024
44
.
40
For further information on how the collateral framework has been developed over the years, see
Bindseil et al. (2017).
41
See Guideline (EU) 2020/1690 of the European Central Bank of 25 September 2020 amending
Guideline (EU) 2015/510 on the implementation of the Eurosystem monetary policy framework
(ECB/2020/45).
42
For further details, see the ECB press releases of 7 April 2020 and 22 April 2020.
43
The analysis covers the period between 27 February 2020 and 30 September 2021.
44
For further details, see the ECB press release of 24 March 2022.

ECB Occasional Paper Series No 304 / September 2022
28
Chart 11
Impact of temporary collateral easing measures on mobilised collateral value
(EUR billions)
Source: ECB, Eurosystem and ECB calculations.
Notes: The bar chart shows the mobilisation of Eurosystem-eligible collateral by asset category, and the values are after valuation and
haircuts. The first observation shows the composition of collateral before the outbreak of the pandemic, on 27 February 2020. The
cross-shaded areas in the bars on the right-hand side show the total collateral value due to the collateral easing measures for the
respective asset category on 30 September 2021.
The expansion of the additional credit claim (ACC) frameworks significantly
increased the availability of non-marketable assets as collateral. The revised
framework has allowed NCBs to additionally accept loans to small and medium-sized
enterprises or self-employed individuals as collateral provided that they are covered
by COVID-19-related government and other public sector guarantee schemes.
45
In
addition, several other measures were implemented to broaden the availability and
ease the mobilisation of ACCs.
46
Box 2 reviews the principles behind acceptance of
government/public sector guaranteed loans into the ACC framework.
The eligibility ‘freeze’ shielded collateral from potential downgrades that could
have reduced the availability of marketable assets. At the outbreak of the
pandemic, a sudden shortage in collateral availability due to a wave of potential
downgrades could have depressed banks’ lending activity and exacerbated the crisis
in a procyclical manner. To pre-empt this, on 7 April 2020 the Eurosystem
temporarily froze the eligibility of marketable assets that fulfilled minimum credit
quality requirements, provided that the asset ratings remained above credit quality
step 5
47
and all other eligibility requirements were fulfilled. Assets that fell below the
minimum credit quality requirements were subject to haircuts based on their actual
45
The ACC framework was introduced in 2012 and regulates credit claims that do not fulfil all the
eligibility criteria applicable under the general collateral framework. Until the 2020 extension, ACCs
included pools of loans to households as well as pools of similar kinds of loans, consisting of, for
instance, corporate loans, small and medium-sized enterprise (SME) loans, consumer loans or
mortgages (consumer loans and mortgages are loans to households; individual ACCs include only
loans to corporates/SMEs). ACCs could also be of lower credit quality than the generally accepted
credit claims or be denominated in currencies other than the euro.
46
The measures included: 1) expansion of the scope of acceptable credit assessment systems. For
example, several NCBs with an in-house credit assessment system (ICAS) decided to complement
their existing ICASs with more resource-efficient statistical ICAS (see Box 1 in Auria et al. (2021)) and
other NCB-specific credit assessment approaches, or by easing acceptance of banks’ own credit
assessments from internal rating-based systems that were approved by supervisors; 2) a reduction in
ACC loan level reporting requirements. In addition, it should be noted that some NCBs created new
ACC frameworks or expanded their existing ACC frameworks to features were already acceptable
before the pandemic.
47
Equivalent to a rating of BB. For ABS the threshold of credit quality step 4 (BB+) applied.

ECB Occasional Paper Series No 304 / September 2022
29
ratings. Additionally, under the temporary changes introduced in response to the
pandemic, NCBs were permitted to accept as collateral marketable debt securities
issued by the Hellenic Republic, for which the minimum rating requirement was
temporarily waived.
The Eurosystem further supported the provision of credit by increasing its risk
tolerance by lowering the haircuts applied, by increasing the concentration
limit for unsecured bank bonds, and by lowering the minimum size threshold
for domestic credit claims. First, valuation haircuts were temporarily reduced by a
fixed factor of 20% across all eligible marketable and non-marketable collateral asset
categories, thereby tolerating more risk on the Eurosystem’s balance sheet in
response to the COVID-19 pandemic crisis
48
. Second, the concentration limit for
unsecured bank bonds was increased from 2.5% to 10%, enabling counterparties to
hold a larger share of such assets in their collateral pools. Third, the Eurosystem
lowered the minimum size threshold for domestic credit claims
49
from €25,000 to €0
to facilitate the mobilisation as collateral of loans to small corporate entities.
As part of the regular collateral framework development, the Eurosystem
began accepting sustainability-linked bonds (SLBs). From 1 January 2021, SLBs
started to be accepted as collateral for Eurosystem credit operations, as well as for
outright purchases for monetary policy purposes, provided that they complied with all
the other eligibility criteria. Specifically, such bonds were deemed to be eligible as
collateral if they had coupon structures linked to certain sustainability performance
targets relating to one or more of the environmental objectives set out in the EU
Taxonomy Regulation and/or to one or more of the United Nations Sustainable
Development Goals relating to climate change or environmental degradation. This
decision further broadened the universe of Eurosystem-eligible marketable assets
and signalled the Eurosystem’s support for innovation in the area of sustainable
finance.
From 1 January 2021, after the end of the Brexit transition period, certain
marketable and non-marketable assets became ineligible. There are various
references to the EU, EEA and non-EEA G10 assets in the GD and the temporary
frameworks which resulted in the ineligibility of some assets. However, certain other
48
The temporary haircut reduction by 20% complemented the Governing Council decision at the same
time to adjust the haircuts applied to non-marketable assets as part of the regular review of its risk
control framework.
49
The minimum size threshold for domestic credit claims is non-uniform between NCBs, that can decide
on a higher minimum amount for their jurisdiction.

ECB Occasional Paper Series No 304 / September 2022
30
assets linked to the United Kingdom remained eligible following the change of United
Kingdom’s status to a non-EEA G10 country on 1 January 2021
50
.
6.2 Eligibility and mobilisation of collateral
Most of the increase in eligible marketable assets during the review period was
due to government securities on the back of significant issuances. Between the
first quarter of 2020 and the fourth quarter of 2021 eligible marketable assets
increased from €14,296.3 to €16,352.6 billion, around 76% of which was attributable
to government securities (Chart 12a). These developments were mainly attributable
to the fiscal response to the COVID-19 crisis in terms of government issuances. The
remaining increase was due to corporate bonds, covered bonds and other
marketable assets
51
. On the other hand, eligible unsecured bank bonds and asset-
backed securities decreased by approximately €85 billion on aggregate.
50
Since 1 January 2021, the following assets have no longer been eligible as a direct consequence of the
United Kingdom having left the EU and the EEA: (i) unsecured debt instruments issued by credit
institutions or investment firms, or by their closely-linked entities, that are established in the United
Kingdom (Article 81a of the “General framework”); (ii) asset-backed securities whose issuer or
originator is established in the United Kingdom (Article 74 of the “General framework”); (iii) asset-
backed securities in which the acquisition of the cash-flow-generating assets by the special purpose
vehicle (SPV) is governed by UK law (Article 75 of the “General framework”); (iv) asset-backed
securities in which clawback rules are governed by UK law (Article 76 of the “General framework”); (v)
assets denominated in pounds sterling, yen or US dollars whose issuer is established in the United
Kingdom (Article 7 of the “Temporary framework”); (vi) assets with guarantees governed by UK law or
where the guarantor is established in the United Kingdom, unless the guarantee is not needed to
establish the credit quality requirements for the specific debt instrument (Articles 114(4) and 70 of the
“General framework”); (vii) credit claims for which the facility agent is a credit institution located in the
United Kingdom (Article 104(4) of the “General framework”); (viii) debt instruments listed on the London
Stock Exchange other than those admitted to trading on at least one acceptable market as defined by
Article 68(1) of the “General framework” and meeting all the other eligibility criteria. Based on the
United Kingdom’s status as a non-EEA G10 country, euro-denominated debt instruments issued by
entities established in the United Kingdom, but which do not fall into the categories listed above,
continue to be accepted as eligible collateral (in line with Article 70 of the “General framework”).
51
Other marketable assets include debt issued by supranational issuers and agencies.
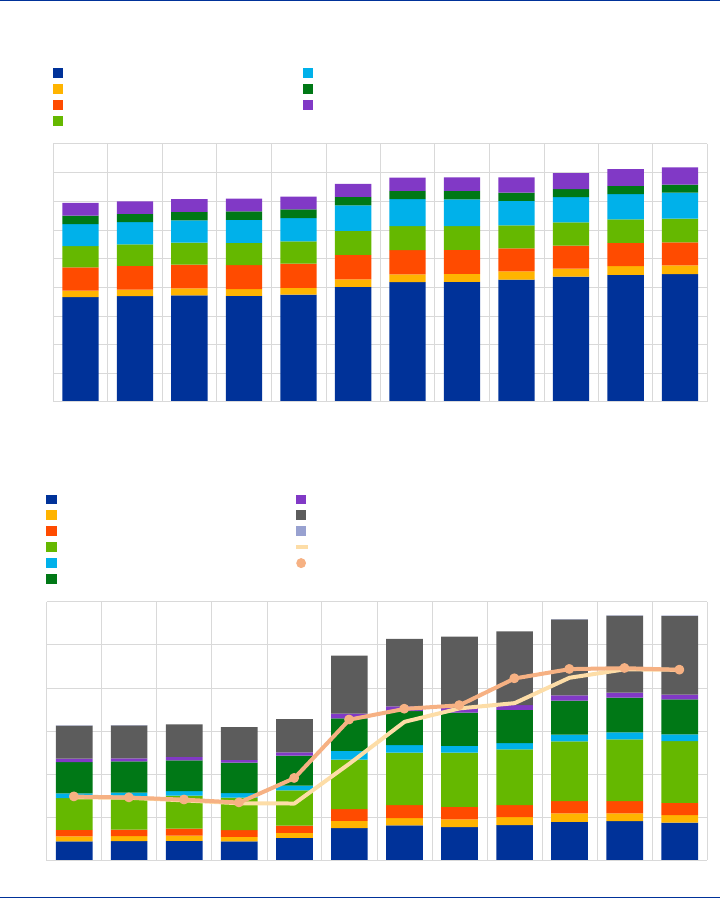
ECB Occasional Paper Series No 304 / September 2022
31
Chart 12
Eligible marketable assets and use of collateral
a) Eligible marketable assets
(EUR billions)
b) Use of collateral and outstanding credit
(EUR billions)
Source: ECB and ECB calculations.
Non-marketable assets represented the bulk of the increase in mobilised
collateral over the review period. Following the collateral easing measures
introduced in 2020, mobilised collateral increased considerably, from €1,636.1 billion
in the first quarter of 2020 to €2,838.8 billion at the end of 2021 (Chart 12b). Credit
claims (including additional credit claims) accounted for the largest share of the
increase during the review period (around 44%), mostly on the back of the expansion
of the ACC framework. Overall, mobilised credit claims more than doubled in
amount, from €384.9 billion in the first quarter of 2020 to €914.9 billion at the end of
2021. For marketable assets, the largest increases in amounts mobilised were
recorded for covered bonds (around 26% of the overall increase), followed by
government securities (around 17% of the overall increase). Unsecured bank bonds,
0
2,000
4,000
6,000
8,000
10,000
12,000
14,000
16,000
18,000
03/19 06/19 09/19 12/19 03/20 06/20 09/20 12/20 03/21 06/21 09/21 12/21
Central government securities
Regional government securities
Unsecured bank bonds
Covered bonds
Corporate bonds
Asset-backed securities
Other marketable assets
0
500
1,000
1,500
2,000
2,500
3,000
03/19 06/19 09/19 12/19 03/20 06/20 09/20 12/20 03/21 06/21 09/21 12/21
Central government securities
Regional government securities
Unsecured bank bonds
Covered bonds
Corporate bonds
Asset-backed securities
Other marketable assets
Credit claims
Fixed-term and cash deposits
Average outstanding credit
Peak outstanding credit

ECB Occasional Paper Series No 304 / September 2022
32
asset-backed securities, corporate bonds and other marketable assets were used to
a lesser extent and accounted for 13% of the overall increase.
Box 2
Acceptance of loans guaranteed by public guarantee schemes within the ACC framework
At the outbreak of the COVID-19 pandemic, the European Commission adopted the State aid
temporary framework to support the economy and address the liquidity shortage faced, in particular,
by non-financial corporates. As one of its measures, this temporary framework enabled EU Member
States to provide public guarantees on loans to ensure that banks kept providing credit to their
business customers. Most EU Member States therefore launched public guarantee schemes.
Through those schemes, EU Member States committed to cover a large portion of the associated
credit risk (up to 100%) and potential losses, the remainder being covered by credit institutions.
Following this development and as part of its response to the outbreak of the pandemic, the
Eurosystem decided to accept as collateral within its ACC framework loans guaranteed by public
guarantee schemes. This collateral was subject to additional risk control measures given that the
features of such guarantee schemes do not comply with the Eurosystem’s ordinary requirements for
guarantees. This new feature of the Eurosystem ACC framework was aimed at facilitating banks’
recourse to central bank liquidity (e.g. TLTRO III series) against loans to corporates and small
businesses in response to the liquidity shock experienced by both the banking sector and the real
economy. Without such guarantees, those loans would have been subject to higher risk-related
haircuts or, particularly in the case of newly originated loans, would have been ineligible under the
Eurosystem collateral framework because they did not provide sufficient protection and because of
the potentially higher default probability of the underlying debtors under the economic
circumstances that existed at that time. The provision of public guarantees on loans served as a
credit-enhancing tool that made it possible for NCBs to temporarily accept the underlying assets as
collateral. Those loans could therefore be used as collateral together with the credit claims
accepted under the permanent framework and those (individual and pools) accepted as ACC
collateral under the temporary framework.
ACCs are a tool at NCBs’ disposal for increasing collateral availability by allowing banks to
transform otherwise ineligible credit claims with low opportunity cost into central bank liquidity,
especially at times of significant liquidity shortages. The large volume of loans on banks’ balance
sheets allows them to generate ample amounts of collateral – after application of appropriately
calibrated haircuts – which can be used to borrow with the Eurosystem. In parallel, in terms of
refinancing, banks can still mobilise more liquid assets with a higher opportunity cost, such as
government bonds, as Eurosystem collateral or, alternatively, use such assets to refinance on the
repo market, depending on the situation of the individual bank and on possible pockets of collateral
scarcity on the repo market. As a by-product, by transforming illiquid assets into central bank
reserves (i.e. high-quality liquid assets (HQLAs)), the increased level of HQLAs facilitates the
fulfilment of counterparties’ LCRs.
Whether or not to adopt and/or expand an ACC framework and its final specification are a matter of
national discretion, meaning that NCBs can adapt the rules governing the eligibility and use of
ACCs to their specific national requirements to meet specific collateral needs in their respective
jurisdictions. This national discretion proved to be particularly relevant in this case given the
heterogeneity in the legal implementation of the public guarantee schemes across jurisdictions. At

ECB Occasional Paper Series No 304 / September 2022
33
the same time, Governing Council oversight ensured a common minimum risk control framework
across the euro area.
The acceptance of ACCs covered by public guarantees required significant resources across the
Eurosystem. NCBs willing to expand their ACC framework conducted a risk management, legal and
operational assessment of their jurisdiction’s public guarantee scheme in order to appropriately
adjust their risk control frameworks, and adapted their internal collateral management systems to
accept the new type of credit claims as collateral. Overall, out of the 17 NCBs that have approved
ACC frameworks in place, 11 adapted their eligibility requirements and risk control framework to
account for the features of their national public guarantee schemes. Although recourse to ACCs
differed substantially across NCBs’ counterparties, by the end of 2021 multiple counterparties
mobilised credit claims benefiting from public guarantee schemes, representing some 22% of the
total Eurosystem ACC collateral.
ECB Occasional Paper Series No 304 / September 2022
34
7 Asset purchase programmes
Asset purchases are generally an important tool to support the monetary policy
transmission mechanism and to provide the degree of policy accommodation needed
to ensure price stability. Several asset purchase programmes were introduced over
the past decade to complement the regular MPOs of the Eurosystem. The ongoing
APP has been conducted since 2014 and aims to enhance the accommodative
stance of monetary policy in an environment where interest rates are at or close to
their effective lower bound. In addition, the PEPP was launched to counter the
serious risks to the monetary policy transmission mechanism and to the outlook for
euro area price stability posed by the COVID-19 outbreak (Chart 13). The PEPP
therefore had a dual role. First, the asset purchases under the PEPP delivered the
monetary accommodation required to ensure that medium-term price stability
continued to be preserved by supporting the economic recovery from the pandemic
crisis. Second, the flexible nature of the PEPP across time, asset classes and
jurisdictions was designed to fulfil a market stabilisation role in an efficient manner.
This section covers the main developments in the implementation of the APP and
PEPP over the reference period.
7.1 Pandemic emergency purchase programme
The Eurosystem’s PEPP was one of the key responses to the outbreak of the
pandemic. The programme was announced on 18 March 2020, and initially
consisted of an envelope of purchases amounting to €750 billion. After two increases
– €600 billion on 4 June 2020 and €500 billion on 10 December 2020 – the envelope
amounts to a total of €1,850 billion. Net purchases under the programme ended in
March 2022. The maturing principal payments from securities purchased under the
PEPP will be reinvested until at least the end of 2024.

ECB Occasional Paper Series No 304 / September 2022
35
Chart 13
10-year government bond yields of selected countries
(percentages per annum)
Source: ECB.
The design of the PEPP entailed flexibility of purchases over time, asset
categories and jurisdictions, allowing the programme to be effective as a
market stabiliser. While the benchmark allocation for purchases of public sector
securities was based on the Eurosystem capital key of the NCBs, the actual
purchases could be conducted in a flexible manner, likewise over time and across
asset classes, on the basis of market conditions (Chart 14). This design feature
ensured that the PEPP could fulfil a market stabilisation role. Moreover, in addition to
the asset categories eligible under the existing APP, a waiver of the eligibility
requirements was granted for securities issued by the Greek Government. Finally,
the eligibility of non-financial CP under the CSPP was expanded to include securities
with a remaining maturity of at least 28 days. These securities could be purchased
under both the CSPP and the PEPP. The residual maturity of public sector securities
eligible for purchase under the PEPP range from 70 days up to a maximum of 30
years and 364 days.
PEPP holdings amounted to €1.581 trillion by the end of 2021, reflecting the
flexible nature of the PEPP. The overall purchase volumes peaked in the first few
months of the programme, with monthly volumes exceeding €100 billion a month in
April, May and June 2020. The majority of PEPP holdings were securities issued by
public sector entities, totalling €1,531 billion and representing over 97% of the total
volume. While deviations from the capital key have decreased to five percentage
points, they amounted to more than 14 percentage points in the March to May 2020
period, illustrating the flexibility of the tool. Moreover, a substantial amount of
(corporate) CP was bought in the first three months of the PEPP, amounting to €35.4
billion. Due to the substantially lower purchases in subsequent months and the short
maturities of those securities, the outstanding holdings of CP in the PEPP declined
to below €4 billion at the end of 2021. At the end of that same year, PEPP holdings
in covered bonds and corporate bonds (excluding CP) accounted for €6 billon and
€40 billion respectively. See Box 3 for the role of the PEPP in the stabilisation and
reduction of volatility in the European government bond market.
-1.5
-1.0
-0.5
0.0
0.5
1.0
1.5
2.0
2.5
3.0
01/20 04/20 07/20 10/20 01/21 04/21 07/21 10/21
Germany
France
Italy
Spain

ECB Occasional Paper Series No 304 / September 2022
36
Chart 14
PEPP flexibility
a) Net PEPP purchase volumes
b) Absolute capital key deviations in public
sector purchases
(EUR billions)
(percentage points)
Source: ECB and ECB calculations.
7.2 Asset purchase programme
The APP continued to support broad-based monetary accommodation during
the review period. At the start of 2020, net purchases under the APP amounted to
€20 billion per month. These monthly amounts were complemented by an additional
envelope of €120 billion on 12 March 2020 to “support favourable financing
conditions for the real economy in times of heightened uncertainty”. The additional
envelope was used until the end of 2020. The APP consists of the public sector
purchase programme (PSPP) and the three smaller private sector programmes,
covering corporate bonds (the CSPP), covered bonds (the covered bond purchase
programme series 3 (CBPP3)) and asset-backed securities (the asset-backed
securities purchase programme (ABSPP)). There were no material changes in the
design of the APP in the review period. The actual monthly profile of net purchases
often diverged somewhat from the average purchase pace set by the Governing
Council, reflecting seasonal fluctuations in market liquidity. Holdings at amortised
cost under the APP increased from €2.58 trillion in December 2019 to €3.12 trillion in
December 2021 (Chart 15).
-50
0
50
100
150
200
250
Mar-May
Jun-Jul
Aug-Sep
Oct-Nov
Dec-Jan
Feb-Mar
Apr-May
Jun-Jul
Aug-Sep
Oct-Nov
2020 2021
Public sector securities
Commercial paper
Corporate bonds
Covered bonds
Asset-backed securities
0
2
4
6
8
10
12
14
16
Mar-May 20
Jun-Jul 20
Aug-Sep 20
Oct-Nov 20
Dec20-Jan21
Feb-Mar 21
Apr-May 21
Jun-Jul 21
Aug-Sep 21
Oct-Nov 21

ECB Occasional Paper Series No 304 / September 2022
37
Chart 15
APP purchases
a) Monthly purchases
(EUR billions)
b) Cumulative purchases
(EUR billions)
Source: ECB. Note: holdings at amortised cost. For Chart a, the additional envelope of €120 billion decided by the Governing Council
on 12 March 2020 has been linearised for illustration purposes, although it was implemented in full in accordance with the established
principles but with additional flexibility.
Public sector purchase programme
The PSPP was announced in January 2015. Under the PSPP purchases are
limited to the secondary market. The allocation of purchases across eligible
jurisdictions is guided, on a stock basis, by the respective NCBs’ subscription to the
ECB’s capital key, as amended over time. A new capital key came into effect on 1
February 2020
52
. Cumulative net PSPP purchases increased by €405 billion during
the period under review and amounted to €2,603 billion at the end of the fourth
quarter of 2021. Since December 2018 the bonds issued by governments and
recognised agencies have made up around 90% of the total Eurosystem portfolio,
52
See the corresponding ECB press release.
-10
0
10
20
30
40
50
60
70
80
90
January
March
May
July
September
November
January
March
May
July
September
November
January
March
May
July
September
November
January
March
May
July
September
November
March
May
July
September
November
January
March
May
July
September
November
January
March
May
July
September
November
2015 2016 2017 2018 2019 2020 2021
PSPP
CBPP3
CSPP
ABSPP
Average monthly APP target
0
500
1,000
1,500
2,000
2,500
3,000
3,500
January
March
May
July
September
November
January
March
May
July
September
November
January
March
May
July
September
November
January
March
May
July
September
November
January
March
May
July
September
November
January
March
May
July
September
November
January
March
May
July
September
November
2015 2016 2017 2018 2019 2020 2021
PSPP
CBPP3
CSPP
ABSPP

ECB Occasional Paper Series No 304 / September 2022
38
while securities issued by international organisations (and also, under the Next
Generation EU (NGEU) investment and reform programme – see Box 4) and
multilateral development banks account for around 10%. The portfolio allocation of
purchases across jurisdictions continues to be adjusted with a view to bringing the
share of the PSPP portfolio into closer alignment with the ECB capital key, subject to
issue and issuer limits, the principle of market neutrality, and other programme
constraints. Chart 16 shows the end-of-year relative deviations from the jurisdictions’
shares as determined by the Eurosystem capital key. Large deviations for Greece
and relatively small jurisdictions reflect the ineligibility of Greece and limited
availability of securities, respectively. Declining deviations from the capital key over
2021 in most jurisdictions highlight the commitment to reduce such deviations
whenever the conditions permitted.
Chart 16
PSPP relative capital key deviations
(percentages)
Source: ECB.
Note: holdings at amortised cost.
Private sector purchase programmes (CSPP, CBPP3 and ABSPP)
The private sector programmes are conducted on the basis of benchmarks
that are broadly in line with market capitalisation. These asset purchase
programmes are built on the eligibility criteria of the collateral framework for the
specific asset categories concerned. The respective benchmarks reflect all eligible
outstanding assets on a proportional basis. In day-to-day implementation of the
programmes, bond purchases are responsive to the availability and liquidity of
individual bonds. Purchases under the private programmes are generally conducted
in both the primary and the secondary markets, but only on the secondary market for
public sector entities under the CSPP. Table 3 provides an overview of the main
settings for the private sector programmes.
-100%
-80%
-60%
-40%
-20%
0%
20%
Spain
Italy
France
Belgium
Austria
Ireland
Germany
Finland
Portugal
Netherlands
Slovenia
Cyprus
Slovakia
Malta
Luxembourg
Lithuania
Latvia
Estonia
Greece
December 2019
December 2020
December 2021

ECB Occasional Paper Series No 304 / September 2022
39
Table 3
Implementation of private sector programmes
Start of the
purchases
Implemented by
Holdings at end
2019
Holdings at end
2021
Redemptions
over 2020-2021
Share of primary
market
purchases at
end 2021
CSPP
Jun 2016
Six NCBs, ECB
coordination
€185 billion
€310 billion
€35.3 billion
22.9%
CBPP3
Oct 2014
Twelve NCBs and
the ECB
€264 billion
€299 billion
€63.4 billion
36.2%
ABSPP
Nov 2014
Six NCBs, ECB
coordination
€28 billion
€29 billion
€20.5 billion
65.4%
Source: ECB.
Private sector holdings increased by €161 billion over the review period. The
greatest contribution to the increase came from the CSPP, under which holdings
increased by €125 billion. Overall, holdings under the private sector programmes are
increasingly being reduced by redemptions. Redemptions in 2020 and 2021
amounted to €119.2 billion, lowering the net impact of gross purchases.
Asset swap spreads for non-financial corporate bonds were very volatile in
2020. They peaked in March-April 2020, and kept declining during the rest of the
review period. Strong Eurosystem presence was one of the drivers of the decrease
in volatility (Chart 17). The spreads progressively tightened after the additional
monetary policy measures related to the pandemic started to take effect. Spread
levels remained relatively stable in 2021.
Chart 17
Asset swap spreads per rating class
a) Corporate bonds
b) Covered bonds
(basis points)
(basis points)
Source: IHS Markit iBoxx indices.
0
50
100
150
200
250
01/20 04/20 07/20 10/20 01/21 04/21 07/21 10/21
EUR Non-Financials A
EUR Non-Financials AA
EUR Non-Financials AAA
EUR Non-Financials BBB
0
10
20
30
40
50
60
70
01/20 04/20 07/20 10/20 01/21 04/21 07/21 10/21
EUR Covered A
EUR Covered AA
EUR Covered AAA

ECB Occasional Paper Series No 304 / September 2022
40
7.3 Securities lending programmes
The Eurosystem offers securities lending programmes to support bond and
repo market liquidity without unduly curtailing normal repo market activity. As
a side effect of the purchase programmes, the decline in the free float of securities in
financial markets could potentially have negative effects on market functioning. In
order to prevent or alleviate such side effects, the Eurosystem offers the majority of
its asset holdings for securities lending (PEPP, PSPP, CSPP and CBPP1, 2 and 3,
as well as the Securities Markets Programme (SMP)). In addition to securities,
counterparties are also allowed to place cash as collateral in PSPP and public sector
PEPP securities lending facilities. This cash collateral variant of securities lending is
subject to an overall limit, which was increased from €75 billion to €150 billion in
November 2021 to reflect, inter alia, the increase in the stock of acquired assets over
time and also to serve the purpose of a backstop.
The PSPP and public sector PEPP securities lending on-loan balance was
increasing during the period under review. In 2020 the average monthly on-loan
balance in the Eurosystem was €39.2 billion, of which €1.8 billion was borrowed
against cash collateral. This increased to an average monthly on-loan balance of
€80.7 billion in 2021, of which €17.7 billion was borrowed against cash collateral.
The peaks in usage of the Eurosystem facilities occurred at quarter-ends and ahead
of futures delivery dates (Chart 18).
Chart 18
PSPP and public sector PEPP securities lending
(EUR billions)
Source: ECB.
Note: On-loan balance of securities, lent by the Eurosystem.
Box 3
The role of the PEPP in the stabilisation and reduction of volatility in the European
government bond market
In times of acute stress, falling asset prices and higher credit risk reduce the capacity of financial
intermediaries to bear risk when duration supply (e.g. through government issuances) increases. In
those situations, asset purchases help stabilise the markets when conducted in large volumes and
0
20
40
60
80
100
120
140
160
180
01/18 04/18 07/18 10/18 01/19 04/19 07/19 10/19 01/20 04/20 07/20 10/20 01/21 04/21 07/21 10/21
Lent against cash collateral
Lent against securities collateral
Futures delivery dates
Quarter-end

ECB Occasional Paper Series No 304 / September 2022
41
in a flexible manner. Large purchase volumes mitigate temporary supply and demand imbalances,
while flexibility makes it possible to target specific asset segments, thereby addressing market
segmentation. Overall, PEPP contributed to a reduction in yield spreads, which was more
significant in size compared with the PSPP
53
. At the same time, PEPP contributed to a reduction in
the volatility. Lower volatility reduces the risk faced by market operators and thus facilitates portfolio
rebalancing towards riskier assets. As a result, compressed volatility supports the smooth
transmission of the monetary policy stimulus generated by purchase programmes. Flexibility plays
an important role also in reducing volatility in the market, since purchases can be distributed over
time to when they are most needed
54
.
This box provides insights into changes in indicators of the functioning of markets, such as market
volatility and correlations between government bond yields.
After the sharp increase in volatility in the aftermath of the pandemic outbreak, a normalisation
phase followed. Chart A (panel a) shows the volatility of the euro area 10-year GDP-weighted yield
since 2011. In 2020-2021 volatility levels of European government bonds' yields progressively
stabilised around multi-year lows. Volatility fluctuated within a narrow range during implementation
of the PEPP, after historic peaks ahead of the start of the programme.
Chart A
Bond yield volatility and correlations
a) Volatility of the euro area 10-year GDP-weighted yield, by quarter – euro area
(standard deviation of daily changes in yield, basis points)
53
ECB (2021).
54
The Eurosystem conducted purchases under the PEPP in a flexible manner, allowing fluctuations in the
distribution of purchase flows over time, across asset classes and among jurisdictions.
Q1
Q2
Q3
Q4
Q1
Q2
Q3
Q4
Q1
Q2
Q3
Q4
Q1
Q2
Q3
Q4
Q1
Q2
Q3
Q4
Q1
Q2
Q3
Q4
Q1
Q2
Q3
Q4
Q1
Q2
Q3
Q4
Q1
Q2
Q3
Q4
Q1
Q2
Q3
Q4
Q1
Q2
Q3
Q4
2011 2012 2013 2014 2015 2016 2017 2018 2019 2020 2021
Interquartile range
Median
Long-term average

ECB Occasional Paper Series No 304 / September 2022
42
b) Correlation between the 10-year German bond yield and 10-year government yields for selected countries,
by year
(correlation coefficient)
Source: ECB Statistical Data Warehouse (SDW), ECB calculations, Bloomberg.
In addition to the general reduction in volatility, a gradual alignment of government yield volatility
among euro area countries can also be observed. Chart A (panel b) shows the correlation between
the 10-year German bond yield and the 10-year government yields for selected countries since
2011. Compared to the 2011/2012 crisis episode, the developments in the correlation coefficients,
which strongly tend toward 1, show lower signs of market segmentation and an easing in conditions
across all the European bond markets during the pandemic crisis. This trend is particularly evident
for Greece, whose government bonds are eligible for the PEPP but not for the APP.
Such developments point towards an improvement in market functioning in the wake of a general
decrease in uncertainty after the most acute phase of the pandemic. Alongside the PEPP, the fiscal
response also contributed to the lower uncertainty (see also Box 4).
Two recent studies on the flexibility embedded in PEPP complemented previous literature
55
claiming that asset purchases tend to be more effective in times of stressed market conditions,
given that they improve risk sentiment and support better market functioning. A first study
56
uses
policy counterfactuals
57
to show that, had the Eurosystem implemented the asset purchases under
the PEPP and the additional APP envelope at a constant-pace (i.e. as under the pre-COVID-19
APP), in March and April 2020, the overall impact of these two measures on long-term government
bond yields (estimated at around 60 basis points) would have been lower by about 15 basis points.
These results appear to show that promptly adjusting the pace of asset purchases in the event of
unforeseen market volatility can play a quantitatively-significant role in stabilising financing
conditions, especially in times of heightened market stress, and thereby preserve the smooth
transmission of monetary policy to the real economy.
A second study
58
focuses on the intraday impact of asset purchases. Using confidential high-
frequency data on the asset purchases carried out by Banca d’Italia in the first half of 2020, it is
55
For example, Cúrdia and Woodford (2011); Vayanos and Vila (2020).
56
Bernardini and Conti (2021).
57
The authors use weekly data and set-up a Structural Bayesian Vector Autoregressive model, which
allows to capture the dynamic feedbacks between central bank asset purchases and market rates, and
then estimate policy counterfactuals.
58
Bernardini and De Nicola (2020).
-0.6
-0.4
-0.2
0.0
0.2
0.4
0.6
0.8
1.0
2011 2012 2013 2014 2015 2016 2017 2018 2019 2020 2021
NL
FR
ES
GR
IT

ECB Occasional Paper Series No 304 / September 2022
43
estimated that, at the peak of the pandemic crisis, an outright purchase of long-term government
bonds reduced the corresponding yields by around ten basis points per billion euro, compared with
around 2 to 5 basis points per billion euro in quieter periods. These results suggest that a targeted
distribution of asset purchases over the course of the day can enhance the overall effectiveness of
an asset purchase programme. In particular, stepping-up the pace of purchases at times when
selling pressures prevail helps to neutralise upward pressures on yields.
Box 4
The NGEU programme and its implications for monetary policy implementation
Presentation of the NGEU funding programme
The European Commission launched the NGEU programme to support economic recovery from the
pandemic. The NGEU package consists of €750 billion in grants and loans to be distributed from
the EU to its Member States. This temporary instrument complements the EU budget and is
focused on a green and digital recovery. A coordinated policy response at European level was
essential to avoid uneven recovery and economic fragmentation within the European Union. This
box elaborates on the implications of NGEU for the financial markets and for monetary policy
implementation.
The implications of the NGEU programme for financial markets
The issuance needs of the NGEU programme significantly increase EU issuance activity, not only
compared with its own regular issuances but also vis-à-vis EU sovereigns, making the EU one of
the largest issuers in the euro area in the coming years. To fund the NGEU programme, the
European Commission will raise up to around €800 billion on financial markets by 2026, equivalent
to borrowing volumes of roughly €150 billion per year. Borrowing will be repaid by 2058. In 2021,
the Commission already issued €71 billion in bonds and €22 billion in bills to start funding the
recovery packages for the European Union’s Member States. These securities were issued using a
diversified funding strategy, as explained below.
NGEU issuance is expected to result in a deep and liquid EU bond market, ensuring a truly liquid,
risk-free euro interest rate curve (Chart A). The NGEU funding strategies include long and short-
term funding. Long-term funding (EU bonds with maturities from 3 to 30 years) is aimed at building
a liquid benchmark yield curve. Short-term funding (EU bills with three-month and six-month
maturities) helps to manage financing needs and liquidity risk by granting access to the money
market and attracting new types of investors. As part of the long-term funding strategy, the
European Commission is seeking to raise 30% of the programme using green bonds (about €250
billion), therefore becoming the world’s largest green bond issuer by 2026. To this end, the
Commission has developed the NGEU Green Bond Framework based on International Capital
Market Association (ICMA) criteria and partially following the European taxonomy, the latter
currently under discussion by the Commission.

ECB Occasional Paper Series No 304 / September 2022
44
Chart A
EU benchmark yield curve against selected euro area countries
(percentages per annum)
Source: Bloomberg
Notes: yield curves at 31 December 2021.
From June 2021 to the end of 2021, the Commission undertook eight NGEU bond issuances on the
five-year to 30-year benchmark yields for a total amount of €71 billion. These issuances received
strong interest from investors. Order books were largely oversubscribed, by up to 13.8 times for the
30-year benchmark yield. In issuing its first NGEU green bond, the Commission conducted the
largest transaction ever on the green bond market. This issuance was met with strong investor
interest, with the final book over 11 times oversubscribed for a final issued volume of €12 billion.
Market participants explained the strong demand by a still narrow green bond universe with many
green funds actively searching for green securities.
Implications for monetary policy
The NGEU programme is expected to contribute positively to the implementation of monetary policy
by the ECB. First, by easing the funding needs of individual Member States, the NGEU package is
expected to assist in containing the rise of economic divergences among Member States. It is
therefore expected to ease any latent fragmentation in the euro area and to complement the
PEPP/APP programmes in ensuring the smooth transmission of monetary policy (Chart, panel a).
Second, the NGEU programme sent a signal of increased EU cohesion and solidarity, contributing
to reducing risk premia across the euro area. Third, NGEU bonds typically serve as collateral for
Eurosystem operations and are purchasable under outright asset purchase programmes. Given the
large size of issuances anticipated, the NGEU programme will therefore increase the universe of
Eurosystem eligible bonds in the supranational space. In 2021 the NGEU programme represented
more than 40% of issuances in the supranational Eurosystem eligible space, which increased from
€105 billion in 2020 to €165 billion in 2021 on the back of NGEU issuances (Chart B, panel b).
-1.0
-0.5
0.0
0.5
1.0
1.5
2.0
2.5
3M 6M 2Y 4Y 5Y 6Y 7Y 8Y 9Y 10Y 15Y 20Y 25Y 30Y
EU
FR
DE
IT
ES

ECB Occasional Paper Series No 304 / September 2022
45
Chart B
Impact of NGEU on markets and EU issuance activity
a) Euro area GDP-weighted sovereign bond yields and OIS rates
(percentages per annum)
b) Issuance of Eurosystem eligible supranational assets
(EUR billions)
Source: Bloomberg, ECB, ECB calculations.
Note: Panel b includes all supranational issuance in a given year eligible for Eurosystem operations from the end of the respective year.
-0.8
-0.6
-0.4
-0.2
0.0
0.2
0.4
0.6
0.8
10/19 12/19 02/20 04/20 06/20 08/20 10/20 12/20 02/21 04/21 06/21 08/21 10/21 12/21
ECB announces PEPP
EU presents a joint
roadmap for recovery
10y OIS
Euro area GDP-weighted government bond yield
0
20
40
60
80
100
120
140
160
180
2019 2020 2021
Supranational eligible issuance
NGEU

ECB Occasional Paper Series No 304 / September 2022
46
8 Impact of the Eurosystem monetary
policy implementation on its balance
sheet and liquidity conditions
The operations described in Sections 4 and 7 expanded the Eurosystem balance
sheet to an unprecedented level. As a result, both their share as a percentage of the
total balance sheet and as a percentage of GDP rose. The expansion in assets was
mirrored by a mechanical increase in liabilities, mostly in the form of bank reserves
(excess liquidity). While the level of excess liquidity more than doubled over the
review period, its distribution across the Eurosystem changed somewhat.
Autonomous factors
59
had an increasing absorption effect, in particular, due to the
fiscal response to the pandemic crisis (and the related increase in government
deposits), and as a result of the increase in demand for banknotes and of higher
deposits inflows from non-euro area residents.
8.1 Impact of Eurosystem monetary policy implementation on
its balance sheet
The monetary policy response to the COVID-19 crisis translated into
accelerated growth of the Eurosystem balance sheet. Since the global financial
crisis, MPIs have contributed to a substantial increase in the Eurosystem balance-
sheet size. Over the review period, the monetary policy response to the outbreak of
COVID-19 contributed to the fastest-growth period in the history of the Eurosystem
balance sheet (Chart 19). This was mainly due to the implementation of the PEPP
programme and to the high demand for the TLTRO III series. By the end of 2021, the
Eurosystem balance sheet had reached a historic high of €8.4 trillion, an increase of
€3.8 trillion since 31 December 2019.
59
Autonomous factors are central bank balance-sheet assets and liabilities that affect the amount of
excess liquidity available to the banking system but that are not under the direct control of the central
bank. In this report we focus on the balance sheet from a monetary policy perspective, therefore all
balance-sheet items that are not relevant from this perspective would fall under autonomous factors.

ECB Occasional Paper Series No 304 / September 2022
47
Chart 19
MPIs in the Eurosystem balance sheet
a) MPIs (assets) in the Eurosystem balance sheet
(left-hand scale: EUR trillions; right-hand scale: percentages)
b) Eurosystem liabilities: how liquidity is used
(EUR trillions)
Source: ECB
Notes: the charts deviate from a pure (accounting) balance-sheet perspective and focus on the key elements relevant from a monetary
policy perspective. As a result, the total Eurosystem balance sheet in terms of assets (accounting balance sheet) is higher than the
sum of the liabilities items shown in Panel a because it includes (asset) autonomous factors. However, when all autonomous factors
(both assets and liabilities) are aggregated and netted out, they result in a net liquidity absorption (liability), which is the relevant figure
from a monetary policy perspective. Credit operations here include MROs, LTROs, TLTROs and MLFs; outright purchases include
CBPP1-2, SMP, APP, PEPP operations. MPIs include lending operations and outright purchases.
The share of monetary policy assets increased, both as a percentage of GDP
and as a percentage of the Eurosystem balance sheet. The increase in the
balance sheet was predominantly driven by the expansion of monetary policy assets,
increasing from €3.3 trillion at the end of 2019 to €6.8 trillion at the end of 2021,
thereby reaching a value equating to almost 60% of GDP (Chart 19a). Within
monetary policy assets, 55% of the increase was due to asset purchase
programmes, while 45% to credit operations. Given the comparatively lower level of
outstanding credit operations at the end of 2019, this translated into a more
significant increase in credit operations as a share of the Eurosystem balance sheet
(Table 4).
0%
10%
20%
30%
40%
50%
60%
70%
0
1
2
3
4
5
6
7
8
9
2007 2008 2009 2010 2011 2012 2013 2014 2015 2016 2017 2018 2019 2020 2021
Millions
Monetary policy - Credit operations
Monetary policy - Assets purchase programmes
Non-monetary policy assets
Monetary policy instruments as % of GDP (right-hand scale)
Total Eurosystem balance sheet
0
1
2
3
4
5
6
7
8
9
2007 2008 2009 2010 2011 2012 2013 2014 2015 2016 2017 2018 2019 2020 2021
Millions
Net autonomous factors
MRR
Excess liquidity

ECB Occasional Paper Series No 304 / September 2022
48
The significant monetary policy interventions were mirrored by a mechanical
increase in Eurosystem liabilities, primarily as excess liquidity. High TLTRO III
take-up and asset purchase programmes resulted in a comparable
60
increase in
central bank overnight deposits, thereby increasing excess liquidity in the banking
system from €1.7 trillion at the end of 2019 to €4 trillion by the end of 2021.
Considering the Eurosystem balance sheet from a liquidity perspective (Chart 19b),
the residual increase in liabilities was due to autonomous factors, absorbing liquidity
on the net (see Section 8.3) – and MRRs, which have marginally increased with the
higher deposit base (see Section 3). Overall, in terms of the (accounting) balance
sheet, the relative share of central bank reserves increased from 39% to 50% as a
percentage of the Eurosystem balance sheet (Table 4).
Table 4
Composition of the accounting Eurosystem balance sheet at the end of 2019 and of
2021
ASSETS
Q4 2019
Q4 2021
Securities held for monetary policy purposes
56%
55%
Lending to euro area credit institutions
(a)
13%
26%
Non-monetary policy assets
(b)
31%
19%
LIABILITIES
Q4 2019
Q4 2021
Banknotes
28%
18%
Central bank reserves
(c)
39%
50%
Non-monetary policy deposits
13%
17%
Capital & reserves and other
20%
15%
Source: ECB.
Notes: (a) includes refinancing operations and the MLF; (b) includes foreign currencies, gold, euro-denominated own fund portfolios,
emergency liquidity assistance (ELA) and other assets; (c) includes current account assets (both required and excess reserves) and
the DF.
8.2 Excess liquidity and its distribution
Excess liquidity results from the holding of central bank reserves either in
banks’ current accounts or at the DF. Eurosystem eligible counterparties have two
options for depositing their reserves overnight. They can leave them on their current
accounts with their respective NCB in excess of their MRR or move them overnight
to the DF. In the current negative-interest-rate environment, both accrue the same
remuneration, which remained at -0.50% over the review period. Only reserves held
in current accounts may benefit from the TTS (see Section 3). Credit institutions
and/or eligible counterparties tended to keep their excess liquidity in current
accounts. Some counterparties nevertheless transferred their reserves to the DF,
mainly for internal reasons such as accounting processes relating to the
remuneration of accounts or for liquidity management considerations. Current
accounts increased from €2,288 billion in 2020 to €3,535 billion in 2021, while
60
Monetary policy operations do not typically translate one-to-one into central bank overnight deposits
given that some liquidity flows into the balance sheet of the central bank as autonomous factors.

ECB Occasional Paper Series No 304 / September 2022
49
recourse to the DF increased from €372 billion in 2020 to €690 billion in 2021 (all
based on daily averages, Chart 20). However, the percentage of excess liquidity held
in the DF decreased significantly after the announcement of the two-tier system, as it
only considers the excess reserves to fulfil the exempted tier. By the end of 2021,
the DF was used by only about 60 banks in the Eurosystem.
Chart 20
Excess liquidity and its balance sheet components
(left-hand scale: EUR billions; right-hand scale: percentages)
Source: ECB
Over the review period, there were some changes to the distribution of excess
liquidity over jurisdictions and banks. Although the largest share of excess
liquidity in the euro area was still held in banks located in Germany, France, the
Netherlands, Finland, and Luxembourg, their share decreased from 77% to 69%
over the review period (Chart 21a). Banks located in Italy and, more marginally, in
Spain, Ireland, Greece, Austria, and Portugal increased their excess liquidity
holdings. This was mainly attributable to banks’ broad participation in the TLTRO III
series (and the subsequent deposit of their overnight liquidity with the Eurosystem) in
combination with the TTS. Some redistribution had previously occurred as a result of
the trading of reserves due to the introduction of the TTS in late 2019 (see Section
3). Overall, the concentration of excess liquidity among the top four holders in each
jurisdiction increased, except for Germany, France and Finland
61
(Chart 21b).
61
Ignoring decreases in countries where the share of the top 4 was already above 80% in 2019.
0%
5%
10%
15%
20%
25%
30%
35%
40%
0
500
1,000
1,500
2,000
2,500
3,000
3,500
4,000
4,500
5,000
01/19 07/19 01/20 07/20 01/21 07/21
Excess liquidity held on current accounts
Deposit facility
% held in the deposit facility
TTS announcement

ECB Occasional Paper Series No 304 / September 2022
50
Chart 21
Distribution of excess liquidity over selected maintenance periods
a) Across jurisdictions
b) Across banks, by jurisdiction
(percentages)
(percentages)
Source: ECB
Notes: MP stands for maintenance period. Panel a shows jurisdictions with excess liquidity of at least 5% of the Eurosystem excess
liquidity in either MP7 2019 or MP7 2021. In Panel b, ‘1’ stands for MP 7 2019 and ‘2’ for MP 7 2021. It should be noted that the
concentration within every jurisdiction is also a function of the local banking system structure. For example, the number of banks in
Germany and Italy is higher than in Spain, France and the Netherlands.
8.3 Developments in autonomous factors
Autonomous factors are relevant for monetary policy implementation since
they affect the amount of excess liquidity. Autonomous factors are central bank
balance-sheet assets and liabilities that affect the amount of excess liquidity
available to the banking system but that are not under the direct control of the central
bank. In the euro area, NCBs forecast and analyse developments in autonomous
factors as part of their daily liquidity management activities. In addition, the
Eurosystem regulates its non-monetary policy activities through the Agreement on
Net Financial Assets (ANFA) and the Guideline on domestic assets and liabilities
management
62
. The former sets out the rules and limits for holdings of financial
assets that are related to the national tasks of NCBs
63
, while the latter ensures that
NCBs’ non-monetary policy activities do not hinder monetary policy implementation
and sets the appropriate remuneration to disincentivise excessive non-monetary
policy deposits being held with NCBs.
The combination of monetary and fiscal stimulus in response to the pandemic
crisis had a significant effect on banknotes, government deposits, and
62
Guideline (EU) 2019/671 of the European Central Bank of 9 April 2019 on domestic asset and liability
management operations by the national central banks (recast) (ECB/2019/7), (OJ L 113, 29.4.2019, p.
11).
63
Such NCB financial assets may relate, for example, to counterpart items for their capital and
accounting reserves or other specific liabilities, their foreign reserves and employee pension funds or
may be held for general investment purposes.
32%
28%
25%
24%
9%
8%
6%
5%
5%
4%
6%
9%
6%
8%
3%
5%
7%
9%
0%
10%
20%
30%
40%
50%
60%
70%
80%
90%
100%
MP7 19 MP7 21
DE
FR
NL
LU
FI
IT
ES
BE
Others
22
22
38
43
70
73
28
42
72
71
48
67
58
71
55
80
18
20
29
26
18
16
27
22
26
26
22
17
24
17
33
14
60
58
33
31
13
12
45
36
2
3
30
16
19
11
12
6
0%
10%
20%
30%
40%
50%
60%
70%
80%
90%
100%
1 2 1 2 1 2 1 2 1 2 1 2 1 2 1 2
DE FR NL LU FI IT ES BE
TOP 4
TOP 5-10
11-Rest

ECB Occasional Paper Series No 304 / September 2022
51
deposits of non-euro area residents. These three autonomous factors are the
main liquidity-absorbing factors on the Eurosystem balance sheet and accounted for
an overall increase in liquidity absorption over the review period of around €755
billion, of which €220 billion in banknotes, €450 billion in government deposits and
€85 billion in deposits of non-euro area residents. Chart 22 summarises how these
three factors developed over the review period.
Chart 22
Main liquidity-absorbing autonomous factors
(left-hand scale: EUR billions; right-hand scale: percentages per annum)
Source: ECB
Banknotes in circulation accelerated over the review period, mostly for
precautionary purposes. After some years of strong growth in euro banknotes in
circulation (around 5% in 2017-2019, i.e. significantly above GDP growth), the net
issue of banknotes accelerated in the review period, reaching growth rates of up to
10%. The value of outstanding euro banknotes increased by €220 billion, equivalent
to an average annual growth rate of 9.5% (Chart 22a). Recent payment surveys
indicate that the share of cash transactions in the euro area underwent a significant
decline, which gained further momentum due to the COVID-19 pandemic
64
. In
addition, euro banknote cumulated net shipments abroad (cumulated euro
banknotes leaving the euro area minus euro banknotes coming in from outside the
euro area) suggest that demand from outside the euro area did not contribute to the
high demand, largely due to the greatly reduced air traffic. It follows from these two
circumstances that the increase in banknotes in circulation during the study period
was mainly attributable to store-of-value (hoarding) or precautionary approaches
65
.
However, banknotes have also been used increasingly to avoid negative
remuneration on central bank (e.g. vault cash) and commercial bank accounts given
that excess liquidity increased strongly.
Government deposits rose substantially as a result of the fiscal response to
the COVID-19 crisis. Deposits by Treasuries and other public authorities
64
ECB (2021c).
65
These developments are not new. The 2007-2008 financial crisis showed similar dynamics.
0%
2%
4%
6%
8%
10%
12%
900
1,000
1,100
1,200
1,300
1,400
1,500
1,600
2015 2017 2019 2021
a) Banknotes
Level (left-hand scale)
Annual growth (right-hand scale)
-100%
-50%
0%
50%
100%
150%
200%
0
50
100
150
200
250
300
350
400
450
500
2015 2017 2019 2021
c) Deposits of non-euro
area residents and EU
institutions
-20%
0%
20%
40%
60%
80%
100%
120%
140%
160%
0
100
200
300
400
500
600
700
800
900
2015 2017 2019 2021
b) Government deposits

ECB Occasional Paper Series No 304 / September 2022
52
(hereinafter, ‘government’) held with NCBs have historically represented the more
volatile and hard-to-predict autonomous factor given that they are affected by any
financial operation conducted by governments, such as debt issuance and
redemptions, collection of taxes and payments of pensions, as well as their liquidity
preferences. These operations are generally country-specific, depending on
governments’ investment frameworks and institutional arrangements with the
respective NCB. In this regard, different NCBs in the euro area have different fiscal
agent roles and responsibilities in conducting cash management activities on behalf
of the government in their respective jurisdictions, and different frameworks for
managing short-term investments. In the review period, government deposits
increased sharply, reaching peak levels above €750 billion, more than doubling in
size compared with previous years (Chart 22b). The main reason for the significant
growth was the fiscal response to the economic fallout caused by the COVID-19
outbreak. In general, Treasuries in euro area countries provisioned their balances
through debt issuances to cover expenditures of uncertain amounts in the short term.
It is expected that these higher levels of government deposits will gradually be
reduced at a pace proportional to economic recovery in the euro area. Given the
volatility of government deposits and their weight in autonomous factors, the
Eurosystem has historically set limitations on their remuneration to provide
incentives for governments to place their deposits in the market
66
. From January
2022, the €STR became the applicable ceiling for the remuneration of government
deposits under the prevailing negative-interest-rate environment, substituting for the
discontinued euro overnight index average (EONIA).
Deposits of non-euro area residents and EU institutions increased overall
more marginally compared with previous periods but with a stronger increase
towards year-ends. These deposits are primarily part of the Eurosystem reserve
management services (ERMS) that NCBs offer to foreign central banks, international
organisations, and foreign governments. Money market rates trading below the DFR
have made the fixed-rate and safe conditions offered on these accounts relatively
attractive, especially on end-of-period reporting dates when market rates turn
particularly volatile and alternative investment opportunities with credit institutions
are limited (Chart 22c). Over the review period, three additional events were
noteworthy. First, the peak observed between March and June 2020 was due to euro
lending to the Federal Reserve in exchange for borrowing US dollars amid the US
dollar swap operations that were enhanced in March 2020 to support the smooth
functioning of US dollar funding markets in the euro area
67
. Second, the higher
deposits observed in 2021 were mostly linked to the provision of funds for the NGEU
recovery programme. Finally, year-end money market pressure in 2021 started
earlier than in previous years, indicating the increased unwillingness of banks to take
in deposits over year-end because of regulations, bank levies, and other balance-
sheet concerns.
66
Art. 4 of Guideline ECB/2019/7.
67
This temporal increase was registered in the ECB balance sheet.
ECB Occasional Paper Series No 304 / September 2022
53
References
Alvarez, I. et al. (2016), “The use of the Eurosystem’s MPIs and operational
framework since 2012”, ECB Occasional Paper, No 188, European Central Bank,
Frankfurt am Main, August.
Auria, L., Bingmer, M., Caicedo Graciano, M. C., Charavel, C., Gavilá, S.,
Iannamorelli, A., Levy, A., Maldonado, A., Resch, F., Rossi, A. M. and Sauer, S.
(2021), “Overview of central banks’ in-house credit assessment systems in the euro
area”, ECB Occasional Paper Series, No 284, European Central Bank, Frankfurt am
Main, October.
Bernardini, M. and Conti, A.M. (2021), “Assessing the flexible implementation of the
ECB’s pandemic asset purchases”, Covid-19 Note, Banca d’Italia, Rome, 20
December.
Bernardini, M. and De Nicola, A. (2020), “The market stabilization role of central
bank asset purchases: high-frequency evidence from the COVID-19 crisis”, Working
papers, No 1310, Banca d’Italia, Rome, December.
Bindseil, U., Corsi, M., Sahel, B. and Visser, A. (2017), “The Eurosystem collateral
framework explained”, ECB Occasional Paper Series, No 189, European Central
Bank, Frankfurt am Main, May.
Bock et al. (2018), “The use of the Eurosystem's monetary policy instruments and its
monetary policy implementation framework Q2 2016 - Q4 2017”, ECB Occasional
Paper, No 209, European Central Bank, Frankfurt am Main, April.
Cúrdia, V. and Woodford, M. (2011), “The central-bank balance sheet as an
instrument of monetary policy”, Journal of Monetary Economics, Vol. 58, Issue 1, pp.
54-79.
ECB (2020a), “Interconnectedness of derivatives markets and money market funds
through insurance corporations and pension funds”, ECB Financial Stability Review,
European Central Bank, Frankfurt am Main, November.
ECB (2020b), “The provision of euro liquidity through the ECB’s swap and repo
operations”, ECB Blog, European Central Bank, Frankfurt am Main, 19 August.
ECB (2020c), “US dollar funding tensions and central bank swap lines during the
COVID-19 crisis”, ECB Economic Bulletin, Issue 5/2020, European Central Bank,
Frankfurt am Main.
ECB (2021), “Asset purchases: from crisis to recovery”, Speech by Isabel Schnabel
at the Annual Conference of Latvijas Banka on "Sustainable Economy in Times of
Change", European Central Bank, Frankfurt am Main, 20 September.
ECB Occasional Paper Series No 304 / September 2022
54
ECB (2021a), “How effective is the EU Money Market Fund Regulation? Lessons
from the COVID‑19 turmoil”, ECB Macroprudential Bulletin, No 12, European Central
Bank, Frankfurt am Main.
ECB (2021b), “Liquidity usage in TARGET2”, ECB Economic Bulletin, Issue 3/2021,
European Central Bank, Frankfurt am Main.
ECB (2021c), “The paradox of banknotes: understanding the demand for cash
beyond transactional use”, ECB Economic Bulletin, Issue 2/2021, European Central
Bank, Frankfurt am Main.
ECB (2022), “Reforming money market funds”, ECB Macroprudential Bulletin, No 16,
European Central Bank, Frankfurt am Main.
Eser, F. et al, (2012), “The use of the Eurosystem’s monetary policy instruments and
operational framework since 2009”, ECB Occasional Paper, No 135, European
Central Bank, Frankfurt am Main, August.
ESMA (2021), “ESMA Report on Trends, Risks and Vulnerabilities”, No 2, European
Securities and Markets Authority, Paris, September.
FSB (2021), Policy proposals to enhance money market fund resilience: Final report,
Financial Stability Board, Basel, 11 October.
Hudepohl, T., Huiting, J. and Petersen, A. (2021), “Money market funds in the euro
area: Vulnerabilities and the role of macroprudential policy”, SUERF Policy Brief, No
253, Société Universitaire Européenne de Recherches Financières – The European
Money and Finance Forum, Vienna, December.
Sylvestre, J., and Coutinho, C. (2020), “The use of the Eurosystem’s monetary policy
instruments and its monetary policy implementation framework between the first
quarter of 2018 and the fourth quarter of 2019”, ECB Occasional Paper, No 245,
European Central Bank, Frankfurt am Main, June.
Vayanos, D. and Vila J.L. (2021), “A Preferred-Habitat Model of the Term Structure
of Interest Rates”, Econometrica, Vol. 89, January, pp. 77-112.
Acknowledgements
The occasional paper was written by a task force of national central banks and ECB staff.
The authors would also like to thank the members of the Eurosystem’s Market Operations Committee and its substructure, the Working
Group on the Monetary Policy and Foreign Exchange Implementation Framework, for their constructive discussion and helpful
comments. They would also like to thank the members of the Monetary Policy Committee and Risk Management Committee of the
Eurosystem for their helpful comments in response to a consultation carried out by the Market Operations Committee.
Gianluca Persi worked on this paper while employed by the Central Bank of Ireland and has in the meantime left the Central Bank of
Ireland and joined Investlinx Investment Management Ltd. Investlinx Investment Management Ltd disclaimer: “This paper was written in
Gianluca Persi’s individual capacity and is not related to his role at Investlinx Investment Management Ltd. The analysis, content and
conclusions set forth in this paper are those of the authors alone and not of Investlinx Investment Management Ltd. The authors alone
are responsible for the content.”
Editors
Marco Corsi
European Central Bank; email: marco.[email protected]a.eu
Yvo Mudde
De Nederlandsche Bank; email: Y[email protected]
Contributors
Alice Algot-Same
Banque de France; email: Alice.ALGOT-SAME@banque-france.fr
Tom Hudepohl
De Nederlandsche Bank; email: T[email protected]
Ricardo Astorquia Sánchez
Banco de España; email: ricardo.astorquia@bde.es
Katri Järvinen
Suomen Pankki - Finlands Bank; email: katri.jar[email protected]
Aziz Azaidj
Banque de France; email: Aziz.AZAIDJ@Banque-france.fr
Aleksi Paavola
Suomen Pankki - Finlands Bank; email: aleksi.paavola@bof.fi
Andrius Balciunas
European Central Bank; email: andrius.balciunas@ecb.europa.eu
Iskra Pavlova
European Central Bank; email: iskra.pavlova@ecb.europa.eu
Nora Bianco
Central Bank of Malta; email: biancon@centralbankmalta.org
Luisa Pérez Ortiz
Banco de España; email: luisa[email protected]s
Ulrich Daechert
Deutsche Bundesbank; email: ulrich.daechert@bundesbank.de
Gianluca Persi
Investlinx Investment Management Ltd.
email: gianluca.persi@investlinx-etf.com
Adina Elena Fudulache
European Central Bank; email: adina_elena.fudulache@ecb.europa.eu
Daniele Sechi
Banca d’Italia; email: Daniele.Sechi@bancaditalia.it
Daniel Gybas
European Central Bank; email: daniel.gybas@ecb.europa.eu
Joana Sousa-Leite
Banco de Portugal; email: jsleite@bportugal.pt
Carsten Hartkopf
Deutsche Bundesbank; email: carsten.hartkopf@bundesbank.de
Additional contributors
In addition to the main authors, the following staff members at national central banks and the ECB provided useful comments and
reviewed the report:
Alessandro Calza
European Central Bank; email: alessandro.[email protected]opa.eu
Helmut Wacket
European Central Bank; email: helmut.wa[email protected]a.eu
Angelika Lagerblom
European Central Bank; email: angelika.lagerblo[email protected]a.eu
Ralph Weidenfeller
European Central Bank; email: ralph.weidenfeller@ecb.europa.eu
Sebastiaan Pool
European Central Bank; email: sebastiaan.pool@ecb.europa.eu
Thomas Vlassopoulos
European Central Bank; email: thomas.vlassopoulos@ecb.europa.eu

© European Central Bank, 2022
Postal address 60640 Frankfurt am Main, Germany
Telephone +49 69 1344 0
Website www.ecb.europa.eu
All rights reserved. Any reproduction, publication and reprint in the form of a different publication, whether printed or produced
electronically, in whole or in part, is permitted only with the explicit written authorisation of the ECB or the authors.
This paper can be downloaded without charge from the ECB website, from the Social Science Research Network electronic library or
from RePEc: Research Papers in Economics. Information on all of the papers published in the ECB Occasional Paper Series can be
found on the ECB’s website.
PDF ISBN 978-92-899-5245-3, ISSN 1725-6534, doi:10.2866/601341, QB-AQ-22-047-EN-N
